2073
Steady-state CEST-MRI using a reduced saturation period: Application to volumetric APT and rNOE brain imaging at 3T1Division of Medical Physics in Radiology, German Cancer Research Center (DKFZ), Heidelberg, Germany, 2Faculty of Physics and Astronomy, University of Heidelberg, Heidelberg, Germany, 3Faculty of Medicine, University of Heidelberg, Heidelberg, Germany
Synopsis
In this study, we demonstrate the feasibility of obtaining steady-state 3D CEST contrasts of the human brain at 3T using a reduced saturation period. To this end, we applied our previous approach, which utilizes the analytical equation of the CEST signal, to an optimized clinical protocol using a fast volumetric snapshot-CEST acquisition. Measurements on model solutions and a volunteer demonstrated the feasibility with almost identical APT and rNOE contrasts for saturation durations as short as 1 second. Consequently, this facilitates quantitative CEST-MRI in humans within a reasonable and clinically relevant time frame.
Introduction
Quantitative CEST imaging has been shown to allow for absolute pH imaging and mapping of metabolite concentrations.1,2 However, most of these techniques require the CEST signal to be in steady-state, entailing long saturation times.3 For clinical applications, therefore, a compromise between sufficiently long saturation and feasible examination times has to be made. Previously, we proposed an approach allowing reconstruction of the steady-state from measurements with reduced saturation time.4 As the underlying analytical signal equation considers pulsed saturation, application to human whole-body MR scanners is directly facilitated. Furthermore, the theoretical framework already incorporates the signal decay during the image acquisition and, thus, is applicable to any appropriate imaging readout for CEST-MRI. The aim of this study was to demonstrate the applicability and versatility of the approach by realizing steady-state volumetric APT and rNOE CEST-MRI at 3T with a reduced saturation period. To this end, the approach was applied to an optimized clinical protocol5 using a 3D snapshot-CEST readout6 and investigated in phantom and volunteer measurements.Methods
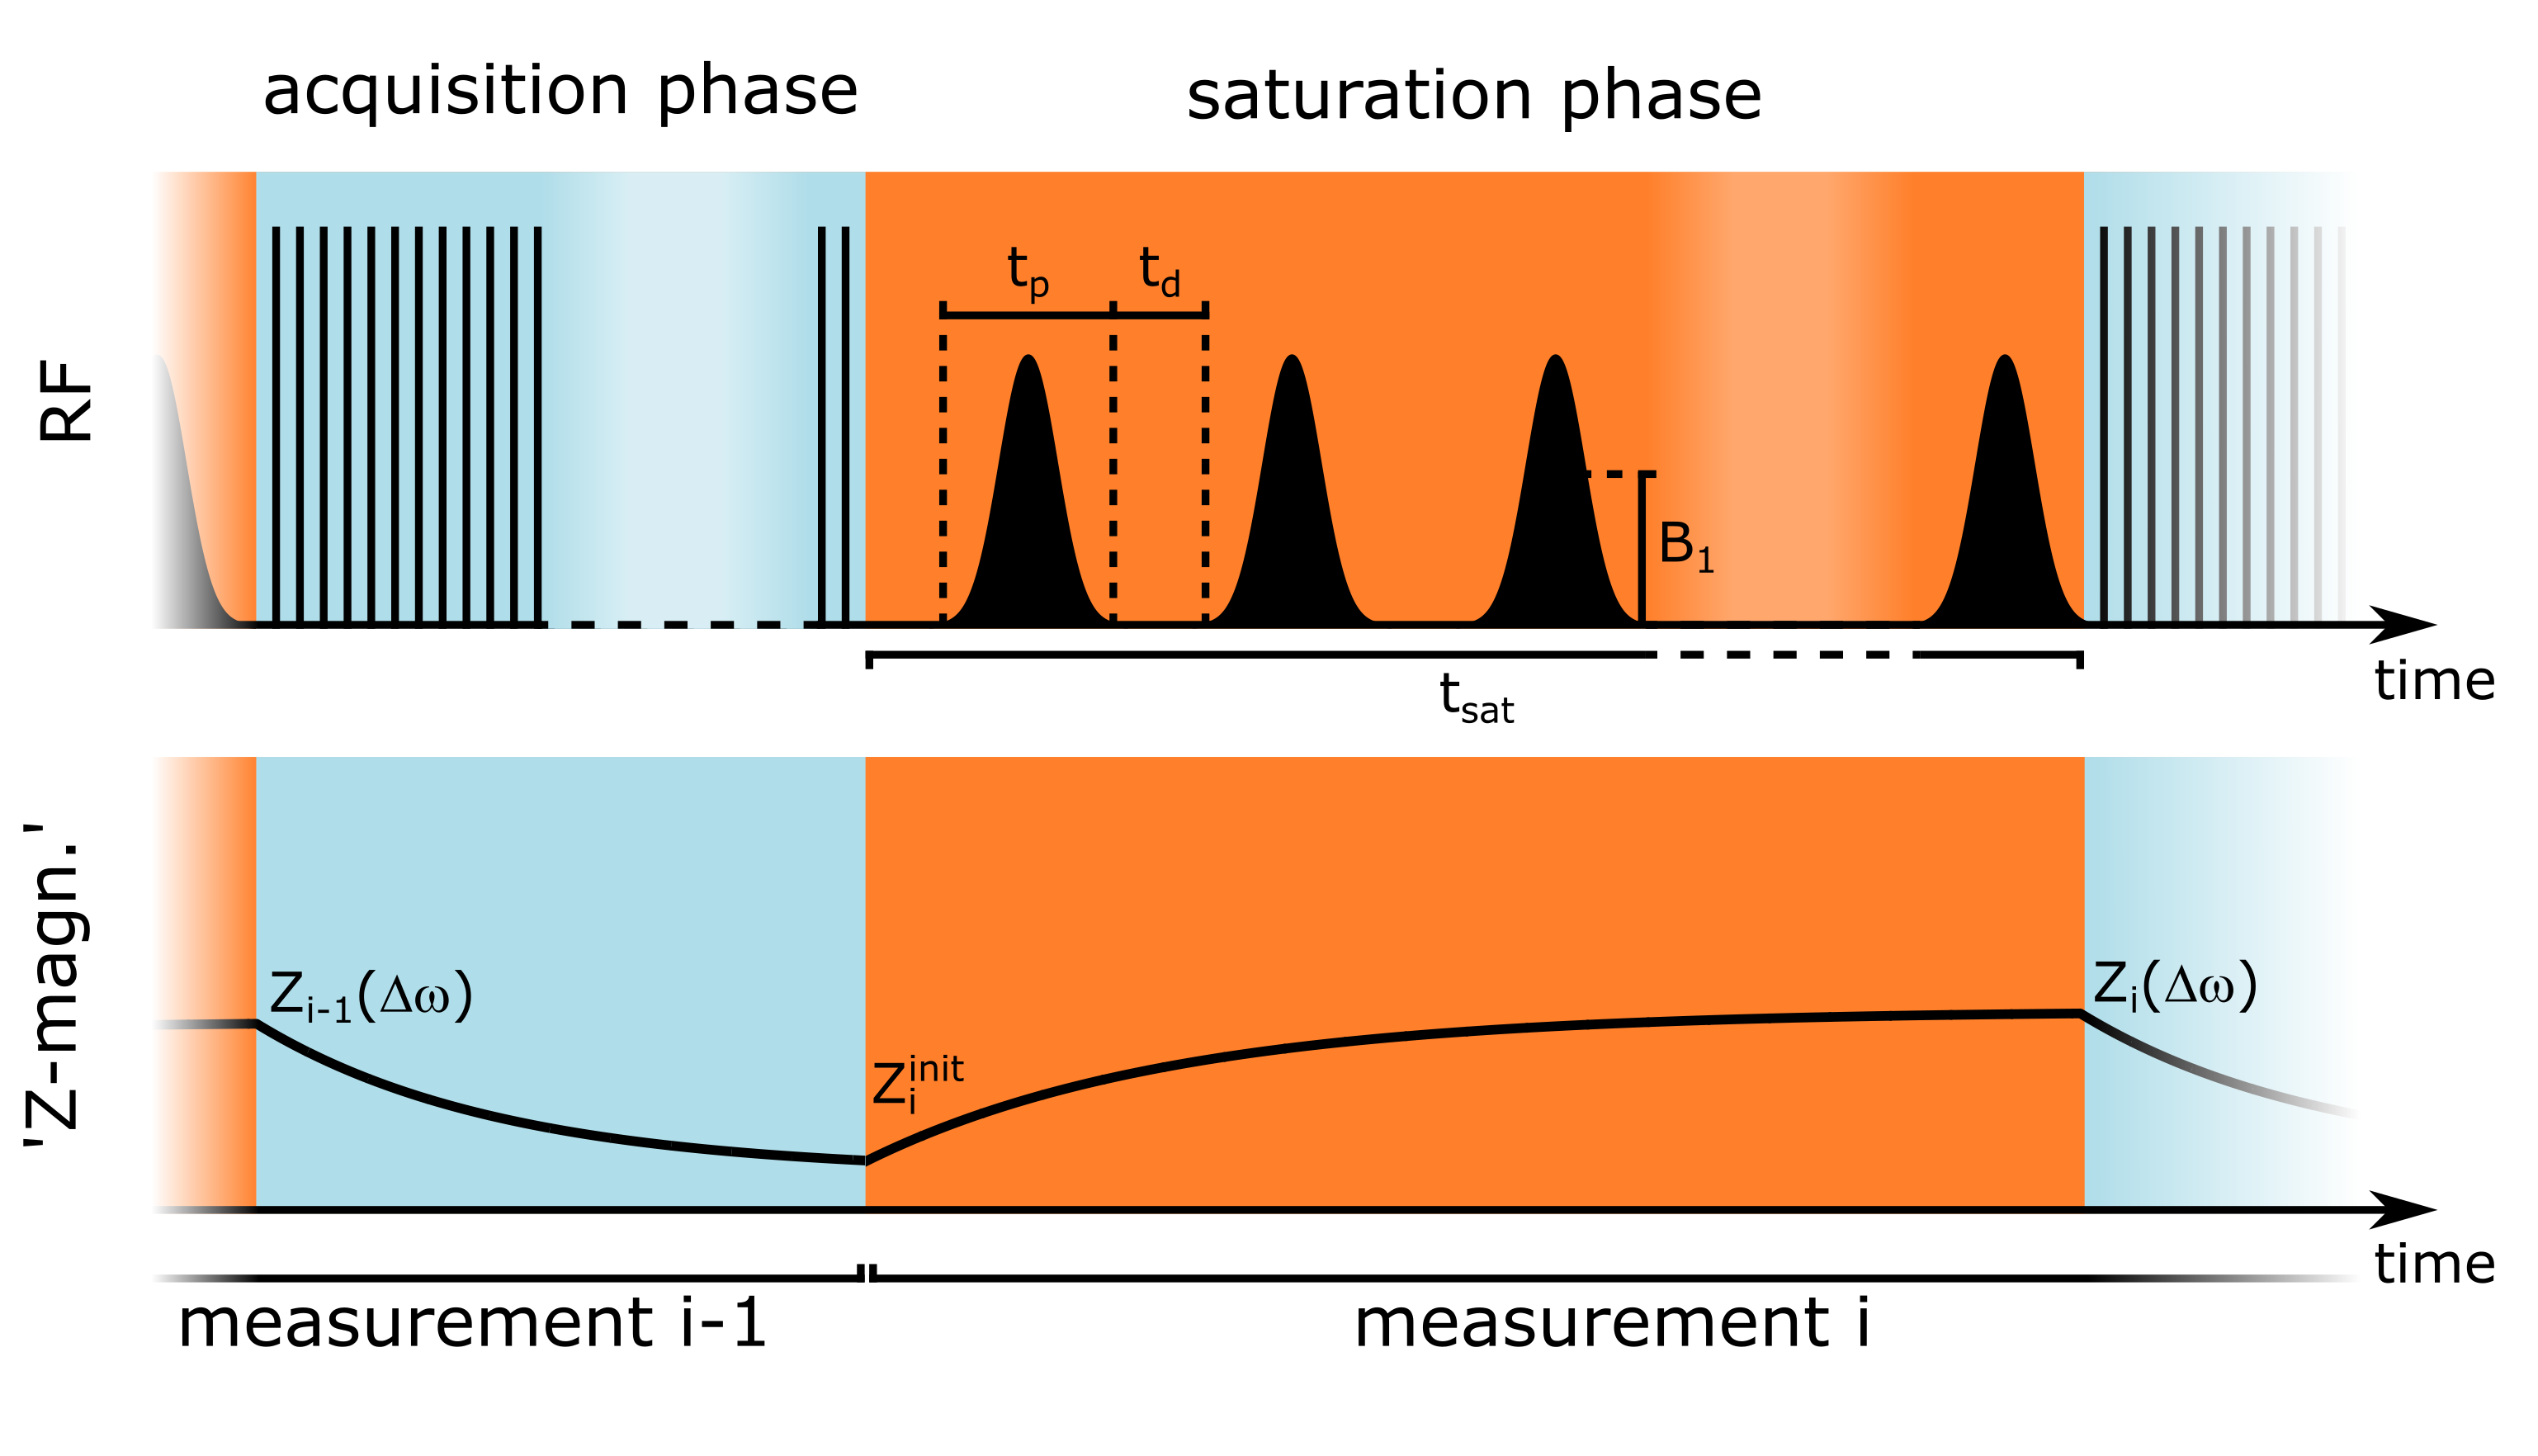
As previously described, the CEST signal equation can be utilized to reconstruct the steady-state for an arbitrary image readout.4 In the following the formalism is briefly repeated. During a pulsed CEST experiment (Fig. 1) the initial Z-magnetization $$$Z^{init}_i$$$ can be assumed to mono-exponentially decay towards the steady-state $$$Z^{ss}$$$ with the effective decay rate depending on $$$Z^{ss}$$$ itself:7,8$$Z_i(\Delta\omega_i,t_{sat})=Z^{ss}(\Delta\omega_i)+\left(Z^{init}_i-Z^{ss}(\Delta\omega_i)\right)\cdot{e}^{-t_{sat}\cdot{R_1}\cdot(1-DC+DC\cdot\cos^2\theta)/Z^{ss}(\Delta\omega_i)}\qquad\qquad{(1)}$$where $$$\theta=\tan^{-1}(\omega_1/\Delta\omega_i)$$$. For a known $$$Z^{init}_i$$$ , this allows determining $$$Z^{ss}$$$ from $$$Z_i$$$ for an arbitrary saturation time tsat using a numerical calculation. $$$Z^{init}_i$$$ depends on the utilized image readout and can be estimated pixelwise by the preceding measurement according to $$$Z^{init}_i=P_1\cdot{Z_{i-1}}+P_0$$$, where $$$P_1$$$ and $$$P_0$$$ are determined in a calibration with the same sequence timings.4For investigation, a phantom containing three bovine serum albumin (5% (w/v)) model solutions with different Gd-DTPA concentrations, and a healthy volunteer were examined. All MR measurements were performed on a 3T whole-body scanner (Siemens Prisma). Imaging was realized using a previously optimized acquisition protocol5 based on a snapshot-CEST readout6 (2×2×4$$$\,$$$mm3 resolution, 12 slices). Presaturation was obtained by using 20 to 500 Gaussian-shaped pulses (mean B1$$$\,$$$=$$$\,$$$0.7$$$\,$$$µT, tp$$$\,$$$=$$$\,$$$20$$$\,$$$ms, duty cycle$$$\,$$$=$$$\,$$$80%) leading to saturation times between tsat = 0.5$$$\,$$$s and 12.5$$$\,$$$s. B0 and B1 were obtained using the WASABI approach9 and T1 with a saturation recovery sequence. APT and rNOE-CEST images were calculated by the linear difference: $$$LD=Z_{ref}-Z$$$. To quantify contrast differences, the relative deviation was calculated for different regions of interest (ROIs):$$\left(\mathrm{mean}(LD-DL_{ss})\pm\mathrm{std}(LD-DL_{ss})\right)/\mathrm{mean}(LD_{ss})\qquad\qquad{(2)}$$, where $$$LD_{ss}$$$ is the steady-state reference.
Results
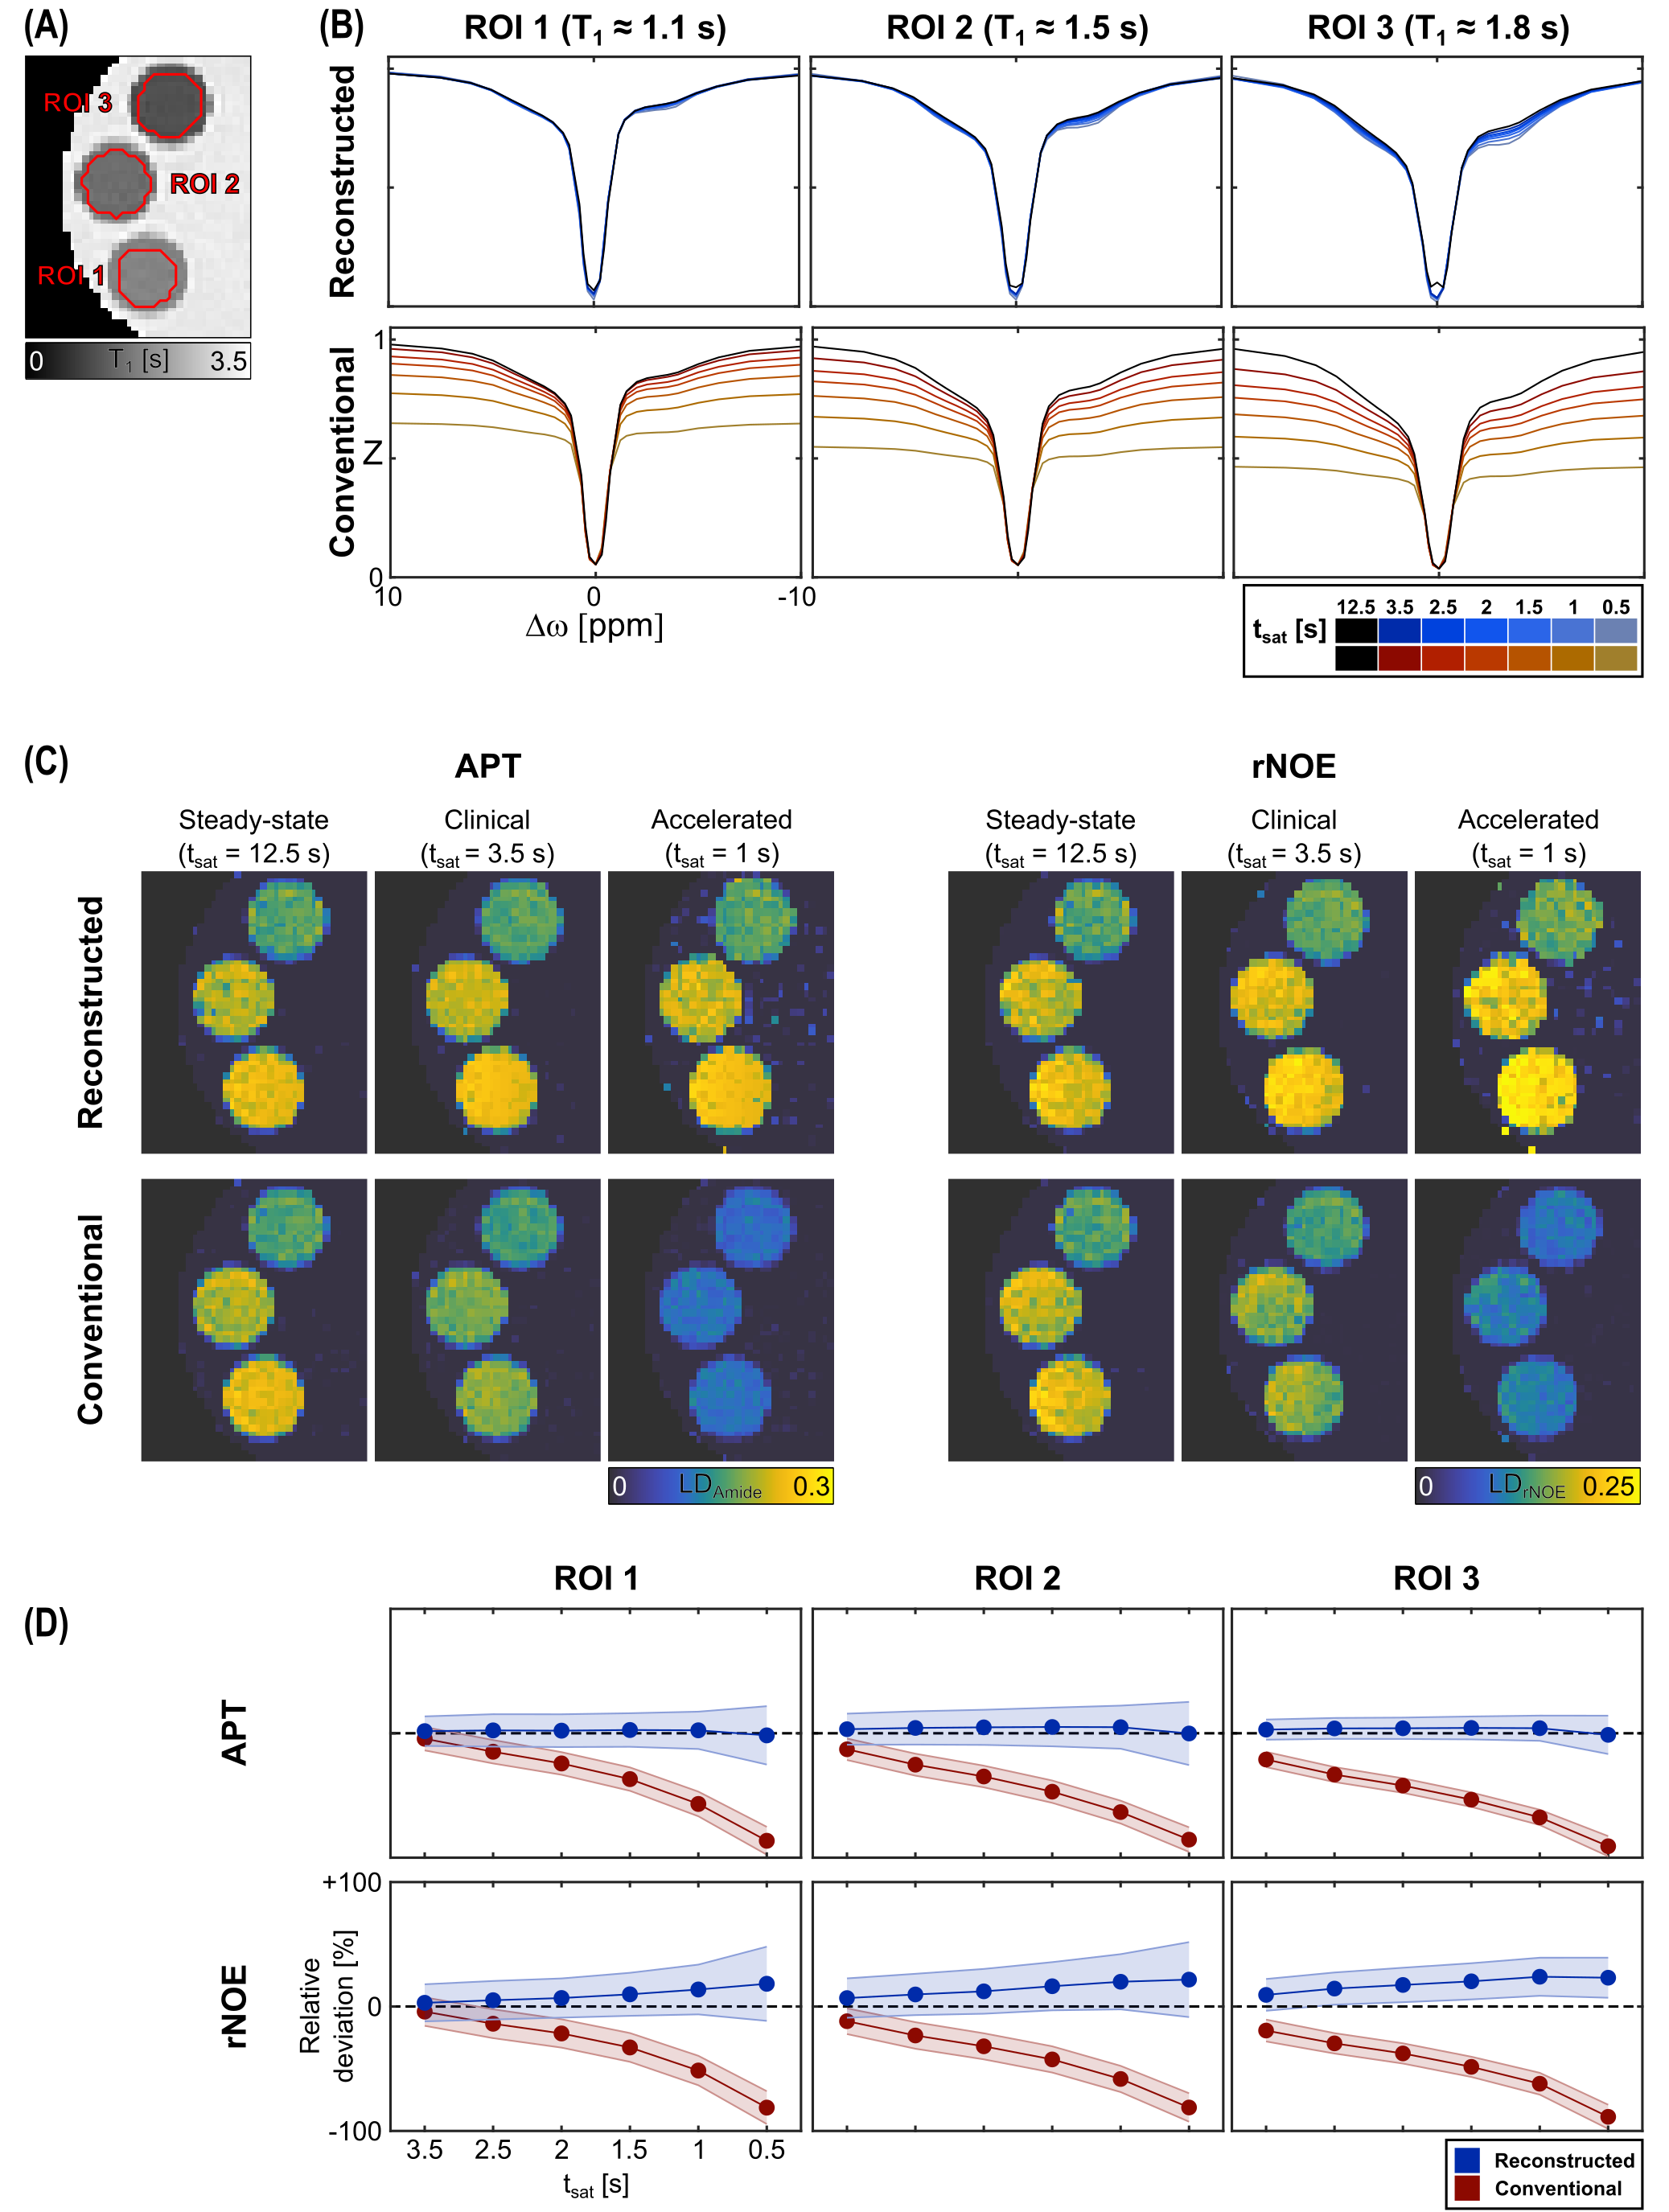
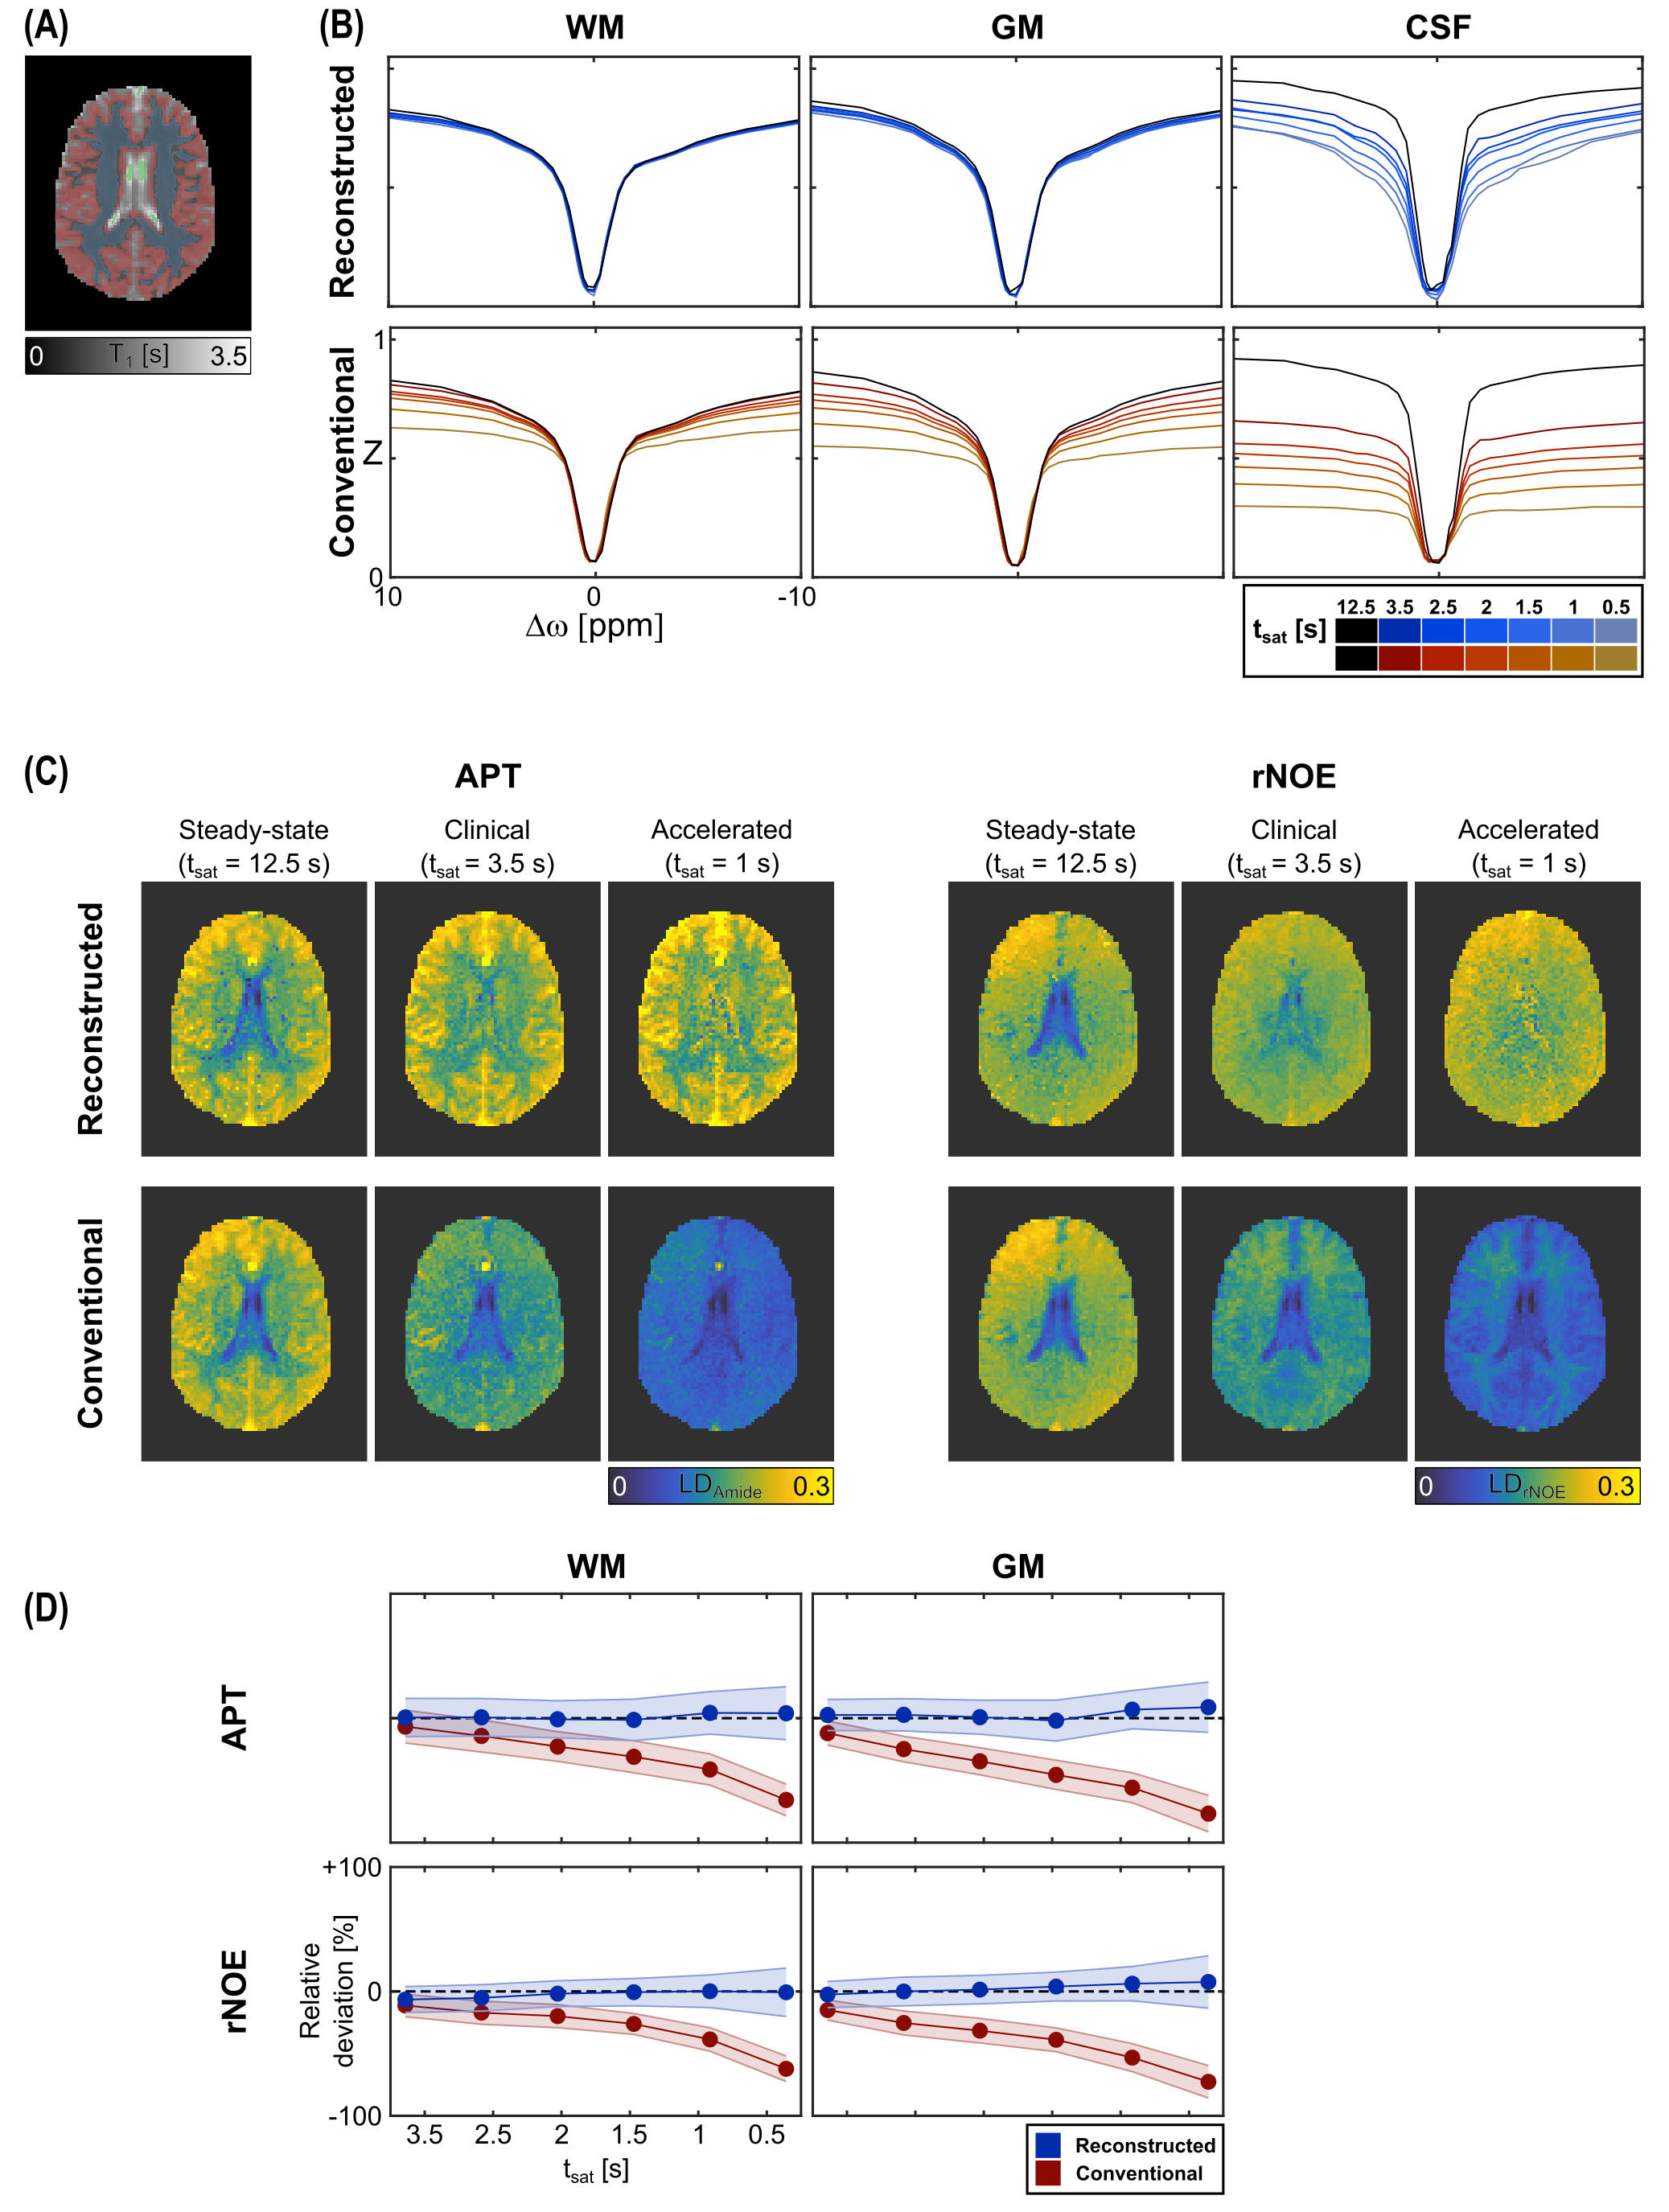
In the phantom measurement, the steady-state-reconstructed Z-spectra exhibit good agreement with the steady-state (Fig. 2B). Small deviations are only observed around Δω = -3.5 ppm, as well as for longer T1 values (~1.8 s). On the other hand, the conventional Z-spectra, as expected, show a strong dependency on the saturation time. For the reconstruction approach, the resulting contrasts are similar to the steady-state (Fig. 2C) with no significant signal deviations for the APT down to saturation times of 0.5 s and only a slight signal increase (~20%) for the rNOE (Fig. 2D). On the other hand, for the conventional contrasts already for clinically applied tsat of 3.5 s significant deviations can be observed, which increase to almost -100% for very short tsat.In the volunteer measurement, the steady-state-reconstructed Z-spectra and image contrasts show good agreement with the steady-state for white (WM) and grey matter (GM) as opposed to an almost complete loss of the original contrast for the conventional approach (Fig. 3). However, in cerebrospinal fluid (CSF) larger differences were apparent.
Discussion
By using the previously proposed approach, the reconstructed Z-spectra and contrasts are in good agreement with the steady-state. For WM and GM, saturation durations as short as 1 second resulted only in negligible deviations. For CSF, however, the steady-state-reconstructed Z-spectra showed larger deviations, resulting in erroneously increased contrast values. This can be understood in terms of partial volume effects that do not allow assigning a single decay rate to each voxel and thereby prevent a correct reconstruction. However, for most applications the focus is on the solid components of the brain. The deviations for the rNOE in the phantom can potentially be explained by the combination of a pulsed saturation and a comparably small exchange rate of the rNOE.10 In this limit, the assumption of a mono-exponential decay (Eq.1) does not hold anymore and rotation effects have to be considered.11 However, for in vivo applications, these effects do not seem to be as severe, as only negligible deviations were observed for the rNOE in GM and WM. In comparison to other similar approaches,12 the utilized formalism in this study does not require the magnetization to be zero after the image readout (e.g. spin-echo) and, thus, can be applied to any appropriate image readout for CEST-MRI, e.g. GRE, BSSFP. Moreover, the theoretical framework of the approach already comprises pulsed saturations and, thus, is applicable to clinical MR scanners.Conclusion
Our study demonstrated that it is possible to obtain 3D APT and rNOE contrasts of the human brain that are virtually identical to the steady-state, with saturation durations as short as 1 second. This is a step towards enabling quantitative CEST-MRI within a reasonable and clinically relevant time frame.Acknowledgements
No acknowledgement found.References
1. Zhou J, Wilson DA, Sun PZ, Klaus JA, van Zijl PCM. Quantitative description of proton exchange processes between water and endogenous and exogenous agents for WEX, CEST, and APT experiments. Magn. Reson. Med. 2004;51:945–952.
2. McMahon MT, Gilad AA, Zhou J, Sun PZ, Bulte JWM, van Zijl PCM. Quantifying exchange rates in chemical exchange saturation transfer agents using the saturation time and saturation power dependencies of the magnetization transfer effect on the magnetic resonance imaging signal (QUEST and QUESP): Ph calibration for poly. Magn. Reson. Med. 2006;55:836–847.
3. Zaiss M, Bachert P. Chemical exchange saturation transfer (CEST) and MR Z-spectroscopy in vivo: a review of theoretical approaches and methods. Phys. Med. Biol. 2013;58:R221–R269.
4. Breitling J, Goerke S, Meissner J-E, et al. Steady-state CEST-MRI using a reduced saturation period. In: Joint Annual Scientic Meeting ISMRM-ESMRMB. Paris, France; 2018.
5. Goerke S, Breitling J, Korzowski A, et al. Clinical routine acquisition protocol for 3D relaxation‐compensated APT and rNOE CEST‐MRI of the human brain at 3T. Magn. Reson. Med. 2021;86:393–404.
6. Zaiss M, Ehses P, Scheffler K. Snapshot-CEST: Optimizing spiral-centric-reordered gradient echo acquisition for fast and robust 3D CEST MRI at 9.4 T. NMR Biomed. 2018;31:e3879.
7. Santyr GE, Fairbanks EJ, Kelcz F, Sorenson JA. Off-resonance spin locking for MR imaging. Magn. Reson. Med. 1994;32:43–51.
8. Zaiss M, Xu J, Goerke S, et al. Inverse Z -spectrum analysis for spillover-, MT-, and T 1 -corrected steady-state pulsed CEST-MRI - application to pH-weighted MRI of acute stroke. NMR Biomed. 2014;27:240–252.
9. Schuenke P, Windschuh J, Roeloffs V, Ladd ME, Bachert P, Zaiss M. Simultaneous mapping of water shift and B1 (WASABI)-Application to field-Inhomogeneity correction of CESTMRI data. Magn. Reson. Med. 2017;77:571–580.
10. Friedman JI, Xia D, Regatte RR, Jerschow A. Transfer Rate Edited experiment for the selective detection of Chemical Exchange via Saturation Transfer (TRE-CEST). J. Magn. Reson. 2015;256:43–51.
11. Roeloffs V, Meyer C, Bachert P, Zaiss M. Towards quantification of pulsed spinlock and CEST at clinical MR scanners: An analytical interleaved saturation-relaxation (ISAR) approach. NMR Biomed. 2015;28:40–53.
12. Kim H, Krishnamurthy LC, Sun PZ. Demonstration of fast multi-slice quasi-steady-state chemical exchange saturation transfer (QUASS CEST) human brain imaging at 3T. Magn. Reson. Med. 2021.
Figures