2072
Towards validation of in vivo U-fibre mapping using post-mortem DWI tractography of V1-V2 connections1Department of Neurophysics, Max Planck Institute for Human Cognitive and Brain Sciences, Leipzig, Germany, 2Department of Education and Psychology, Center for Cognitive Neuroscience Berlin, Free University Berlin, Berlin, Germany, 3Faculty of Physics and Earth Sciences, Leipzig University, Leipzig, Germany, 4Paul Flechsig Institute of Brain Research, University of Leipzig, Leipzig, Germany, 5Berlin Ultrahigh Field Facility, Max Delbrück Center for Molecular Medicine in the Helmholtz Association, Berlin, Germany, 6Institute of Physiology, Charité- Universitätsmedizin Berlin, Berlin, Germany, 7Department of Systems Neuroscience, University Medical Center Hamburg-Eppendorf, Hamburg, Germany, 8Experimental and Clinical Research Center, a joint cooperation between the Charité Medical Faculty and the Max Delbrück Center for Molecular Medicine in the Helmholtz Association, Berlin, Germany, 9Felix Bloch Institute for Solid State Physics, Faculty of Physics and Earth Sciences, Leipzig University, Leipzig, Germany
Synopsis
U-fibres are the most abundant white matter fibres and yet are highly underrepresented in the MRI-derived human brain connectome. Development of validated in vivo pipelines for comprehensive mapping of these short association fibres is therefore essential. Here, we show the correspondence of the geometries of U-fibres connecting early visual cortices mapped in vivo using sub-millimetre resolution diffusion weighted imaging (DWI) tractography to those obtained in a post-mortem brain tissue sample using ultra-high resolution DWI tractography.
Introduction
Short association fibres (U-fibres) within the superficial white matter constitute the shortest connections in the white matter connectome. We previously proposed a method to map the U-fibres in vivo using sub-millimetre resolution diffusion weighted imaging (DWI) tractography1. We validated that our method reproduced the retinotopically-ordered connectivity between the primary and secondary visual cortical areas (V1 and V2, respectively) in the human early visual processing stream by combining our DWI tractography with functional retinotopy1. Here, we independently validate in vivo mapping of U-fibres using ultra-high resolution post-mortem DWI tractography as a reference in a corresponding anatomical area.Materials and Methods
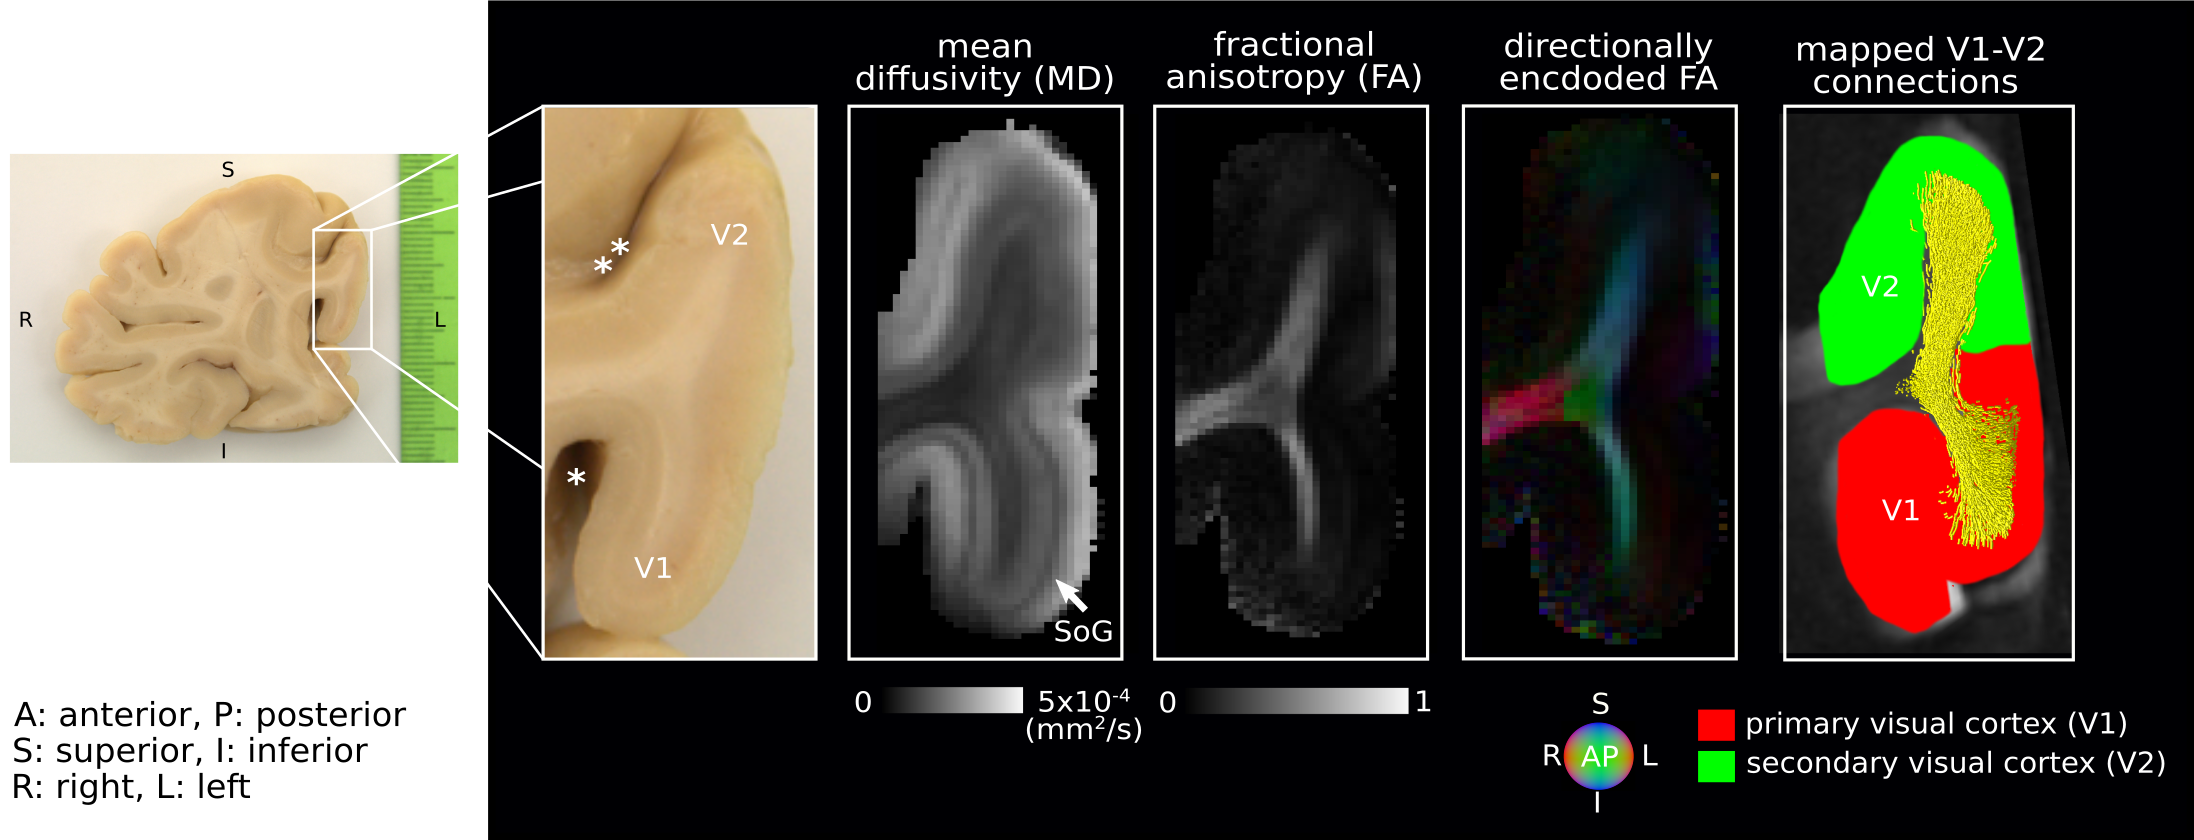
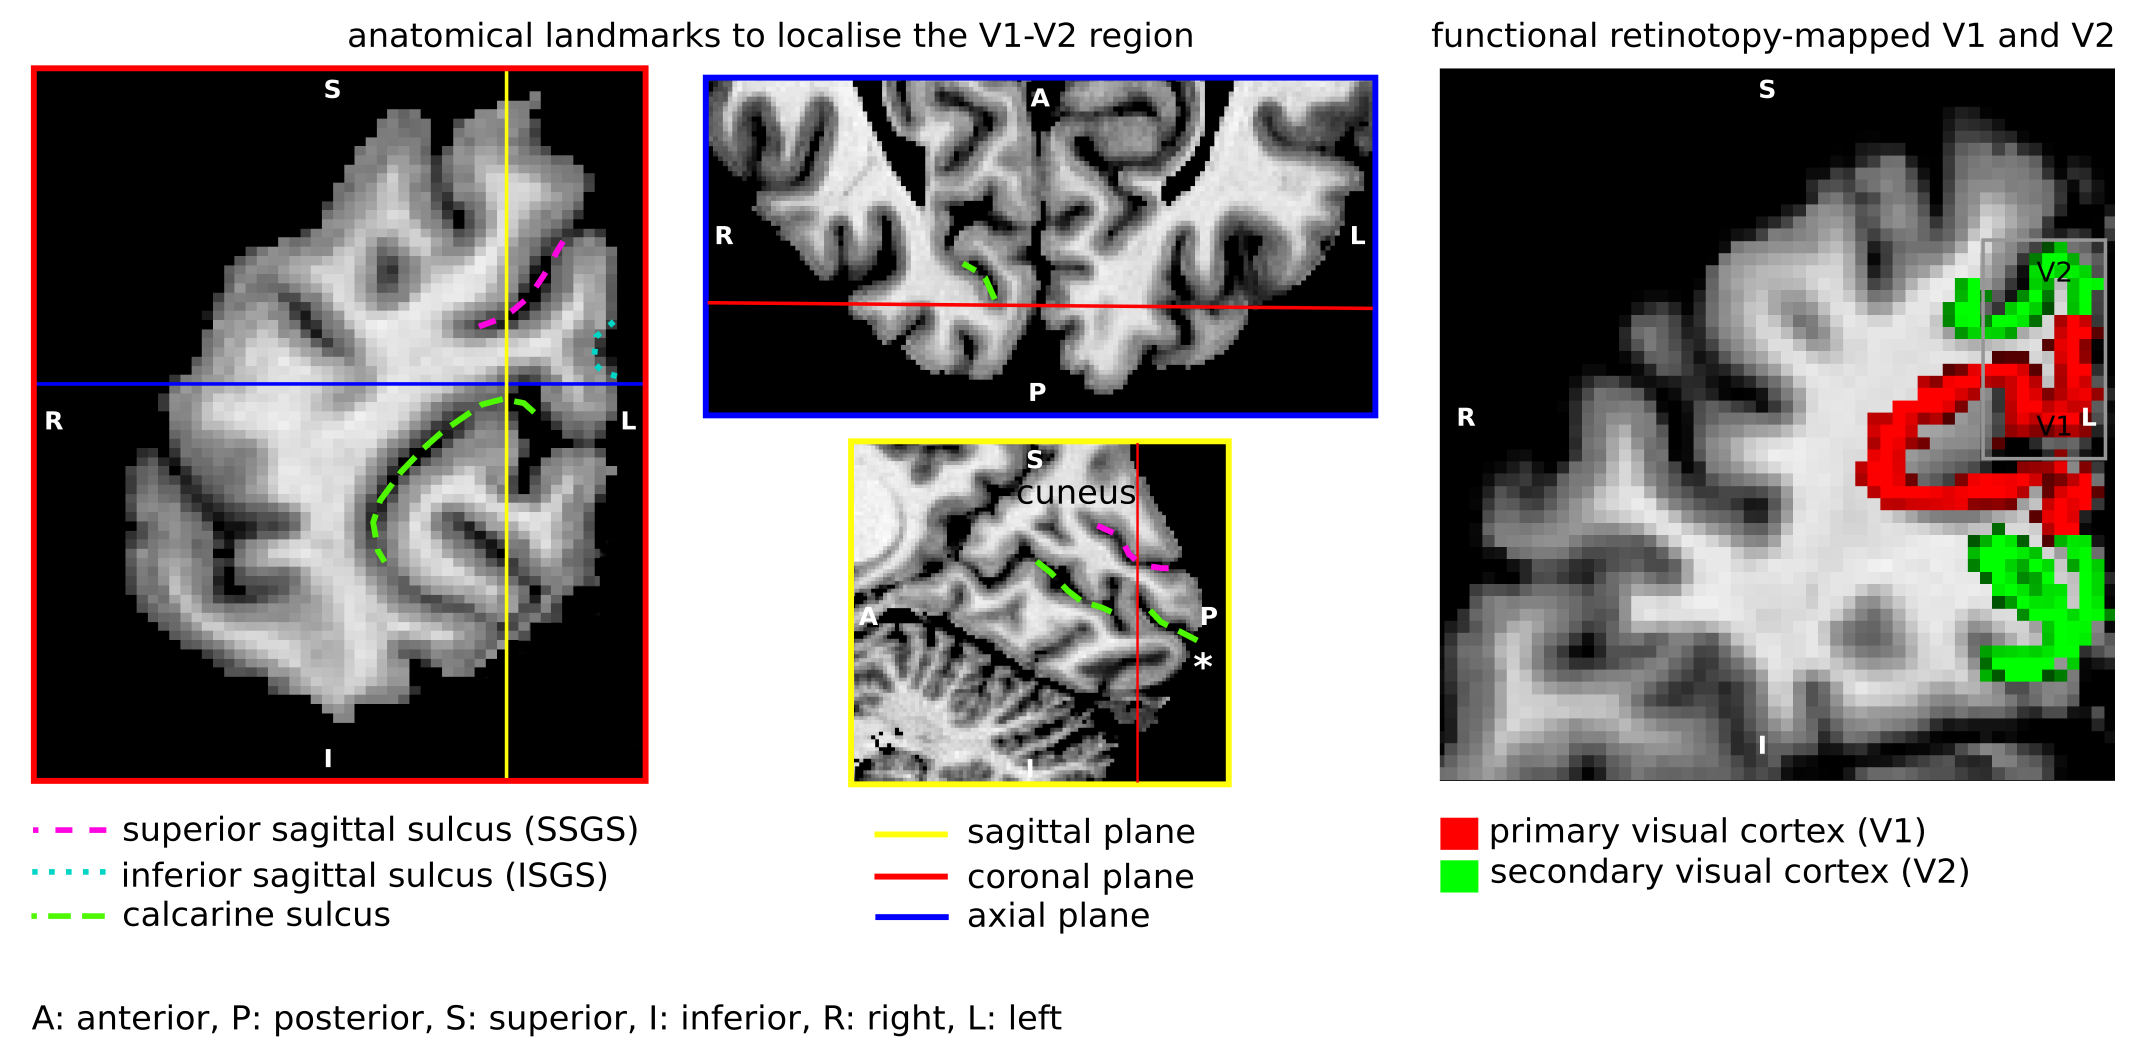
Short association fibres connecting V1 and V2 were mapped in vivo using DWI tractography at 0.8 mm isotropic resolution from our previous study on 17 participants (9 female, 8 male, 27±3y)1. Here, we focused on the Region-Of-Interest (ROI) covering V1 and V2 areas in the gyrus located between the calcarine sulcus and superior sagittal sulcus of the cuneus, corresponding to the cortical representations of the lower right visual hemifield (localized in vivo using functional retinotopic V1 and V2 maps)1,2.A formalin-fixed brain tissue block from the right hemisphere of a 60 year old male donor was studied. The tissue block contained the border between a V1 and V2 region in the gyrus located between the calcarine sulcus and superior sagittal sulcus of the cuneus, roughly corresponding to the cortical representation of the lower visual hemifield (Figure 1). Post-mortem DWI were acquired at 0.2 mm isotropic resolution with b=0,4000,8000,12000,16000 s/mm2, 60 diffusion-encoding directions per b-value and 7 repetitions using 2D segmented EPI (TE=29 ms/ TR=18 s) on a 9.4T scanner (BioSpec, Bruker, Ettlingen, Germany) equipped with a radio-frequency cryoprobe (Figure 1). All repetitions were co-registered using rigid-body registration3 based on the b=0 s/mm2 to compensate for field drift. Diffusion tensors were estimated using b=0,8000 s/mm2. Fractional anisotropy and mean diffusivity maps were computed. Constrained spherical deconvolution (CSD) was used to model crossing fibres and partial volume effects (PVE)4,5 in superficial white matter using 2-tissue compartment modelling. MRtrix6 ‘dwi2response’ function ‘manual’ algorithm was used to estimate deconvolution kernels for the white (WM) and grey matter (GM) macroscopic tissue compartments and ‘dwi2fod’ function ‘msmt_csd’ algorithm was used to compute the fibre orientation distribution functions (ODF) based on b=4000,8000,12000,16000 s/mm2. Voxels used to estimate the deconvolution kernels were manually selected based on an unsupervised run of the algorithm7. Probabilistic tractography8 was performed with curvature and ODF thresholds 45° and 0.1, step size 0.1 mm and length threshold 6-25 mm with 2x2x2 tracking seed resolution.
Results
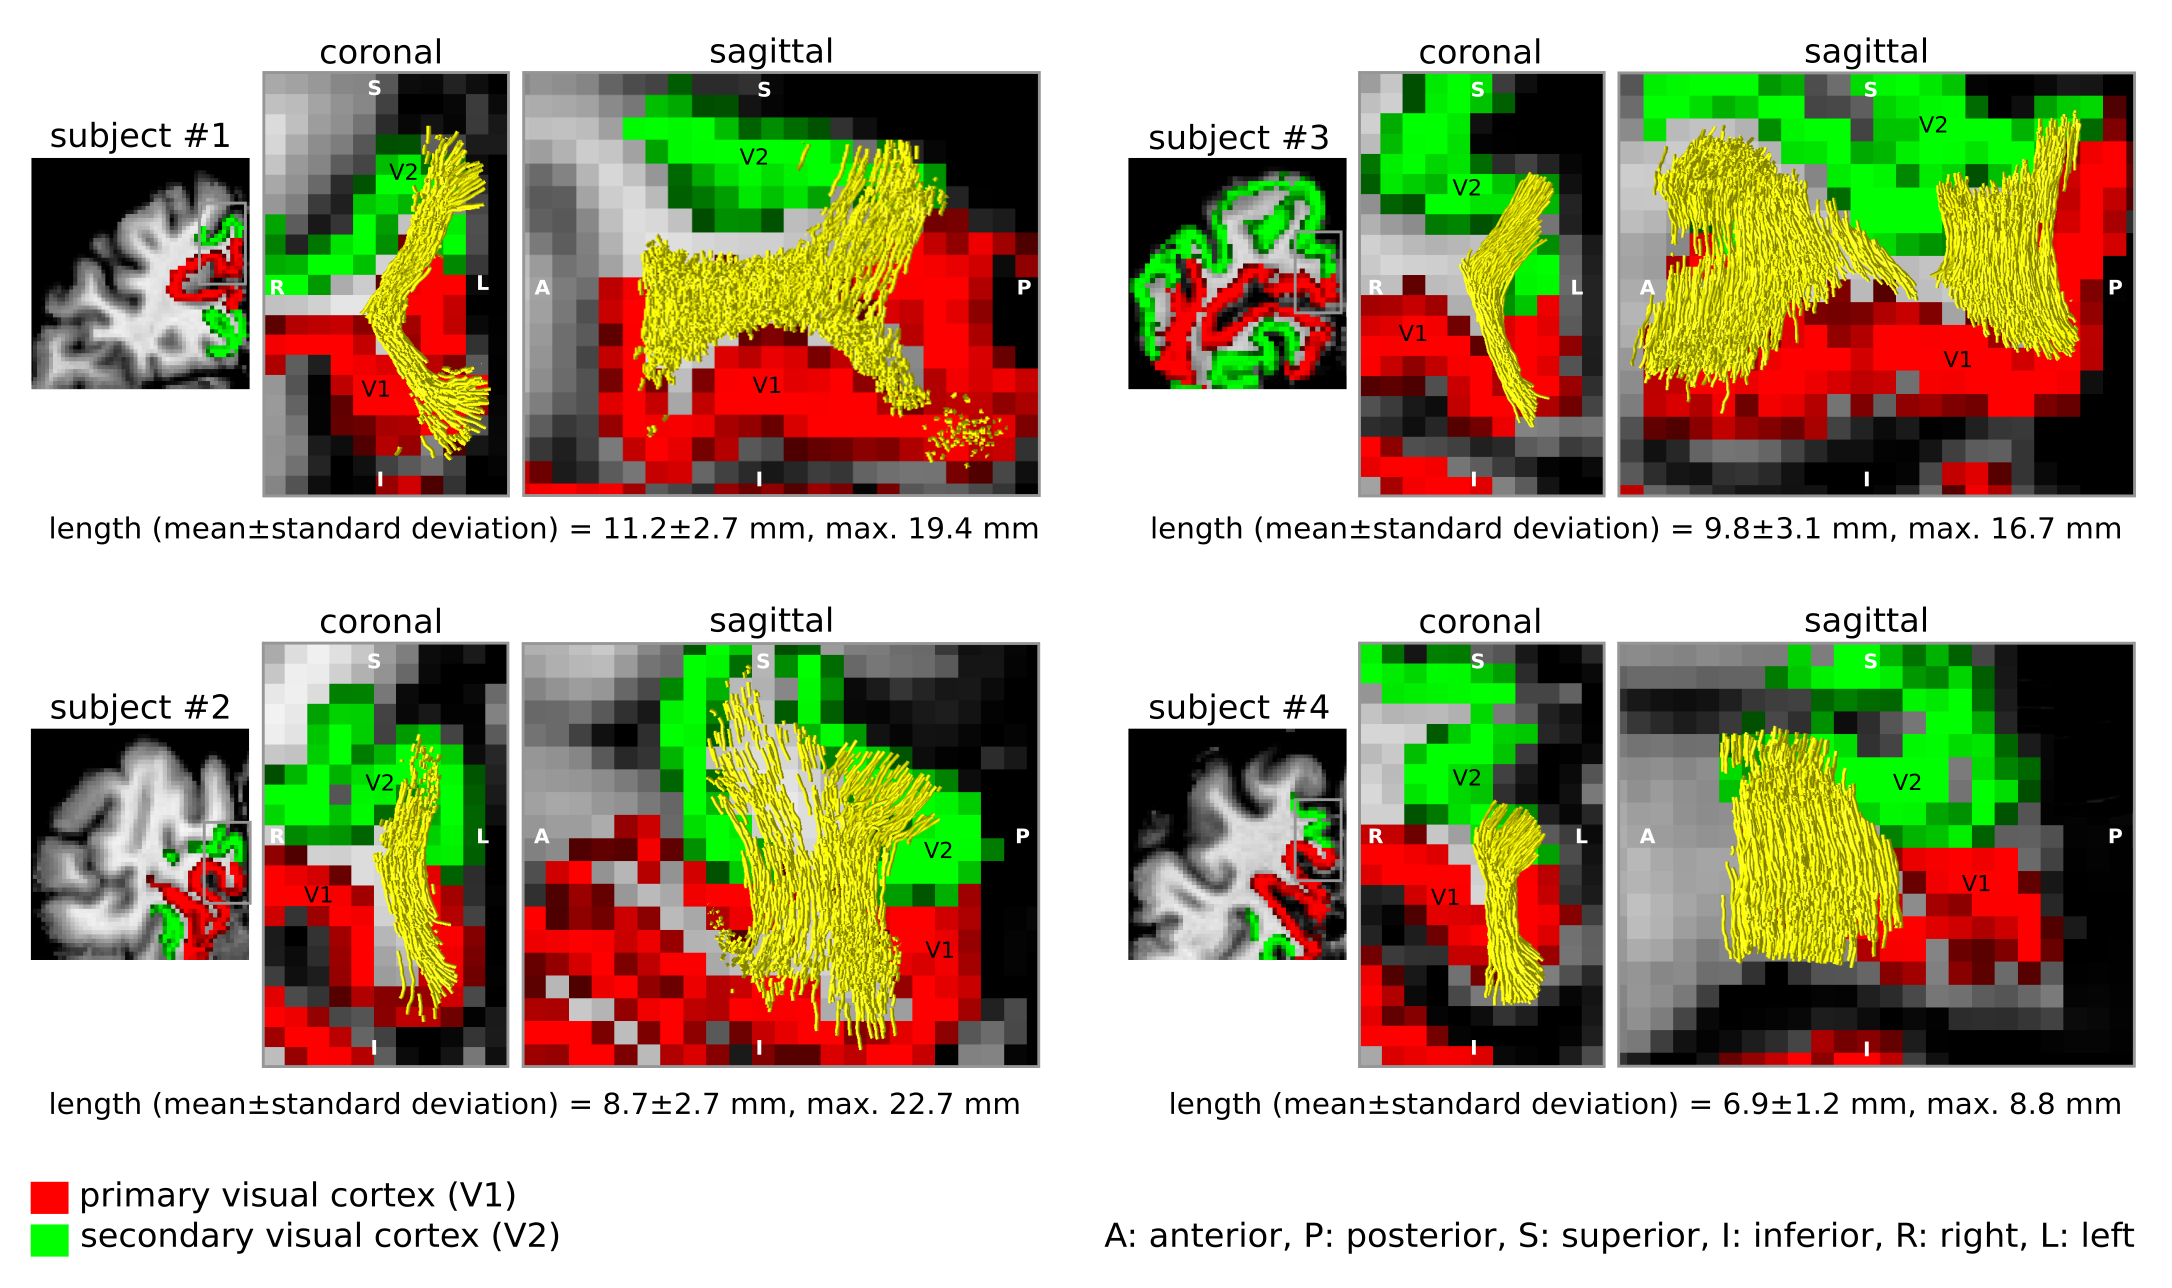
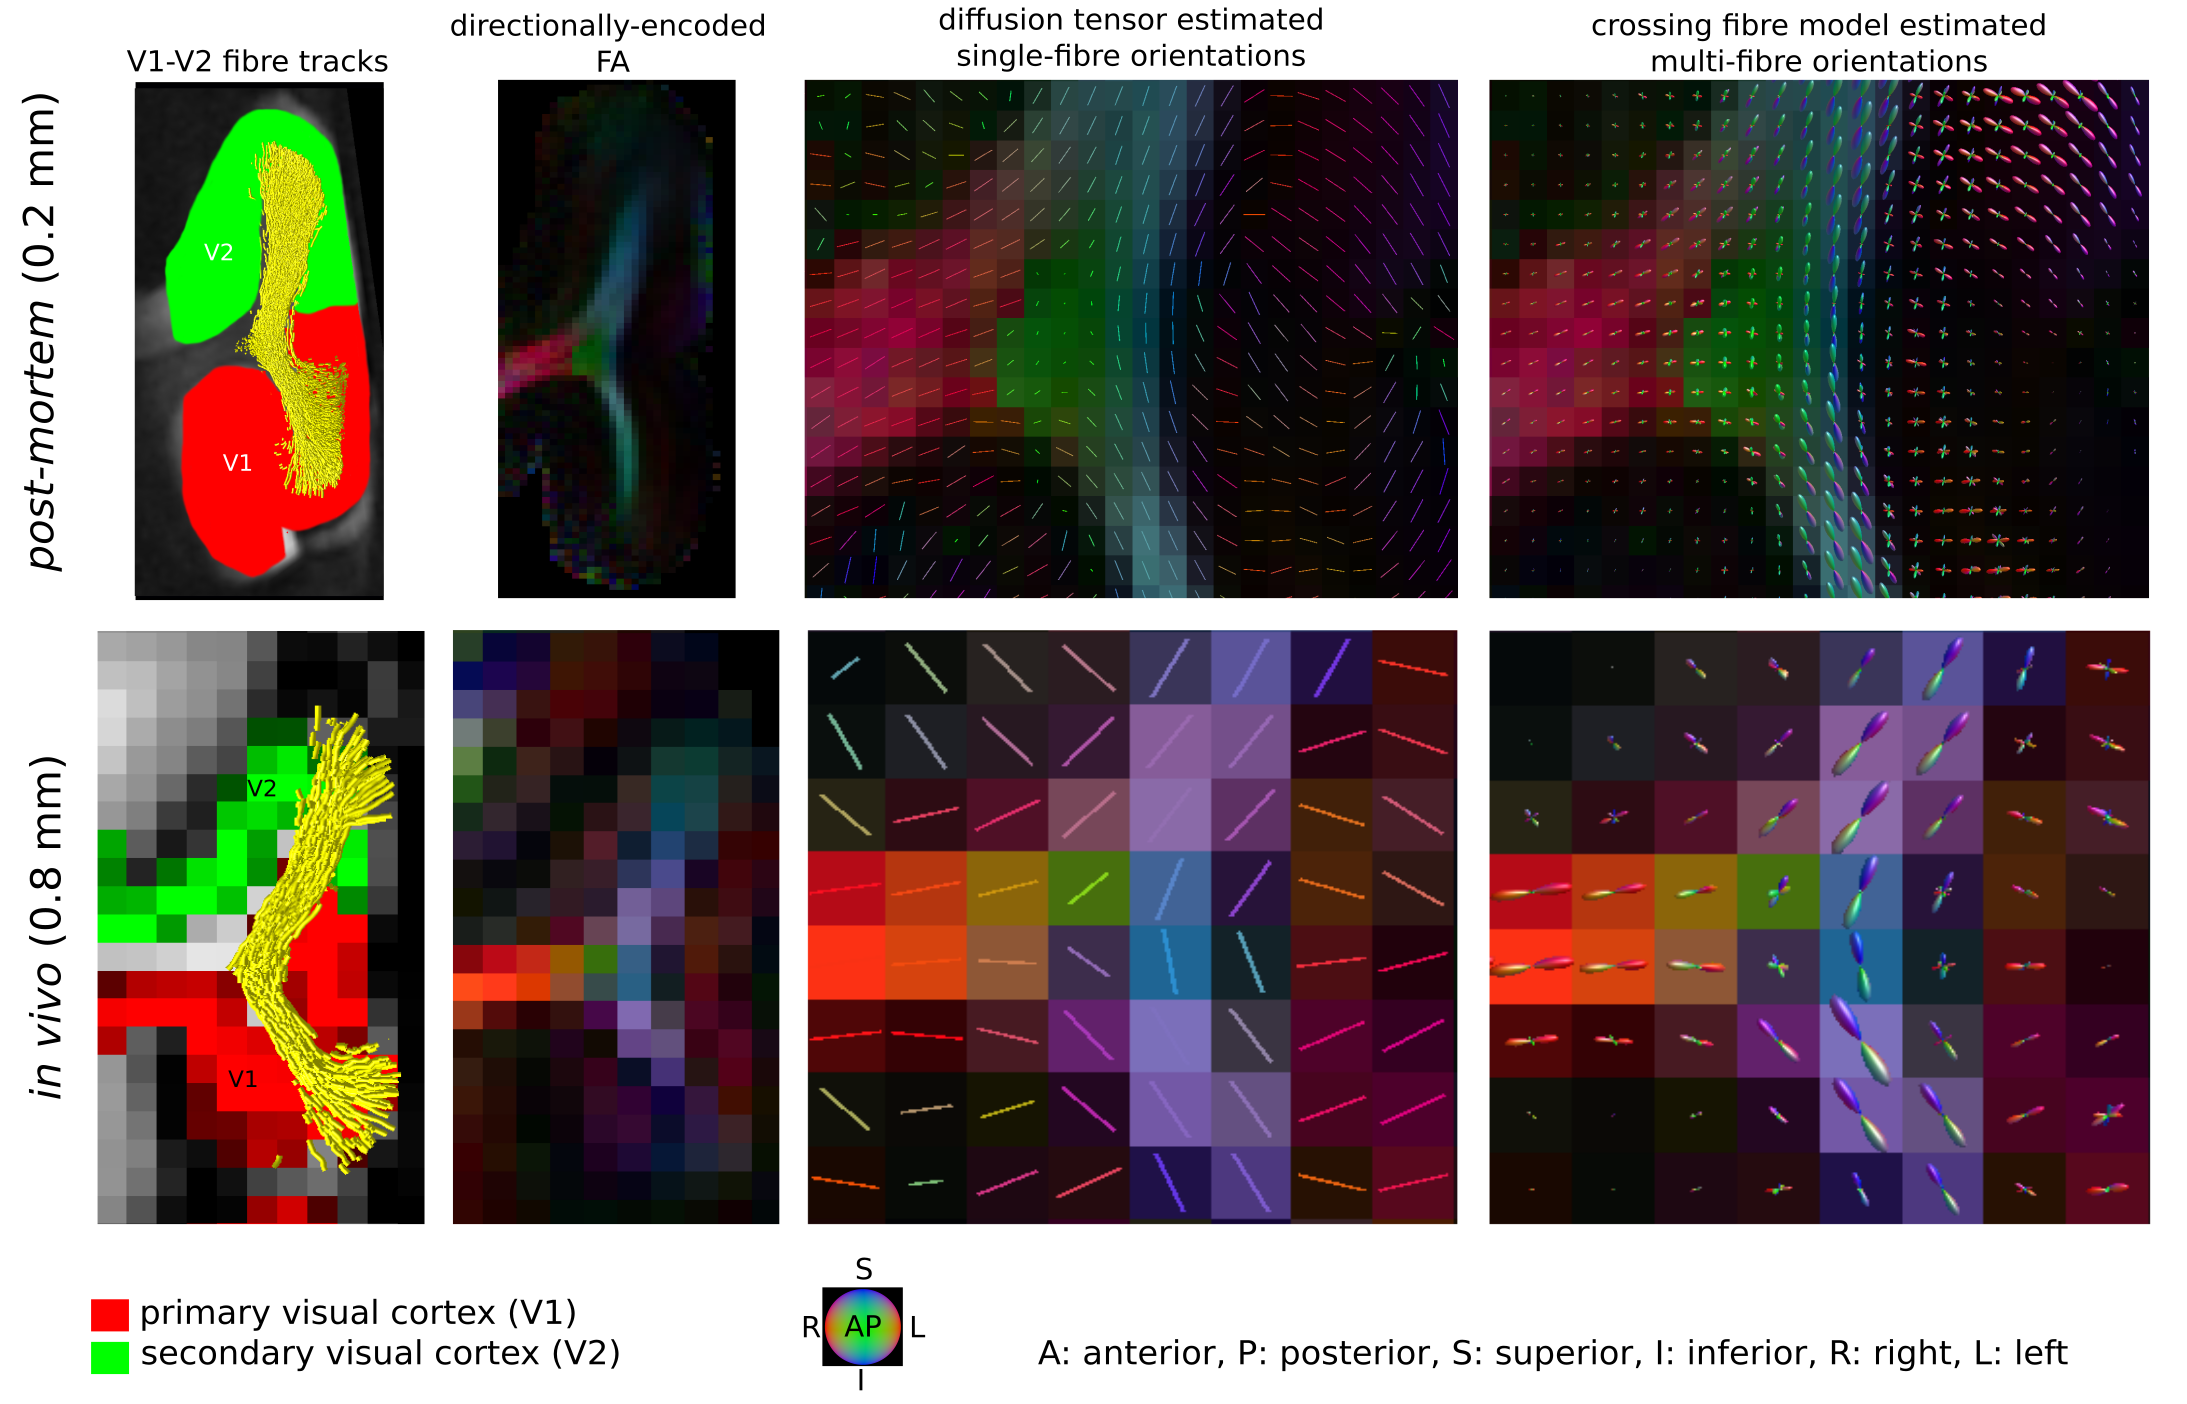
We identified the ROI encompassing the V1–V2 gyrus in the right hemispheres of 14 out of the 17 participants based on anatomical landmarks and retinotopy (results shown for 4 representative participants in Figure 3). U-fibre geometries were largely determined by the shape of this gyrus and thus varied across individuals. The mapped U-fibres ran in sheet-like structures (i.e. parallel-running streamlines) in agreement with 9 and in line with the retinotopic organisation principle10,11 for all participants. Where the geometries of the post-mortem and corresponding in vivo V1–V2 gyrus bore close resemblance, so did the geometry of the mapped U-fibres, thus supporting the quality of our in vivo pipeline (Figures 1,3). At 0.2 mm resolution, PVE in superficial white matter was significantly reduced as reflected in single-fibre representations of both DTI and CSD models across at least 2 voxels (i.e. ~0.4 mm) below the GM–WM boundary (Figure 4). The superficial white matter layer was detectable in vivo on DTI and CSD maps but with a more pronounced PVE (Figure 4). However, despite the PVE, U-fibres were reliably tracked in vivo.Discussion
High fidelity 0.2 mm resolution post-mortem DWI tractography was used to validate in vivo U-fibre geometry mapping. Our results support the plausibility of our in vivo mapping approach with 0.8 mm resolution, particularly suggesting that U-fibres were accurately mapped in corresponding V1–V2 cortical areas post-mortem and in vivo (especially where V1–V2 geometric resemblance was high). Our results suggest that the sheet-like structure of U-fibres in superficial white matter is correctly captured at lower in vivo resolutions feasible for in vivo acquisitions.The investigation is limited by studying a single gyrus with a specific geometry but points to the efficiency of high-resolution DWI to capture the short association fibres. Further validation of the in vivo pipeline could examine U-fibre geometries using post-mortem DWI in other cortical areas – connected via short association fibres – that are smaller and/or feature high gyrification curvatures, thus more challenging to map in vivo.
Conclusion
The geometries of the U-fibres mapped in vivo at 0.8 mm resolution corresponded well with results obtained post-mortem at 0.2 mm resolution using streamline tractography in a selected region of the human early visual cortex. Our findings support the feasibility of our sub-millimetre resolution DWI tractography pipeline to reliably map geometric features of the U-fibres.Acknowledgements
The research leading to these results has received funding from the European Research Council under the European Union’s Seventh Framework Programme (FP7/2007-2013)/ERC grant agreement n◦ 616905. NW and SM received funding from the BMBF (01EW1711A & B) in the framework of ERA-NET NEURON, and NW received funding from the NISCI project funded by the European Union’s Horizon 2020 research and innovation programme under the grant agreement No 681094, and the Swiss State Secretariat for Education, Research and Innovation (SERI) under contract number 15.0137. EK, NW, SM and MM received funding from German Research Foundation priority program SPP2041 'Computational Connectomics’ (KI13372-2, WE 5046/4-2, MO 2397/5-2, MO 2249/3). SM received funding from the DFG Emmy Noether program MO 2397/4-1.
The Max Planck Institute for Human Cognitive and Brain Sciences has an institutional research agreement with Siemens Healthcare. NW holds a patent on acquisition of MRI data during spoiler gradients (US 10,401,453 B2). NW was a speaker at an event organized by Siemens Healthcare and was reimbursed for the travel expenses.
We acknowledge the former Brain Banking Centre Leipzig of the German Brain-Net, operated by the Paul Flechsig Institute of Neuropathology and Brain Research, Medical Faculty, and Leipzig University for providing the post-mortem brain sample. The entire procedure of case recruitment, acquisition of the patient's personal data, the protocols and the informed consent forms, performing the autopsy, and handling the autopsy material have been approved by the responsible authorities (Approval # WF-74/16, Approval # 282-02 and Approval # 205/17-ek).
References
1. Movahedian Attar F, Kirilina E, Haenelt D, Pine K, Trampel R, Edwards LJ, Weiskopf N. Mapping short association fibers in the early cortical visual processing stream using in vivo diffusion tractography. Cerebral Cortex. 2020;30(8):4496 - 4514.
2. Sereno MI, Dale A, Reppas JB, Kwong KK, Belliveau JW, Brady TJ, Rosen BR, Tootell RBH. Borders of multiple visual areas in humans revealed by functional magnetic resonance imaging. Science. 1995;268:889–893.
3. Tustison NJ, Avants BB, Cook PA, Zheng Y, Egan A, Yushkevich PA, Gee JC. N4ITK: improved N3 bias correction. IEEE Trans Med Imaging. 2010;29:1310–1320.
4. Tournier J-D, Calamante F, Gadian DG, Connelly A. Direct estimation of the fiber orientation density function from diffusion-weighted MRI data using spherical deconvolution. NeuroImage. 2004;23:1176–1185.
5. Jeurissen B, Tournier JD, Dhollander T, Connelly A, Sijbers J. Multi-tissue constrained spherical deconvolution for improved analysis of multi-shell diffusion MRI data. NeuroImage. 2014;103:411–426.
6. Tournier JD, Smith RE, Raffelt D, Tabbara R, Dhollander T, Pietsch M, Christiaens D, Jeurissen B, Yeh CH, and Connelly A. MRtrix3: A fast, flexible and open software framework for medical image processing and visualisation. NeuroImage, 2019;202:116–37.
7. Dhollander T, Raffelt D, Connelly A. Unsupervised 3-tissue response function estimation from single-shell or multi-shell diffusion MR data without a co-registered T1 image. In:Proc Intl Soc Mag Reson Med (ISMRM) workshop on breaking the barriers of diffusion MRI, p. 5. 2016.
8. Tournier JD, Calamante F, Connelly A. Improved probabilistic streamlines tractography by 2nd order integration over fibre orientation distributions. Proc Intl Soc Mag Reson Med (ISMRM). 2010;18:1670.
9. Reveley C, Seth AK, Pierpaoli C, Silva AC, Yu D, Saunders RC, Leopold DA, Ye FQ. Superficial white matter fiber systems impede detection of long-range cortical connections in diffusion MR tractography. Proc Natl Acad Sci USA. 2015;112:E2820–E2828.
10. Holmes G. The organization of the visual cortex in man. Proc R Soc Lond B Biol Sci. 1945;132:348–361.
11. Van Essen DC, Anderson CH, Felleman DJ. Information processing in the primate visual system: an integrated systems perspective. Science. 1992;2555043:419–423.
Figures