2070
Using MRI-based fat fraction histograms in dystrophic muscle to assess individual patient disease evolution1NMR Laboratory, Neuromuscular Investigation Center, Institute of Myology, Paris, France, 2NMR Laboratory, CEA/DRF/IBFJ/MIRCen, Paris, France, 3Cincinnati Children’s Hospital Medical Center, Cincinnati, OH, United States, 4UMass Memorial Medical Center, Worcester, MA, United States, 5University Paris-Saclay, CEA, EA, DRF, Service Hospitalier Frédéric Joliot, Orsay, France
Synopsis
In most clinical quantitative MRI studies, using fat-water imaging, a mean fat fraction value per region of interest is generally used. The aim of this study was to look into the longitudinal changes in FF distribution on an individual patient basis, in dystrophic muscle, and at the same time, investigate whether differences were observed between treated and non-treated patients. As shown here, even if the mean fat fraction is the same between two patients or across time, there might be significant differences in the respective FF distributions, and might reveal, in retrospect, differential clinical or functional changes.
Introduction
Quantitative assessment of muscle fat replacement based on fat-water MRI is used in many muscle disorders to evaluate individual disease progression1,2. In most studies, a mean fat fraction (FFM) value per region of interest (ROI), which can be an individual muscle, a muscle group or even the whole muscle segment2, is reported. Although FFM per ROI is a valuable objective MRI outcome measure, it does not reflect the variation of FF within this ROI. In an earlier work, we looked into the differences in FF distribution, on a cross-sectional basis, between six neuromuscular disorders3. This particular study revealed interesting differences in the FF histograms of similarly fatty replaced muscle between dystrophic and other muscle diseases such as inflammatory myopathies. The objective, here, was to look into the longitudinal changes in FF distribution on an individual patient basis, in dystrophic muscle, and at the same time, investigate whether differences were observed between treated and non-treated patients.Methods
Database | For this study, we investigated quantitative MRI data, obtained in thighs and legs of 24 Duchenne muscular dystrophy patients (16 non-treated subjects, 8 subjects treated with exon-skipping therapy). Patient age was 11.0±2.5 and 10.7±2.5 years in the non-treated (NT) and treated group (T), respectively. All patients were on corticosteroids. Patients were scanned at baseline (BL) and at 6 (6M), 12 (12M) and 18 months (18M).Data acquisition | All data were obtained on a 1.5T clinical Philips Ingenia system (Cincinnati CCHMC, Ohio, USA). The quantitative MRI protocol included a 3D gradient echo sequence (Dixon) with TEs of 2.4 and 4.7 ms, a TR of 11.3 ms, a flip angle of 3°, a spatial resolution of 1x1x10 mm3, across 35 slices4, as well as a 2D multi spin echo sequence (MSE) for T2 mapping, with 17 evenly-spaced TEs, a TR of 3000 ms, a spatial resolution of 1.4x1.4 mm2, across 5 slices of 10 mm.
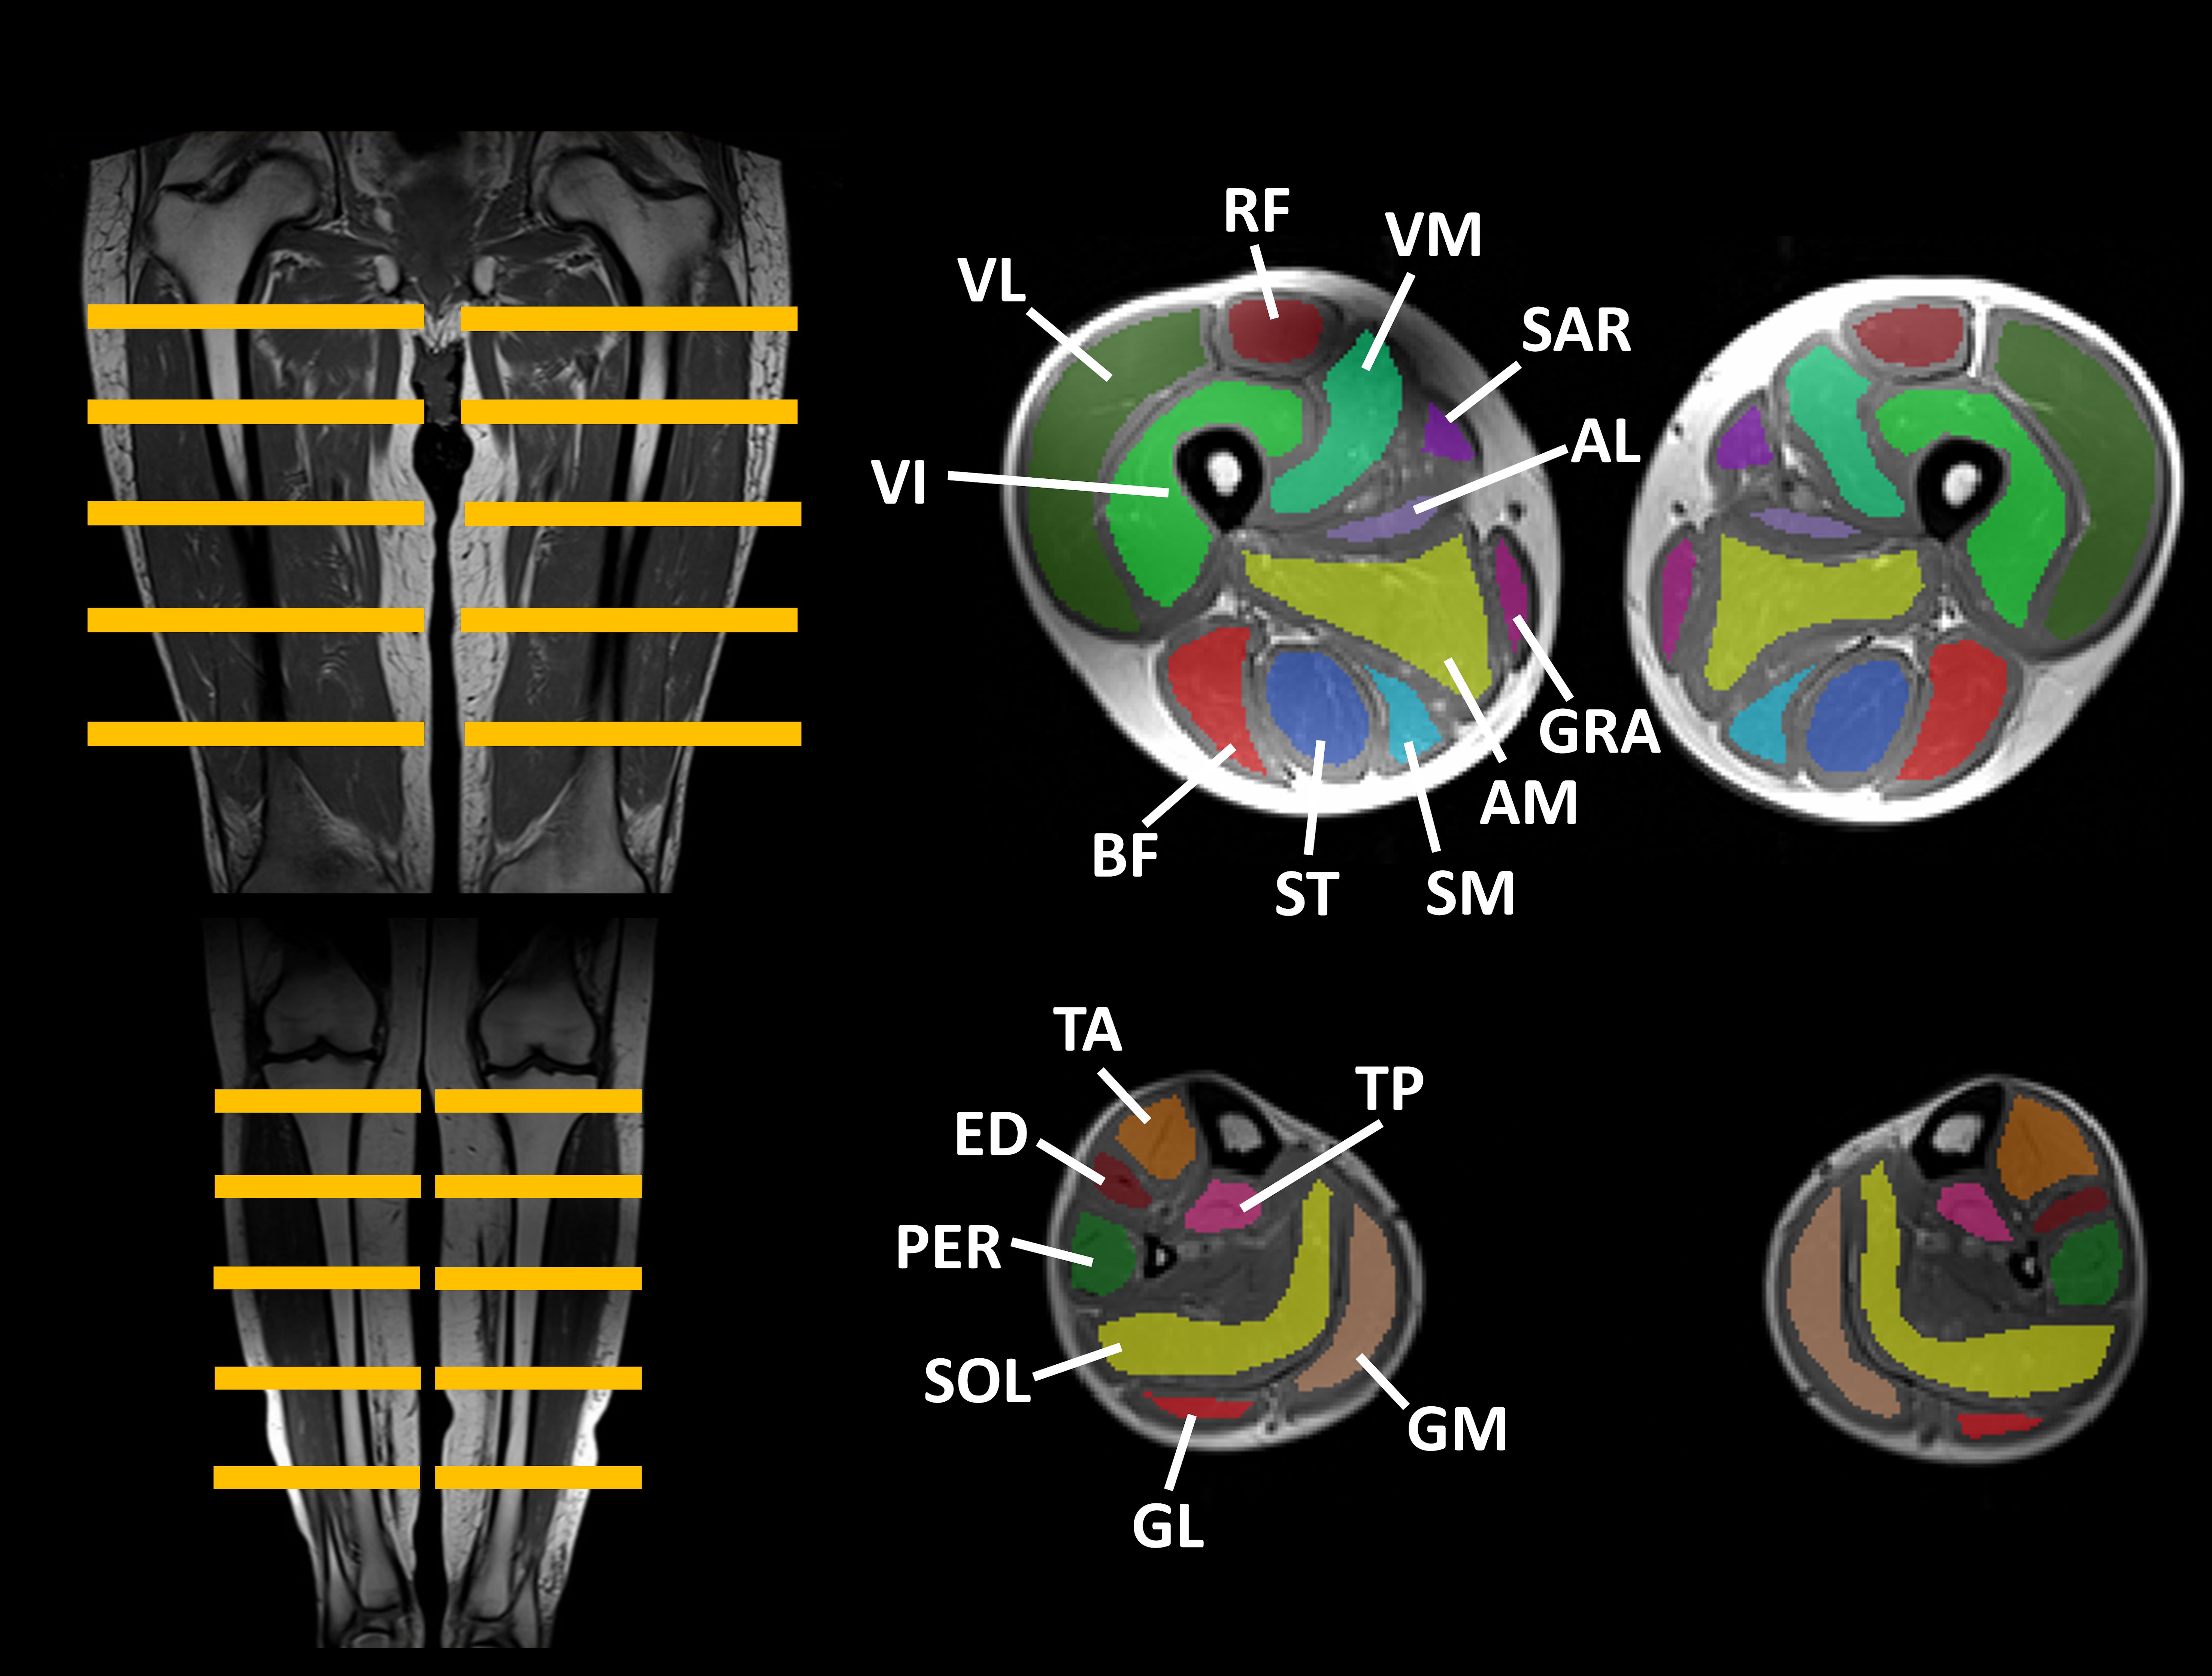
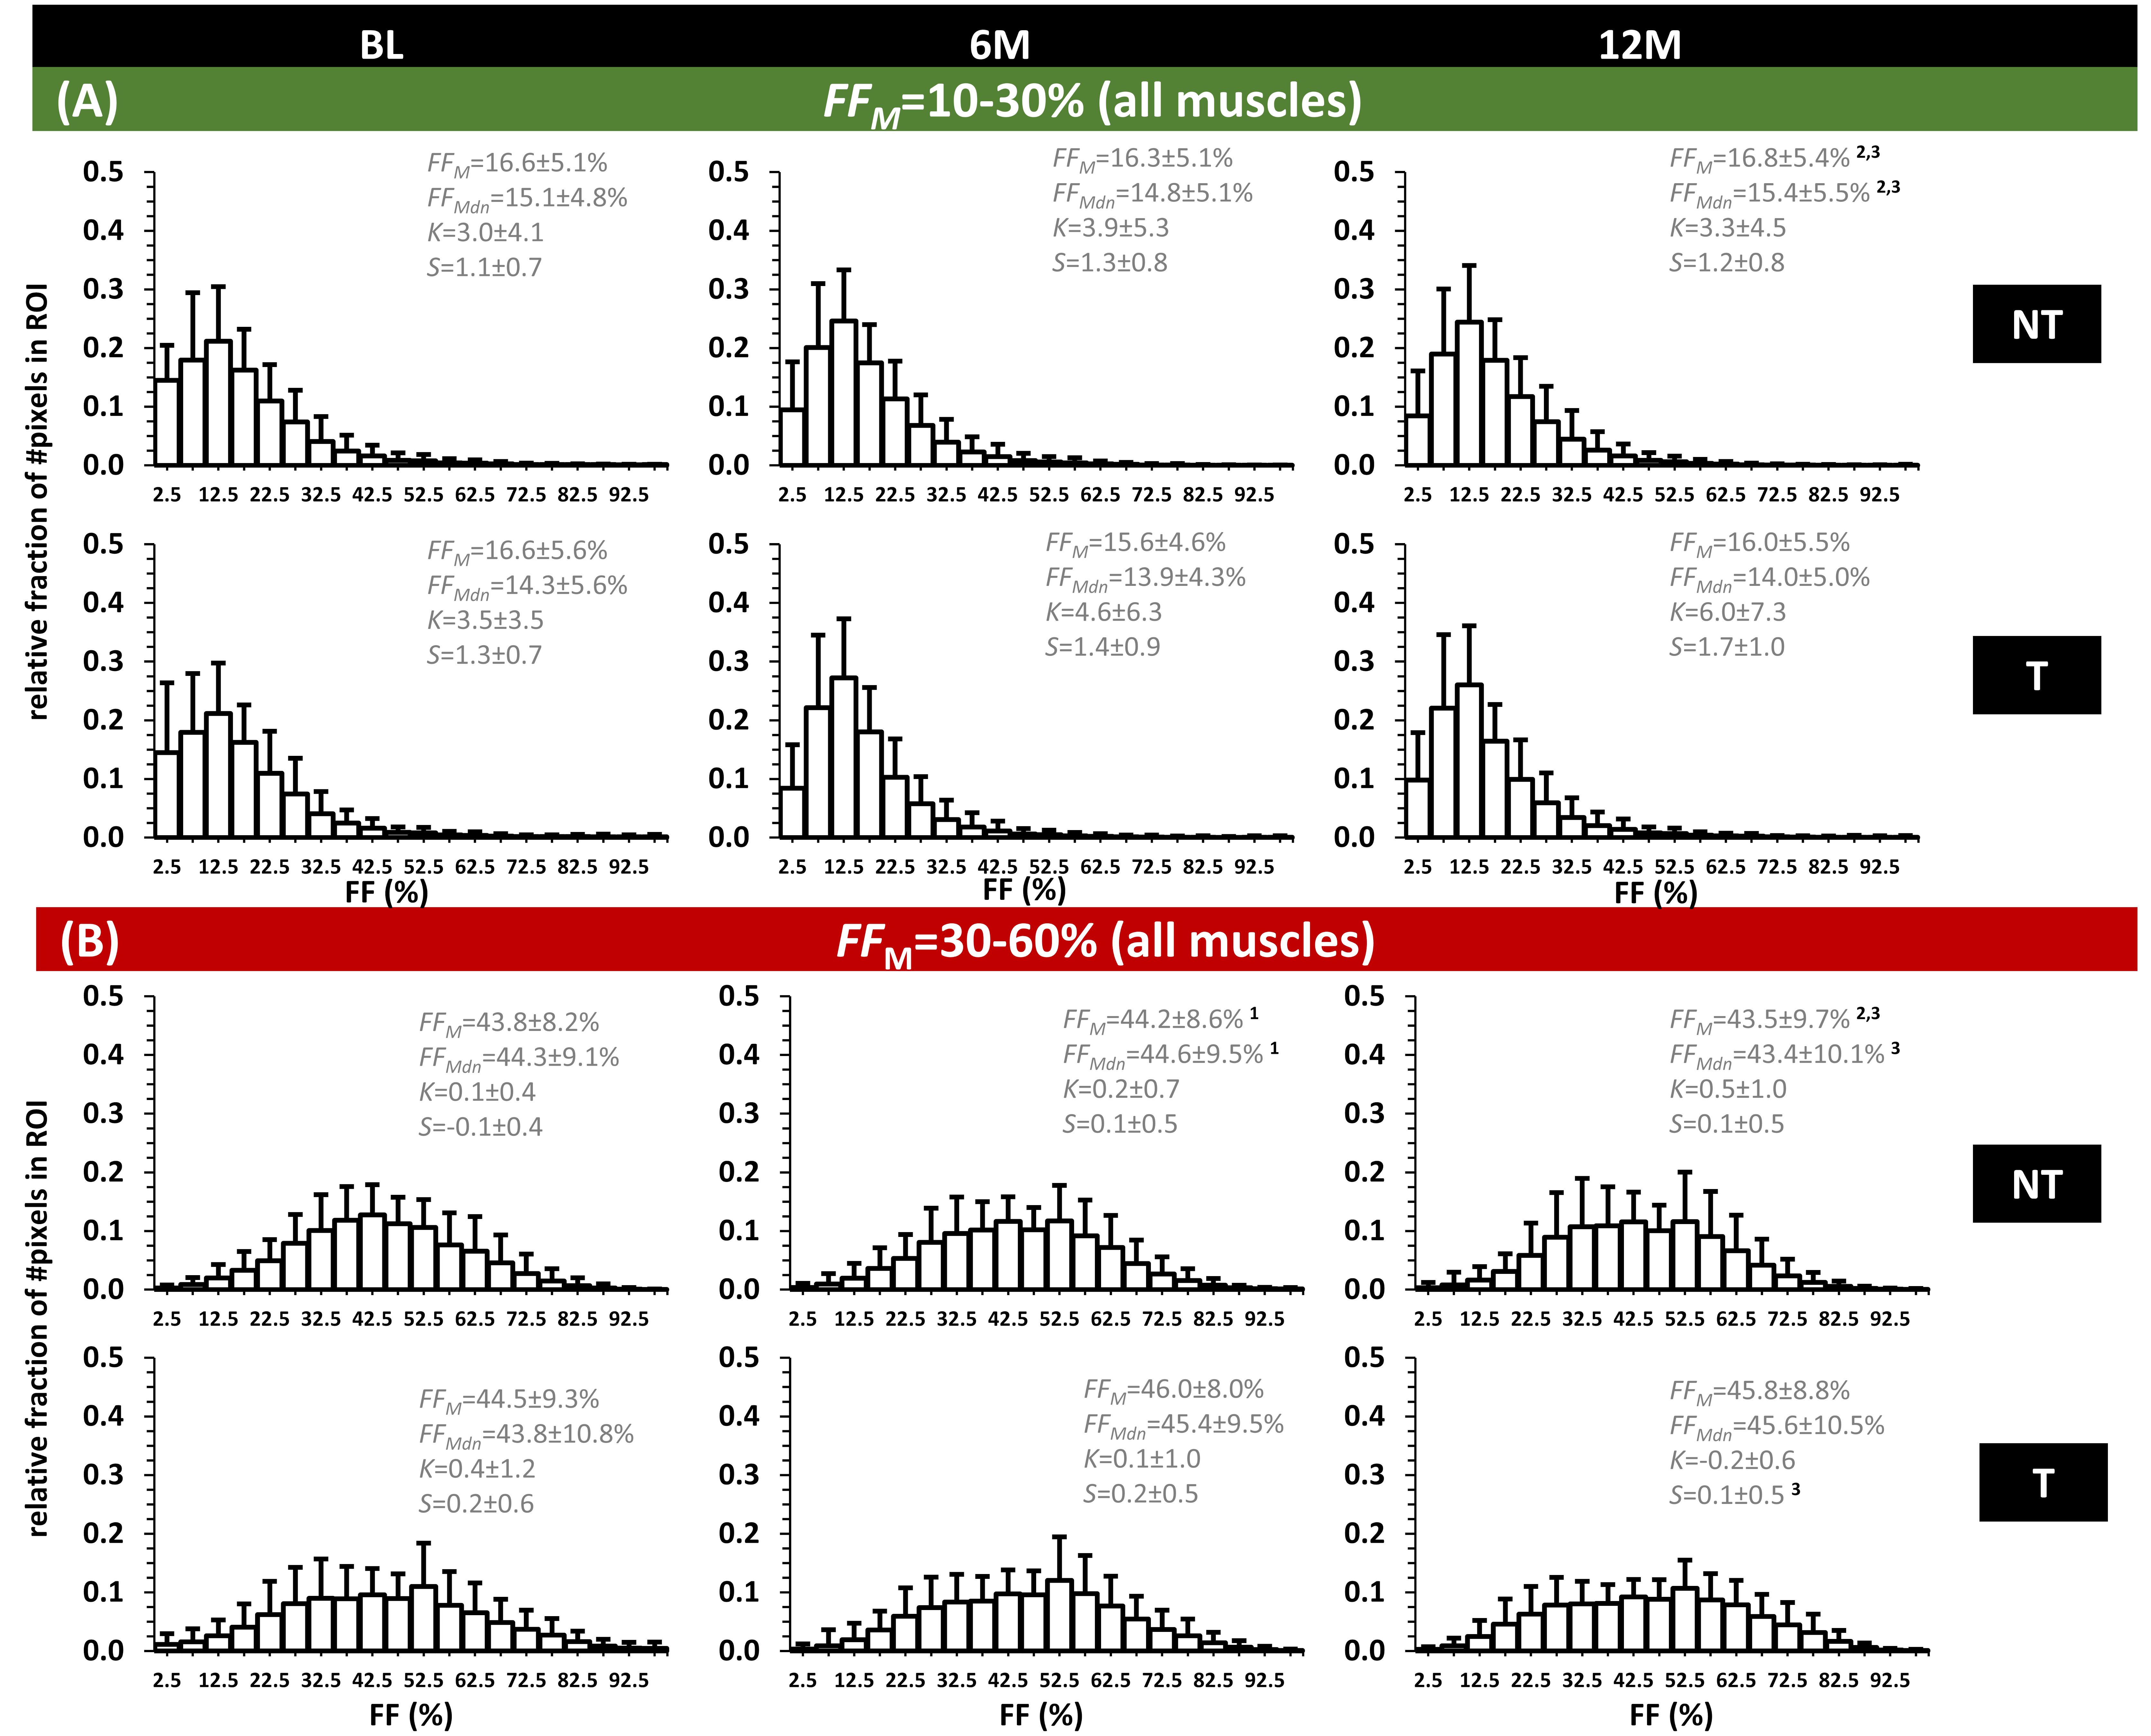
Data processing/analysis | Manual segmentation was performed in 22 thigh and 14 leg muscles and (Fig. 1), on 5 slices, avoiding the muscle borders (fasciae, intermuscular and subcutaneous fat).The central slice was always positioned at the same anatomical level. Histograms were generated for all ROIs. From the generated FF maps5, the analysis per ROI included the assessment of mean (FFM), median (FFMdn), kurtosis (K=3=normal distribution; K<3: flatter than normal distribution; K>3: more peaked than normal distribution) and skewness (-0.5<S>0.5: normal distribution; S<-0.5: negative skew, M<Mdn; S>0.5: positive skew, M>Mdn) of the FF distribution. We also categorized ROIs into 4 FFM categories: FFM ≤10%, 10%<FFM≤30%, 30%<FFM≤60% and FFM>60%.6 Water T2 maps were generated using a 3-exponential fitting method5. Mann-Whitney and Wilcoxon tests were used to compare BL FF metrics between groups (NT vs T) and over time (BL vs. 6M vs. 12M), respectively. Data from 18M was not included for statistical analysis due to lack of data. Statistical significance was set at P=0.002 (including Bonferroni corrections for multiple comparisons).
Results
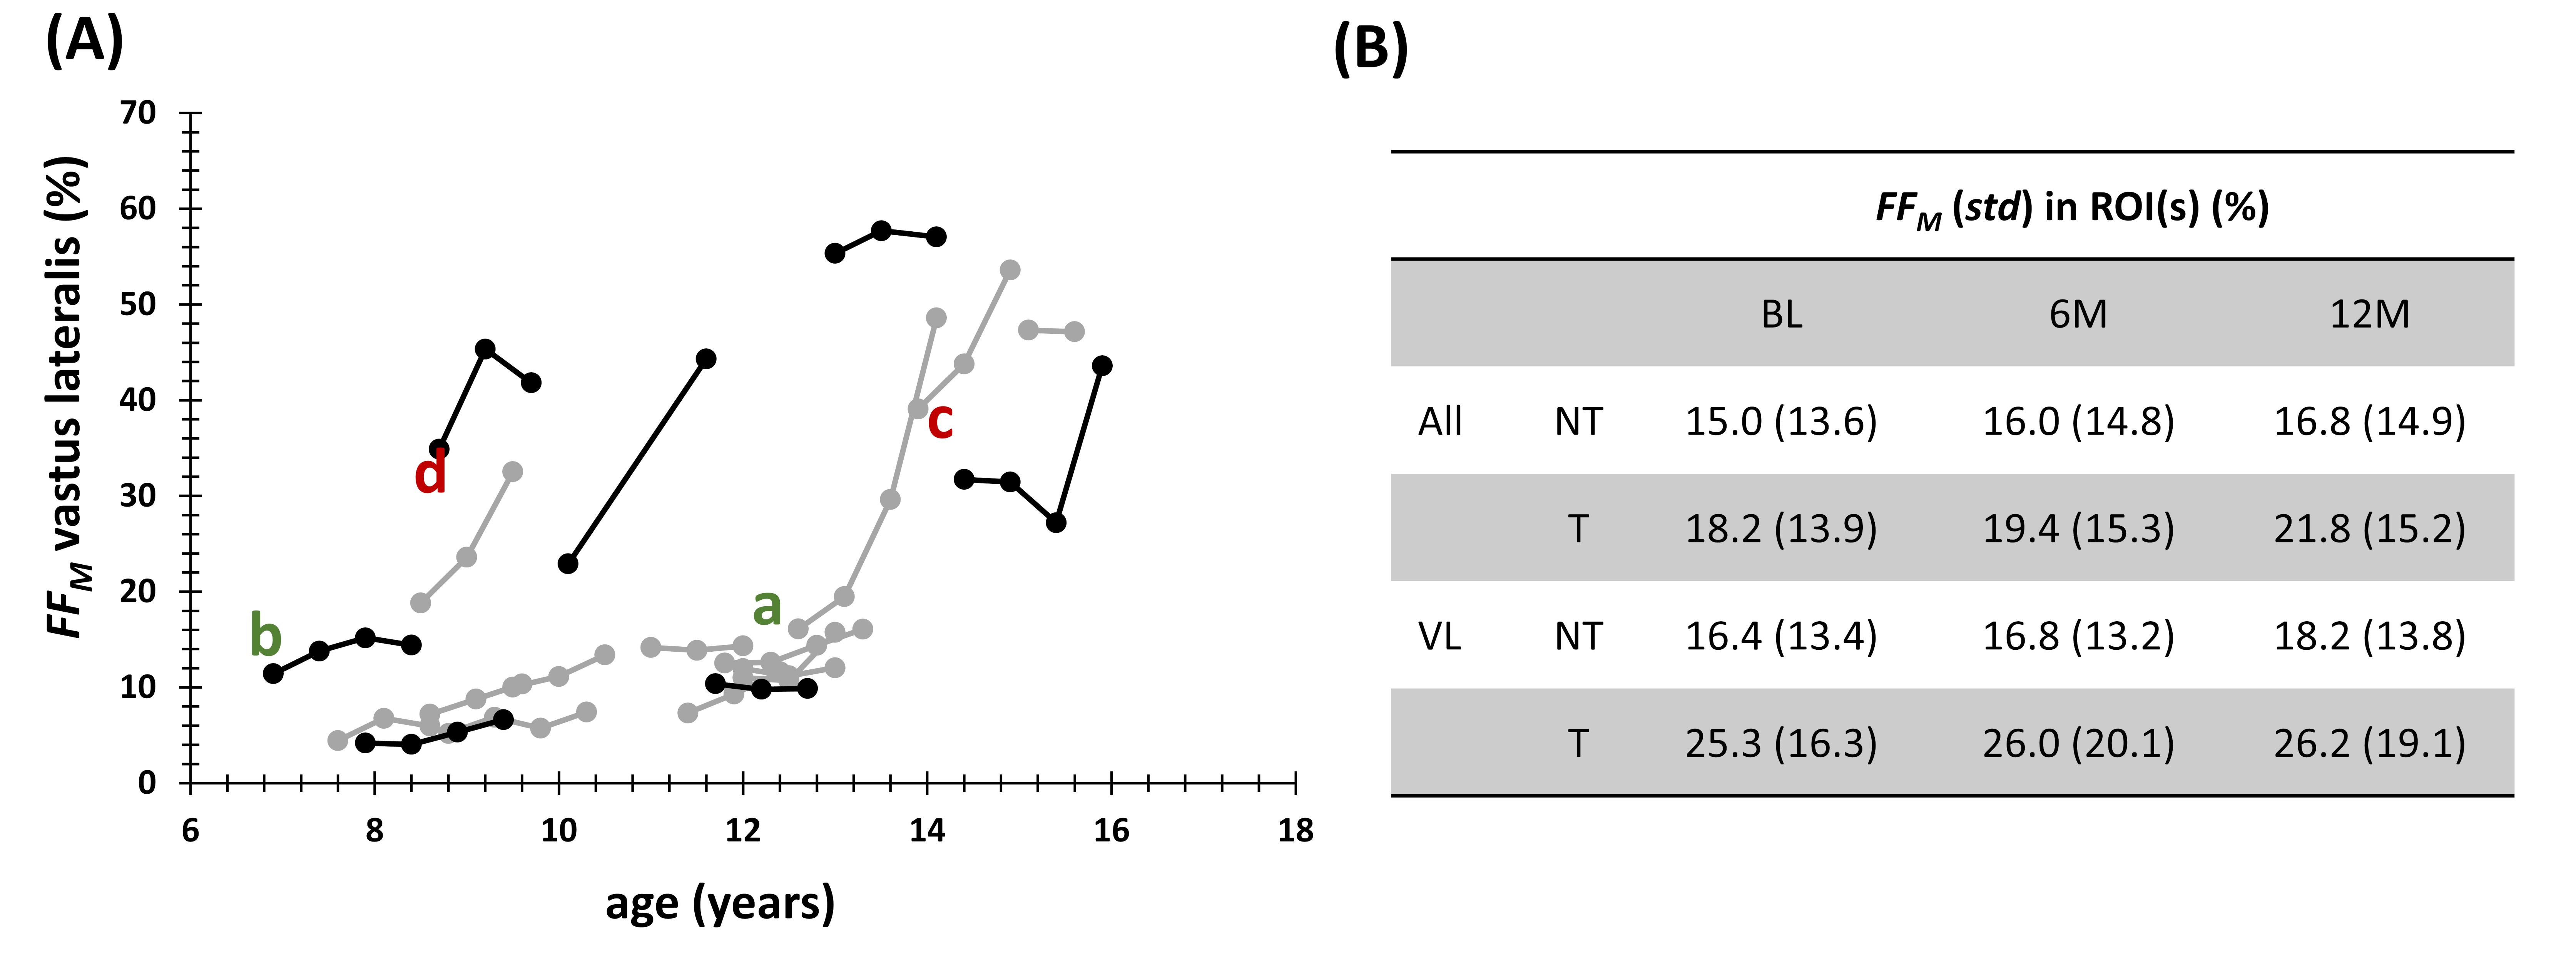
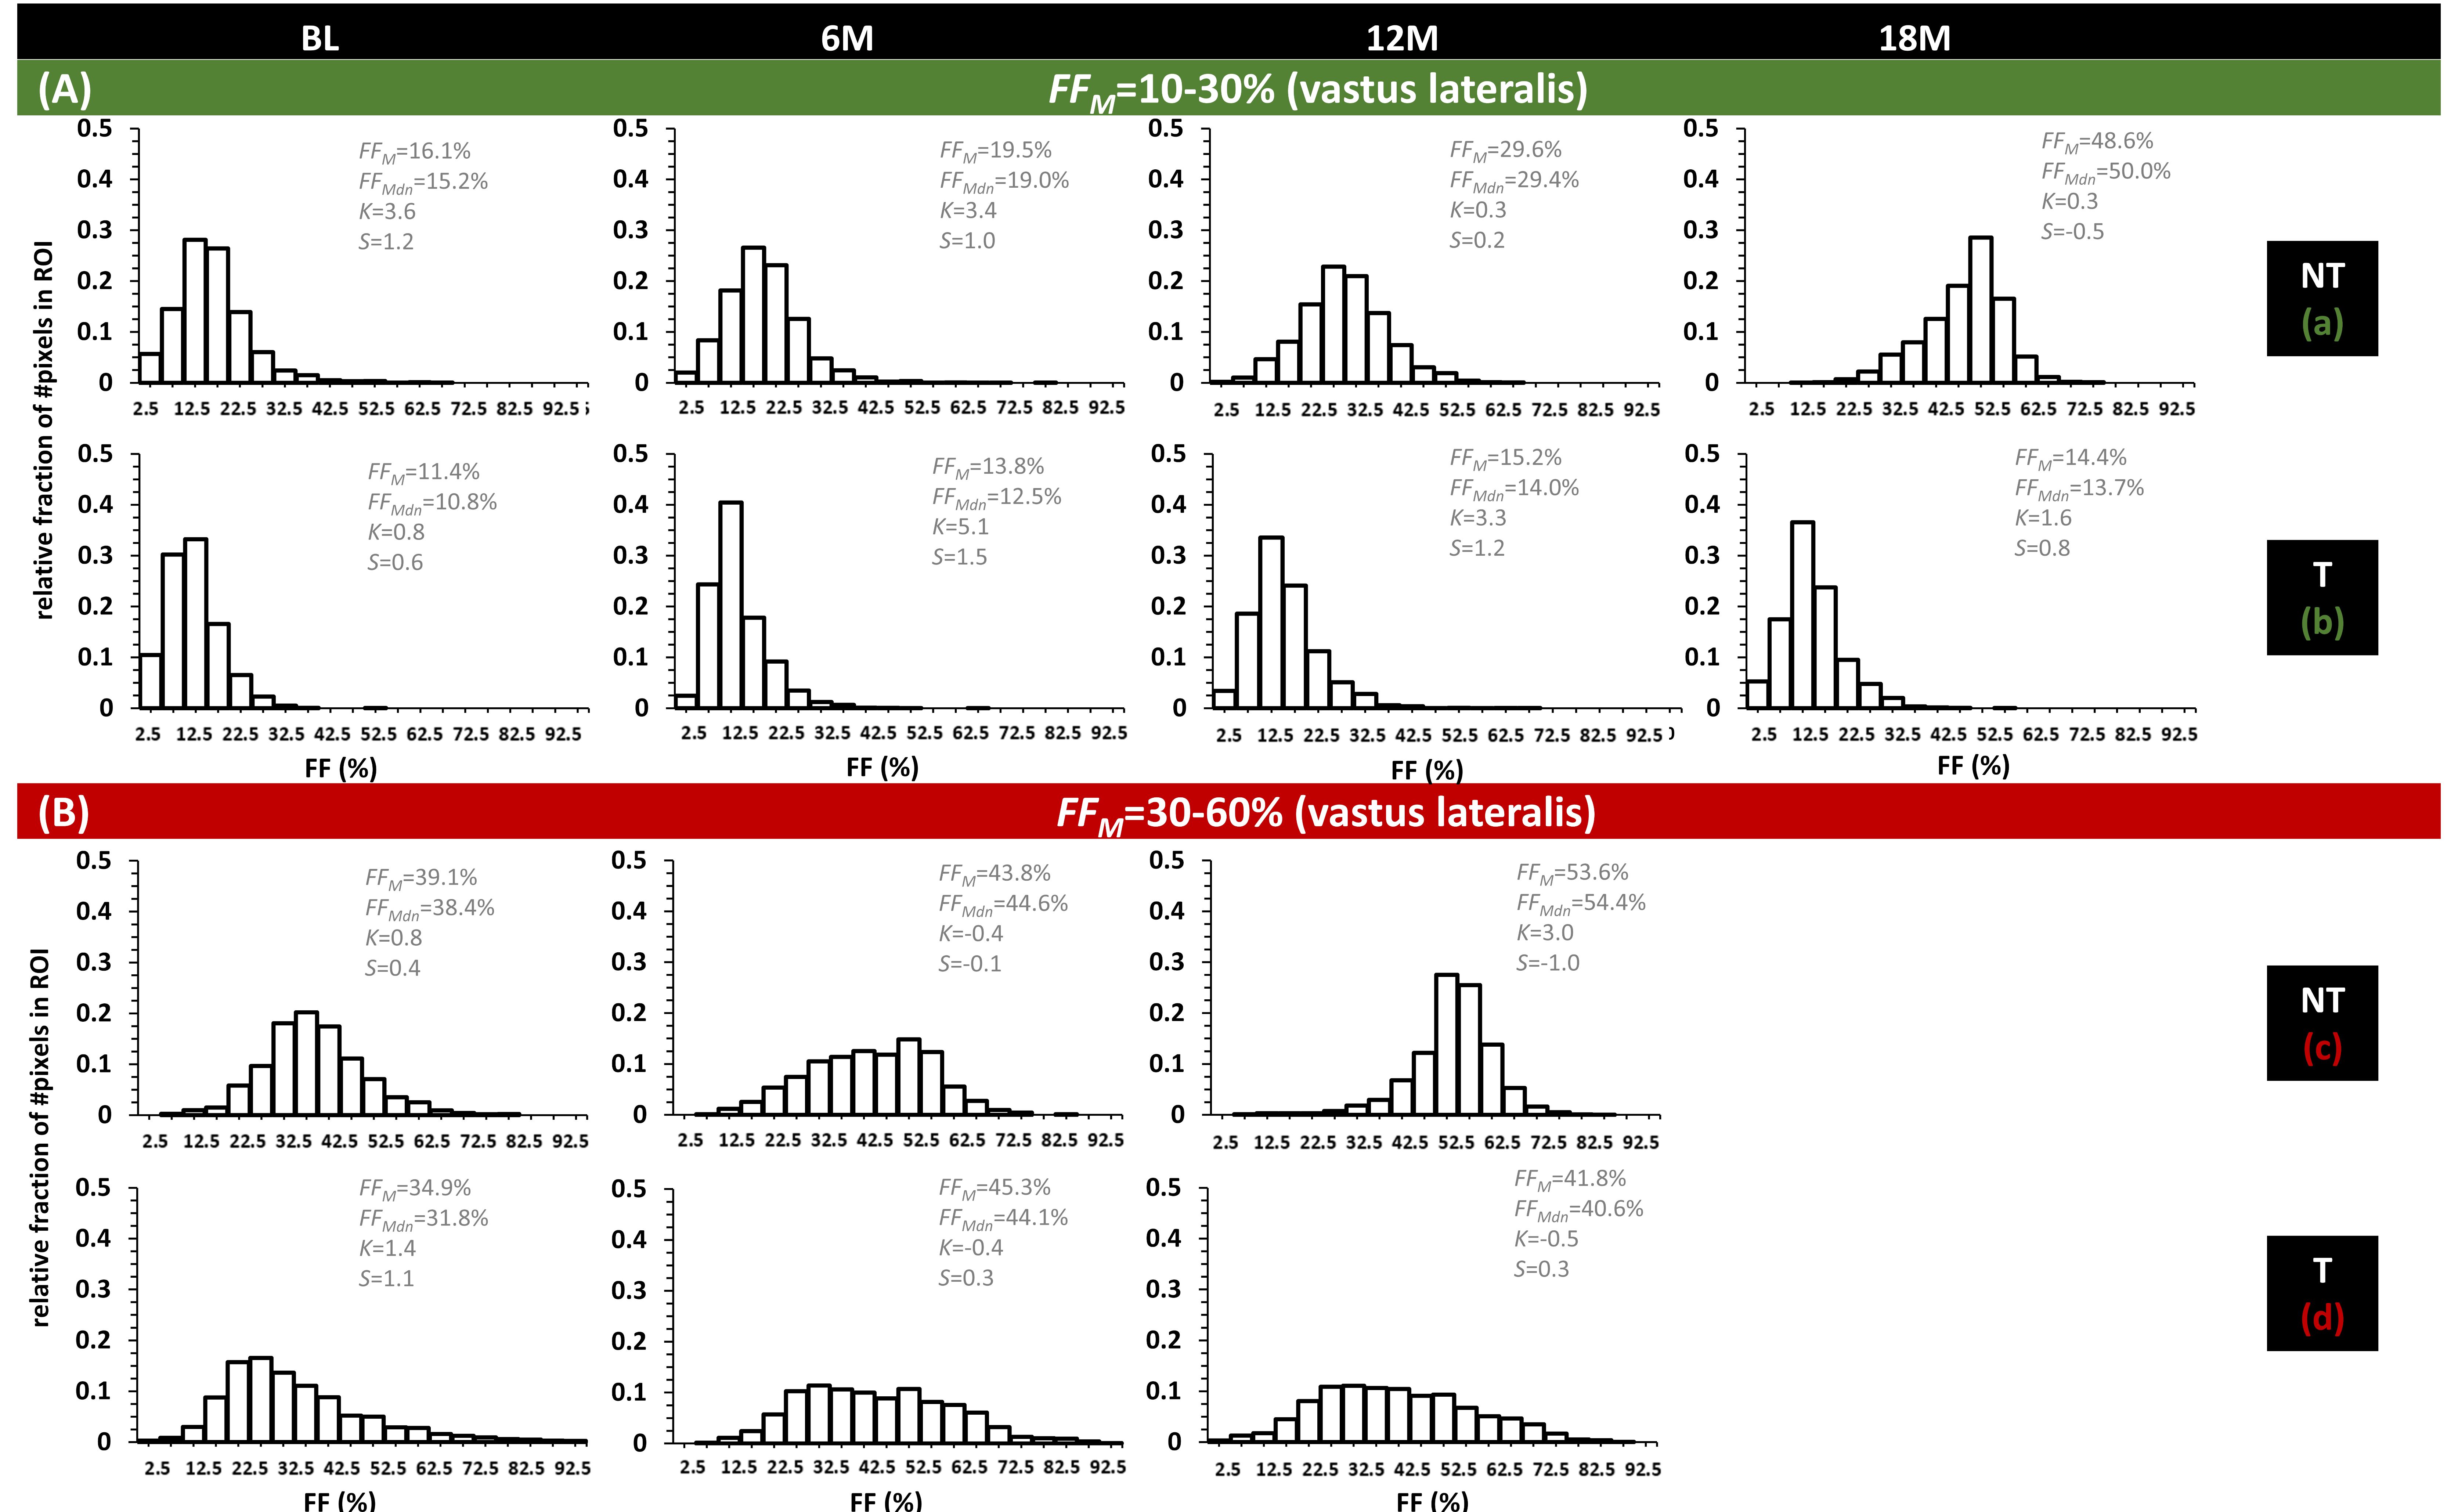
Fig. 2A shows the individual FFM trajectories for the VL muscle in the NT and T groups with no clear distinction between both groups. No significant differences were found between NT and T groups for the FFM value of BL FF (P=0.005), for all muscles and for VL separately (P=0.374). Also, no significant changes in FF were found between the different time points, in both NT and T groups (see Fig. 2B). When investigating FF metrics, over time, between groups, and when categorizing BL FFM, we could observe significant changes over time, in the NT group, for FFM and FFMdn after 12M (Fig. 3). Investigating the individual patient’s FF distribution over time, especially comparing subjects with similar BL FFM, shows interesting differences in histogram features, as shown in Fig. 4, where a NT-patient is compared with a patient from group T. In Fig. 4B, the NT-patient lost ambulation between 6M and 12M. In Fig. 5, two patients with similar BL FFM in group T show very different FF histograms at BL as well as different FF distributions over time. Interestingly, the FFM of the patient in the lower panel remained constant over one year but the respective histograms differ significantly from one another. As water T2 was also measured in all patients, we investigated whether an increase in FFM between time points was related to a high water T2 values, as demonstrated before in other myopathies7,8. We also need to mention that all patients were treated with corticosteroids, which are known to impact the water T2 9.Discussion
The strong heterogeneity in disease evolution in DMD combined with relatively small patient groups, have certainly contributed in not finding significant changes in FFM between the different time points2-4. More than a mean value for FF, the individual patient’s FF distribution over time might reveal and even predict, in retrospect, future (physiologic, clinical, functional) evolutions. The added information could be used for predicting muscle fat replacement more accurately, which is essential for setting up new studies (which patients to include, treated vs non-treated,…).Acknowledgements
We greatly acknowledge the MRI team at CCHMC, Ohio.References
1Carlier PG, Marty B, Scheidegger O, et al. Skeletal muscle quantitative nuclear magnetic resonance imaging and spectroscopy as an outcome measure for clinical trials. J Neuromuscul Dis. 2016;3(1):1-28.
2Reyngoudt H, Marty B, Boisserie JM, et al. Global versus individual muscle segmentation to assess quantitative MRI-based fat fraction changes in neuromuscular diseases. Eur Radiol. 2020;31(6):4264-4276.
3Reyngoudt H, Baudin PY, Caldas de Almeida Araújo
E, Carlier PG, Marty B. Differences in distribution of MRI-based fat fraction
in lower limb skeletal muscles of six different neuromuscular disorders. Proceedings of the 29th Annual Meeting of ISMRM, 847 (2020).
4Naarding KJ, Reyngoudt H, van Zwet EW, et al. MRI vastus lateralis fat fraction predicts loss of ambulation in Duchenne muscular dystrophy. Neurology. 2020;94(13):e1386-e1394.
5Azzabou N, Loureiro de Sousa P, Caldas de Almeida Araújo E, Carlier PG. Validation of a generic approach to muscle water TWd determination at 3T in fat-infiltrated skeletal muscle. J Magn Reson Imaging. 2015;41(3):645-653.
6Baudin PY, Marty B, Robert B, et al. Qualitative and quantitative evaluation of skeletal muscle fatty degenerative changes using whole-body Dixon nuclear magnetic resonance imaging for an important reduction of the acquisition time. Neuromuscul Disord. 2015;25(10):758-763.
7Carlier PG, Azzabou N, Loureiro de Sousa P, et al. Skeletal muscle quantitative nuclear magnetic resonance imaging follow-up of adult Pompe patients. J Inherit Metab Dis. 2015;38(3):565-572.
8Reyngoudt H, Marty B, Caldas de Almeida Araújo E, et al. Relationship between markers of disease activity and progression in skeletal muscle of GNE myopathy patients using quantitative NMRI and 31P NMRS. Quant Imaging Med Surg, 2020;10(7): 1450-1464.
9Arpan I, Willcocks RJ, Forbes RS, et al. Examination of effects of corticosteroids on skeletal muscles of boys with DMD using MRI and MRS. Neurology. 2014;83(11):974-980.
Figures