2069
MRI-based radiomics quantification for characterization of clear cell renal cell carcinoma.1Department of Radiology, Icahn School of Medicine at Mount Sinai, New York, NY, United States, 2BioMedical Engineering and Imaging Institute, Icahn School of Medicine at Mount Sinai, New York, NY, United States, 3Department of Urology, Icahn School of Medicine at Mount Sinai, New York, NY, United States, 4Division of Oncological Sciences, Icahn School of Medicine at Mount Sinai, New York, NY, United States
Synopsis
In this prospective, single-center study, we evaluated the use of qualitative features and quantitative radiomics features from MRI for diagnosis and characterization of clear cell renal cell carcinoma (ccRCC). Qualitative features in isolation were of no value for diagnosing ccRCC, while the ccRCC likelihood score, which takes into account qualitative T2w signal and contrast enhancement pattern, had comparable diagnostic performance to the quantitative radiomics features. Quantitative radiomics features had good to excellent diagnostic performance in identifying ccRCC, as well as correlated to grade of ccRCC.
Introduction
Renal cell carcinoma (RCC) is the third most common genitourinary cancer in the US1. Increased use of cross-sectional imaging contributes to the increased diagnosis of RCC, as 50% of newly diagnosed RCCs are detected incidentally on imaging obtained for other clinical indications1. A high proportion of operated renal lesions (30% of lesions <2 cm) are benign, which raises the concern of over-treatment2. Due to heterogeneity of renal masses, and to poor diagnostic accuracy of biopsies, pre-operative distinction of benign lesions from RCC, and particularly from clear cell (cc)RCC, the sub-type with the greatest risk of recurrence, is an unmet need. Recent advances in radiomics have led to an increased interest in applying radiomics analysis to MRI for non-invasive prediction of the histopathological phenotype of RCC. The purpose of our study was to evaluate the value of qualitative features and quantitative radiomics features from MRI for diagnosis and characterization of ccRCC.Methods
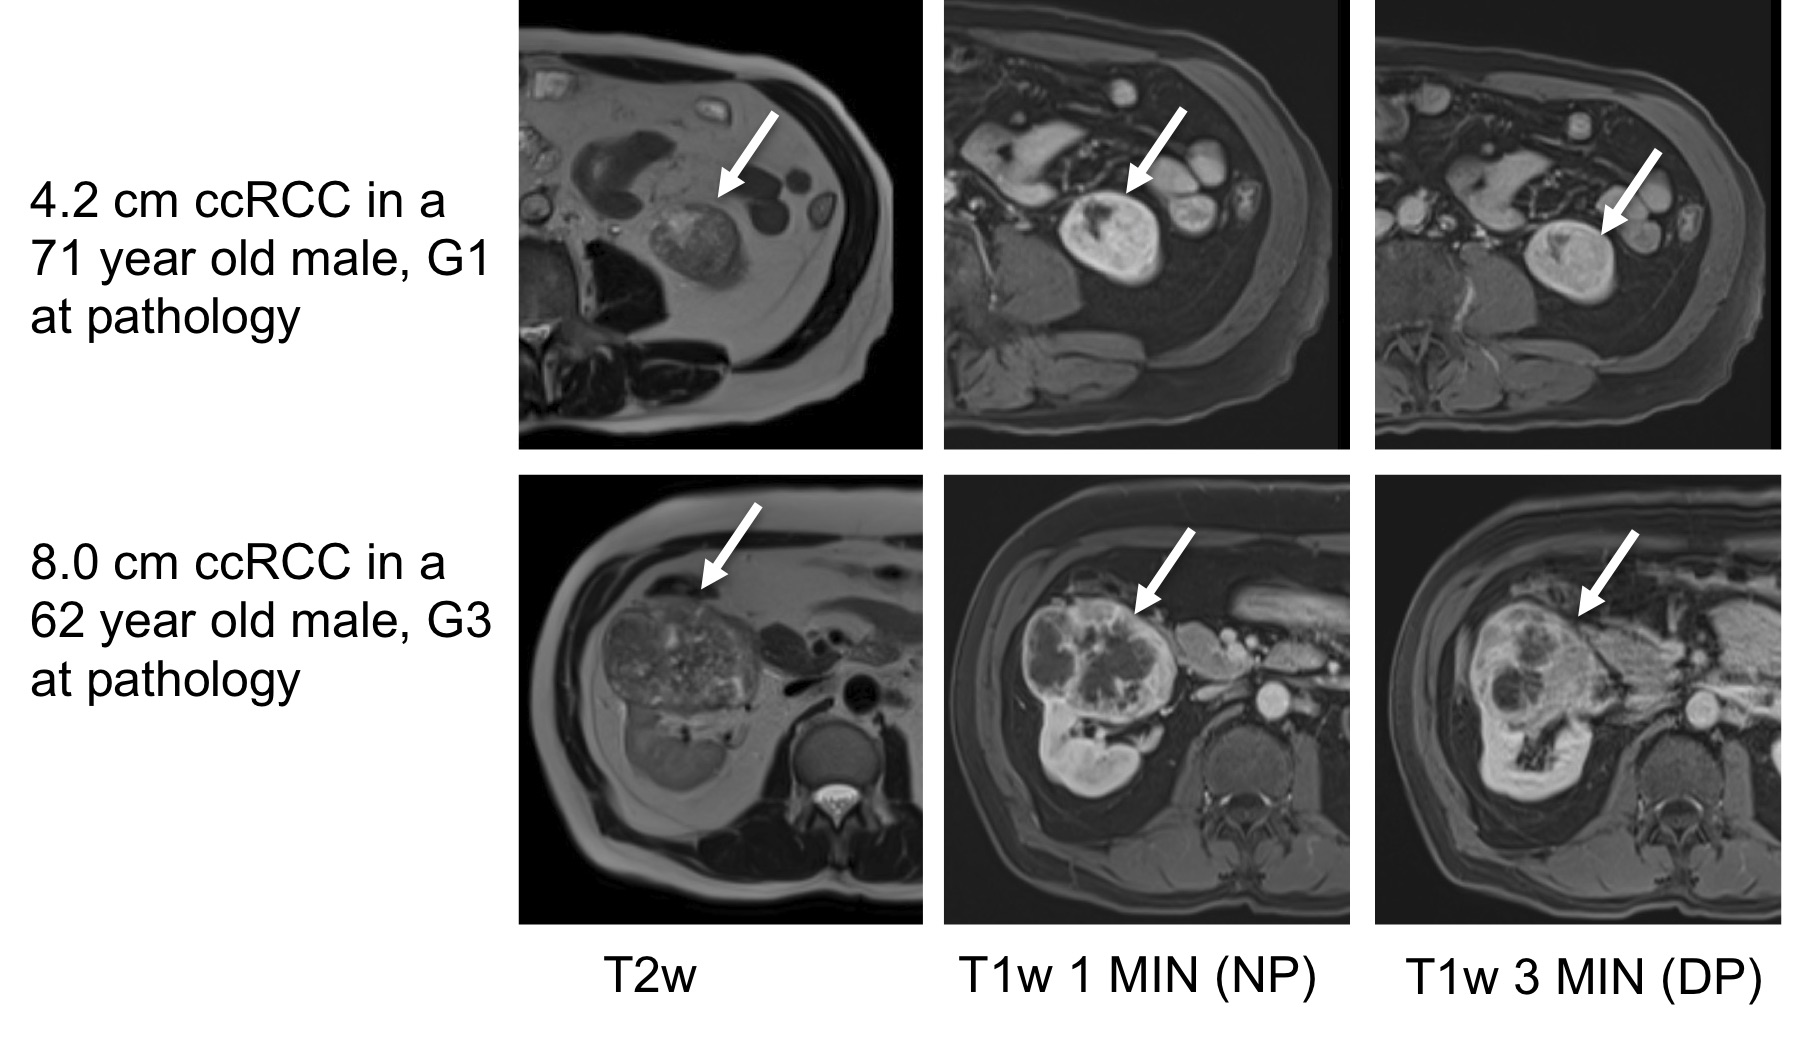
In this ongoing prospective single center study, we included patients with small renal masses (SRM) who underwent MRI at 1.5T (Aera, Siemens Healthcare) prior to surgical resection between 10/2018-9/2020. The patients underwent the same multiparametric MRI which included axial T2-weighted (T2w: Half-Fourier Acquisition with Single-shot Turbo Spin Echo), axial T1-weighted anatomical (T1w: 3D gradient echo) sequences acquired before and after administration of gadolinium-based contrast agent (Gadavist, Bayer AG), and coronal diffusion-weighted imaging (DWI: 2D echo-planar imaging) with nine b-values. One index lesion per patient was analyzed. Standard qualitative analysis of lesions (margins, growth pattern, composition, status of the collecting system, renal sinus and vessels, hemosiderin, intravoxel fat, homogeneity on nephrographic phase, T1w/T2w patterns, enhancement pattern, DWI and ADC signal) and ccRCC likelihood score3 estimation were performed by an abdominal radiologist with 1 year of experience. Radiomics analysis was performed by the same radiologist. Volumes of interest (VOI) were drawn on T2w, ADC, T1w pre-contrast, and T1w post-contrast (1 and 3 minutes) and a total of 540 shape, first and second order radiomics features were extracted for each tumor using an imaging post-processing software (Olea Medical). All data was interpolated to uniform voxel size of 1 mm3, and radiomics features were normalized on all sequences, except on ADC, to preserve the quantitative information in first order features. Clinical histopathology of the resected renal masses identified tumor type, TNM stage and WHO grade. Examples of patients with clear-cell renal carcinoma (ccRCC) are shown in Figure 1. Redundant radiomics features were eliminated based on a Spearman correlation threshold (>0.95). ANOVA, Mann-Whitney U test and ROC analysis were used for distinction of ccRCC versus other SRM and for tumor stage. Spearman correlation was used to correlate radiomics features with ccRCC World Health Organization (WHO) grade.Results
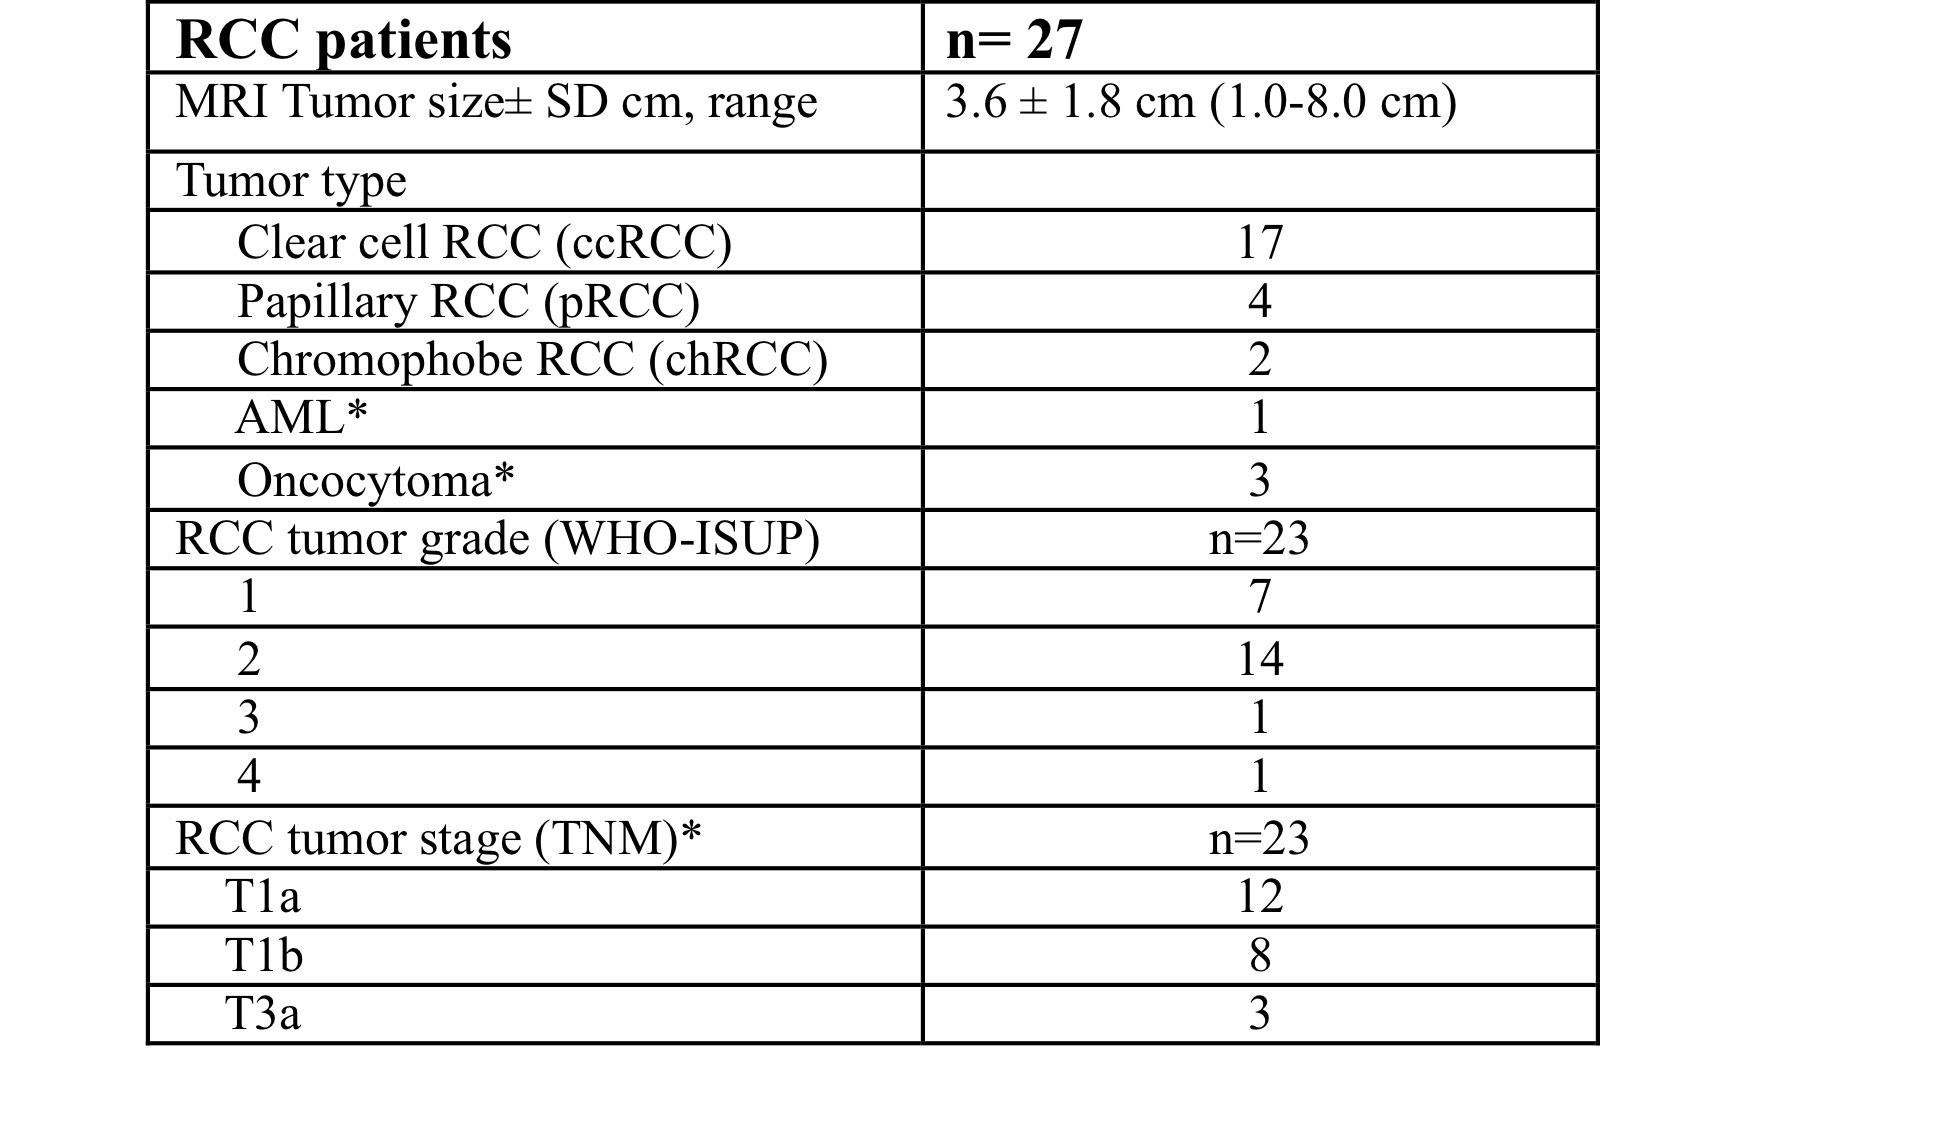
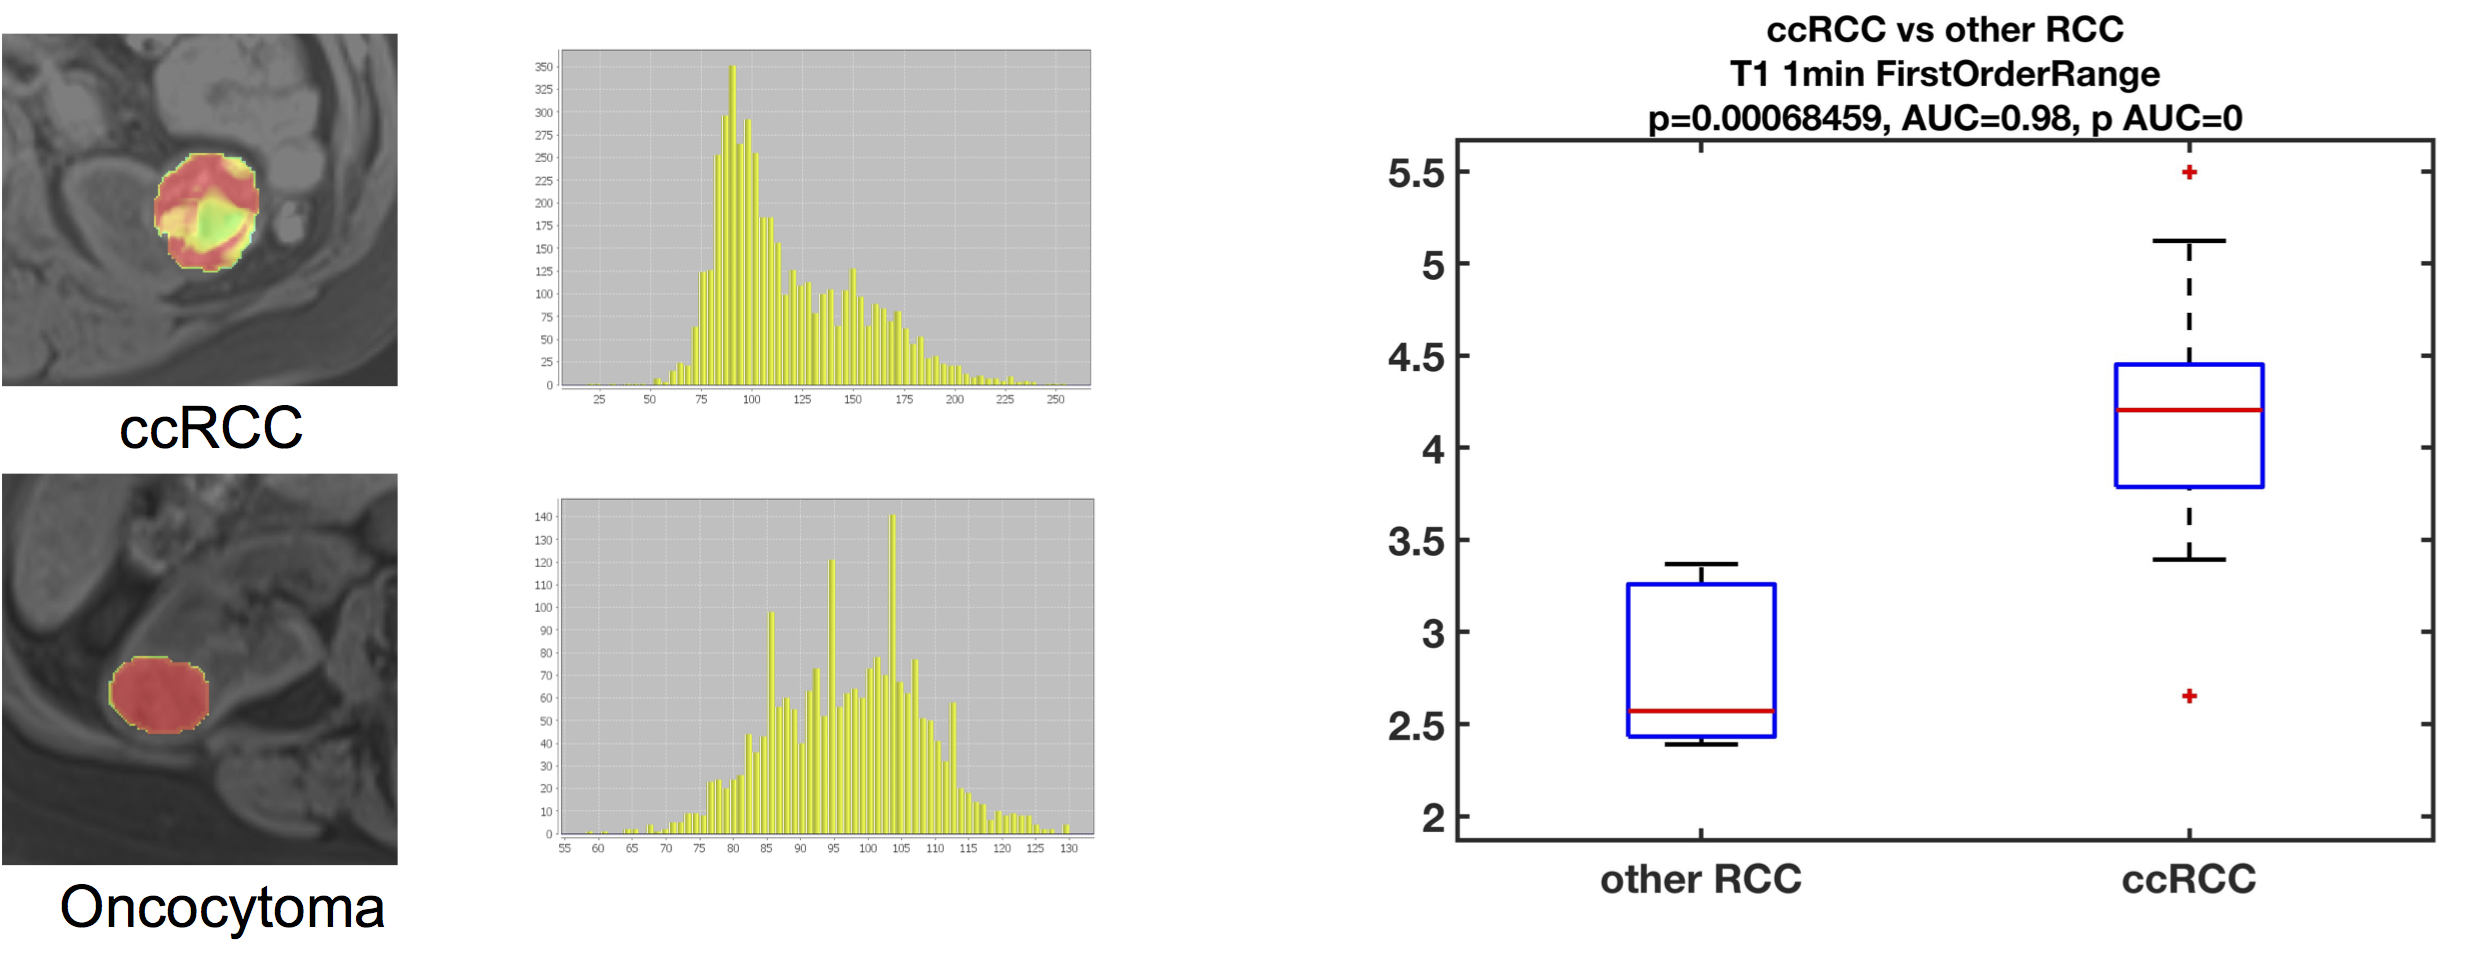
We report preliminary results from 27 lesions [Table 1; 17 clear-cell renal carcinoma (ccRCC), 6 non-ccRCC, and 4 benign] in 27 patients (19M/8F, mean age 59.5y). Mean lesion size was 3.6±1.8cm (range 1.0–8.0cm). Of the 23 malignant lesions, 12 were T1a lesions (tumor restricted to the kidney, <4 cm in largest diameter), and most lesions (n=14) had WHO grade 2.The ccRCC likelihood score was significant for identifying ccRCCs (Figure 2; p=0.021, AUC=0.77), but no other qualitative features identified ccRCCs (p>0.646) or were correlated with grade (p>0.338). 422 of 540 measured radiomics features were non-redundant. We observed differences in radiomics measurements between ccRCC and other SRMs using 13 features with AUC>0.8 (p<0.002), including mean/median ADC (Figure 3). 95 first/second order features and 26 shape features discriminated T1a ccRCC from higher stage ccRCCs with AUC>0.8 (p<0.003). Five first order features (Figure 4; pre-contrast T1w signal mean, maximum, root means squared, T2w signal root mean squared, and ADC signal bottom 10th percentile) were correlated with ccRCC WHO grade (highest correlation observed for pre-contrast T1w First Order Maximum, r=0.57, p=0.016).Discussion
We found that qualitative features in isolation are of limited value for diagnosing ccRCC. The ccRCC likelihood score was promising and had comparable performance to the quantitative radiomic features. Quantitative radiomics features had good to excellent diagnostic performance in identifying ccRCC, as well as in distinguishing between stages of ccRCC. We observed moderate positive correlations between ccRCC grade and pre-contrast T1w signal mean, maximum and root mean squared, while lowest 10% of ADC values and root mean square on T2w images had moderate negative correlations to ccRCC grade. Our findings are in concordance with previous publications, which show radiomics to be valuable for distinguishing ccRCC from other renal masses4,5 and for assessment of ccRCC grade6.Conclusion
MRI-based radiomics features are useful in accurately diagnosing and characterizing ccRCC. Validation of the diagnostic performance of radiomics and combined radiomics-qualitative models is needed in a larger number of patients, with separate patient groups for training and validation.Acknowledgements
This study received research funding from Bayer Investigator Initiated Study IIR-US-2018-5862 grant (PI: SL) and from the Department of Radiology at the Icahn School of Medicine at Mount Sinai (PI: SL).References
1. Siegel RA-O, Miller KA-O, Fuchs HE, Jemal A. Cancer Statistics, 2021. (1542-4863 (Electronic)).
2. Ljungberg B, Albiges L, Abu-Ghanem Y, et al. European Association of Urology Guidelines on Renal Cell Carcinoma: The 2019 Update. (1873-7560 (Electronic)).
3. Canvasser NE, Kay FU, Xi Y, et al. Diagnostic Accuracy of Multiparametric Magnetic Resonance Imaging to Identify Clear Cell Renal Cell Carcinoma in cT1a Renal Masses. The Journal of urology 2017;198(4):780-786.
4. Goyal A, Razik A, Kandasamy D, et al. Role of MR texture analysis in histological subtyping and grading of renal cell carcinoma: a preliminary study. Abdominal Radiology 2019;44(10):3336-3349.
5. Said D, Hectors SJ, Wilck E, et al. Characterization of solid renal neoplasms using MRI-based quantitative radiomics features. Abdominal radiology (New York) 2020;45(9):2840-2850.
6. Dwivedi DK, Xi Y, Kapur P, et al. Magnetic Resonance Imaging Radiomics Analyses for Prediction of High-Grade Histology and Necrosis in Clear Cell Renal Cell Carcinoma: Preliminary Experience. Clinical Genitourinary Cancer 2021;19(1):12-21.e11.
Figures