2067
GluCEST in Deep Gray Matter and Adjoining White Matter of pediatric-onset Multiple Sclerosis Brains using a Robust B1-calibration Approach1Radiology, Center for Advanced Metabolic Imaging in Precision Medicine (CAMIPM), University of Pennsylvania, Philadelphia, PA, United States, 2Neurology, Children's Hospital of Philadelphia, Philadelphia, PA, United States
Synopsis
Several proton magnetic resonance spectroscopy (1H-MRS) based studies have reported regional alterations of glutamate metabolism in both acute and chronic multiple sclerosis (MS) pathologies, including in normal appearing white matter and mixed tissues. Despite its well-established capability for detecting altered glutamate metabolism, 1H-MRS is hampered by the low spatial resolution that precludes the measurements from small MS lesions. We demonstrate the feasibility of performing glutamate weighted imaging using chemical exchange saturation transfer with B0- and B1- corrections in pediatric-onset MS subjects. The proposed model for B1-calibration is a major improvement over the phenomenological method previously proposed by our group.
Introduction
Direct and indirect evidences have shown that excess glutamate (Glu) leads to severe excitotoxic damage to oligodendrocytes and neurons in the brains of both multiple sclerosis (MS) patients (1,2) and in experimental autoimmune encephalomyelitis (EAE) mice (3). Several proton magnetic resonance spectroscopy (1H-MRS) studies have shown regional alterations of glutamate metabolism in MS brains (4-7), including in both acute and chronic MS pathology, normal appearing white matter (NAWM) and mixed tissues. Despite its well-established capability for detecting altered glutamate metabolism, 1H-MRS is hampered by the low spatial resolution that precludes the measurements from small MS lesions. Though O’Grady et al. (8) have attempted to measure glutamate weighted contrast in MS subjects, the method may be suboptimal, resulting in unrealistic glutamate weighted contribution (refer the discussion section). Though glutamate weighted CEST (GluCEST) can be used to assess relative contribution of Glu across the entire slice, better B1-calibration strategy is needed to improve the quantification accuracy. Previously, we proposed a phenomenological model for B1-calibration (8), where a functional form of parametric surfaces over the space (B1, T1) was used to correct the GluCEST signal from each pixel for B1-inhomogeneties. In this work, we made major improvements over the aforementioned phenomenological B1-calibration method. We also demonstrate very good reproducibility of GluCEST and its ability to detect Glu dysregulation in substructures of in pediatric-onset MS (POMS) subjects.Methods
After an informed consent under an approved IRB protocol by the Children’s Hospital of Philadelphia, 6 healthy controls (aged 19.7±1.86 years, 3 males, 3 females) and 6 POMS subjects (aged 19.6±1.9 years, 2 males, 4 females) were scanned a 7.0T MRI scanner (MAGNETOM Terra, Siemens Healthcare, Erlangen, Germany) using a Siemens volume coil transmit/32-channel receive proton head phased-array coil. As for the reproducibility, two healthy controls were scanned twice. The prototype sequence consisted of the pulse train (8x100ms Hanning windowed, duty cycle 99%, B1,rms of 3.05 μT), followed by GRE read out with TR = 3.5ms, TE = 1.47ms, BW= 690 Hz/pixel. For B1-calibration CEST weighted data were acquired for multiple nominal B1 = [0.73, 1.30, 1.90, 2.48, 3.05, 3.28] μT. B0-correction: Water saturation shift referencing (WASSR) images (9) (from ±0 to ±1.0 ppm with a step-size of ±0.1 ppm) was used to generate B0-map and B0-correction were performed using appropriate shifting of spectra following by the cubic interpolations. B1-correction: Previously, we proposed a phenomenological model for B1-calibration (8), where a functional form of parametric surfaces over the space (B1, T1) was used to correct the GluCEST signal from each pixel for B1-inhomogeneties. For this work, the proposed method was further improved: (i) First GluCEST data was denoised using a hybrid metric consisting of similarity component and distance metric. The weight (w(i,j)<1) , between ith and jth voxels, was calculated by combining the similarity and distance metric:$$ W(i,j) = \frac{1}{d} \times \frac{(e^{-\frac{SKL_{ij}}{h}})}{\sum_j{(e^{-\frac{SKL_{ij}}{h}})}}$$
where 'h', the tuning parameter, was set to be 0.001 empirically. The term SKLij is the symmetric Kullbeck-Leibler score derived from B1-dependent CESTW data from ith and jth voxels and 'd' is the distance between those voxels. (ii) Rather than fitting two parametric equations with four parameters each (8), we used a combined calibration curve for positive and negative ppm side with seven parameters (): $$$ (E_0, A^{\pm}, C^{\pm}, D^{\pm}) $$$:
$$ M_z^{\pm}(B_{1}) = E_0 \times [\,1 + \frac{A^{\pm} B_{1}^2}{1+C^{\pm} B_{1}^2} - {D^{\pm} B_{1}^2}] \,$$
Also, the calibrations were performed separately for WM, deep gray matter (GM) structures (thalamus, putamen, caudate) and other remaining GM. Following that, the correction factor was calculated as described in (8).
Results
The inter-day coefficient of variations for GluCEST measurement in deep gray matter and WM were less than 5%. Typical GluCEST maps from a POMS patient and corresponding age- and sex-matched controls are shown in Fig. 1. GluCEST contributions in POMS patients were lowered in WM (11% with p-value <0.05) and increased in deep GM (caudate: 13% with p-value ≈0.055, putamen: 4.68% with p-value ≈0.12, thalamus 3.94% with p-value ≈0.25). We confined our analysis to regions-of-interest (ROIs) with relative B1>0.85 and thus including thalamus, putamen, caudate along with adjoining portion of white matter (WM) tract (refer Fig. 2).Discussion
Lowering of GluCEST-values in WM may be indicative of the reduction in intra-cellular Glu pool due to neurodegeneration, whereas increased GluCEST values in deep GM may be indicative of excitotoxicity. Lowered confidence level can be attributed to smaller sample size and natural anatomical variabilities. In another work involving GluCEST in MS, O’Grady et al. (8) reported unrealistic negative asymmetry values in majority of brains (MS, controls), which imply the protocol being suboptimal for GluCEST detection with nuclear Overhausser effect (NOE) being the major contributor. Their suboptimal GluCEST findings may be attributed to the short saturation duration (100ms) employed by them. In comparison, the saturation duration of 800ms were used in our current work and other GluCEST works (10,11). In near future, we would work on improving B1-profile through the usage of high permittivity dielectric pad (12) so that our phenomenological model can be extended to cortex, GM and other areas of WM.Conclusions
We have demonstrated the feasibility of using GluCEST to infer voxel wise glutamate contribution in pediatric-onset multiple sclerosis.Acknowledgements
Research reported in this publication was supported by the National Institute of Biomedical Imaging and Bioengineering of the National Institutes of Health under award Number P41EB029460 and R03EB030663.References
1. Vallejo-Illarramendi A, Domercq M, Perez-Cerda F, Ravid R, Matute C. Increased expression and function of glutamate transporters in multiple sclerosis. Neurobiol Dis 2006;21(1):154-164.
2. Vercellino M, Merola A, Piacentino C, Votta B, Capello E, Mancardi GL, Mutani R, Giordana MT, Cavalla P. Altered glutamate reuptake in relapsing-remitting and secondary progressive multiple sclerosis cortex: correlation with microglia infiltration, demyelination, and neuronal and synaptic damage. J Neuropathol Exp Neurol 2007;66(8):732-739.
3. Ohgoh M, Hanada T, Smith T, Hashimoto T, Ueno M, Yamanishi Y, Watanabe M, Nishizawa Y. Altered expression of glutamate transporters in experimental autoimmune encephalomyelitis. J Neuroimmunol 2002;125(1-2):170-178.
4. Srinivasan R, Sailasuta N, Hurd R, Nelson S, Pelletier D. Evidence of elevated glutamate in multiple sclerosis using magnetic resonance spectroscopy at 3 T. Brain 2005;128:1016-1025.
5. Azevedo CJ, Kornak J, Chu P, Sampat M, Okuda DT, Cree BA, Nelson SJ, Hauser SL, Pelletier D. In vivo evidence of glutamate toxicity in multiple sclerosis. Ann Neurol 2014;76(2):269-278.
6. Nantes JC, Proulx S, Zhong J, Holmes SA, Narayanan S, Brown RA, Hoge RD, Koski L. GABA and glutamate levels correlate with MTR and clinical disability: Insights from multiple sclerosis. Neuroimage 2017;157:705-715.
7. Muhlert N, Atzori M, De Vita E, Thomas DL, Samson RS, Wheeler-Kingshott CAM, Geurts JJG, Miller DH, Thompson AJ, Ciccarelli O. Memory in multiple sclerosis is linked to glutamate concentration in grey matter regions. J Neurol Neurosur Ps 2014;85(8):834-840.
8. O'Grady KP, Dula AN, Lyttle BD, Thompson LM, Conrad BN, Box BA, McKeithan LJ, Pawate S, Bagnato F, Landman BA, Newhouse P, Smith SA. Glutamate-sensitive imaging and evaluation of cognitive impairment in multiple sclerosis. Mult Scler 2019;25(12):1580-1592.
9. Kim M, Gillen J, Landman BA, Zhou J, van Zijl PC. Water saturation shift referencing (WASSR) for chemical exchange saturation transfer (CEST) experiments. Magn Reson Med 2009;61(6):1441-1450.
10. Nanga RPR, DeBrosse C, Kumar D, Roalf D, McGeehan B, D'Aquilla K, Borthakur A, Hariharan H, Reddy D, Elliott M, Detre JA, Epperson CN, Reddy R. Reproducibility of 2D GluCEST in healthy human volunteers at 7 T. Magn Reson Med 2018;80(5):2033-2039.
11. Cai K, Haris M, Singh A, Kogan F, Greenberg JH, Hariharan H, Detre JA, Reddy R. Magnetic resonance imaging of glutamate. Nat Med 2012;18(2):302-306.
12. Haines K, Smith NB, Webb AG. New high dielectric constant materials for tailoring the B1+ distribution at high magnetic fields. J Magn Reson 2010;203(2):323-327.
Figures
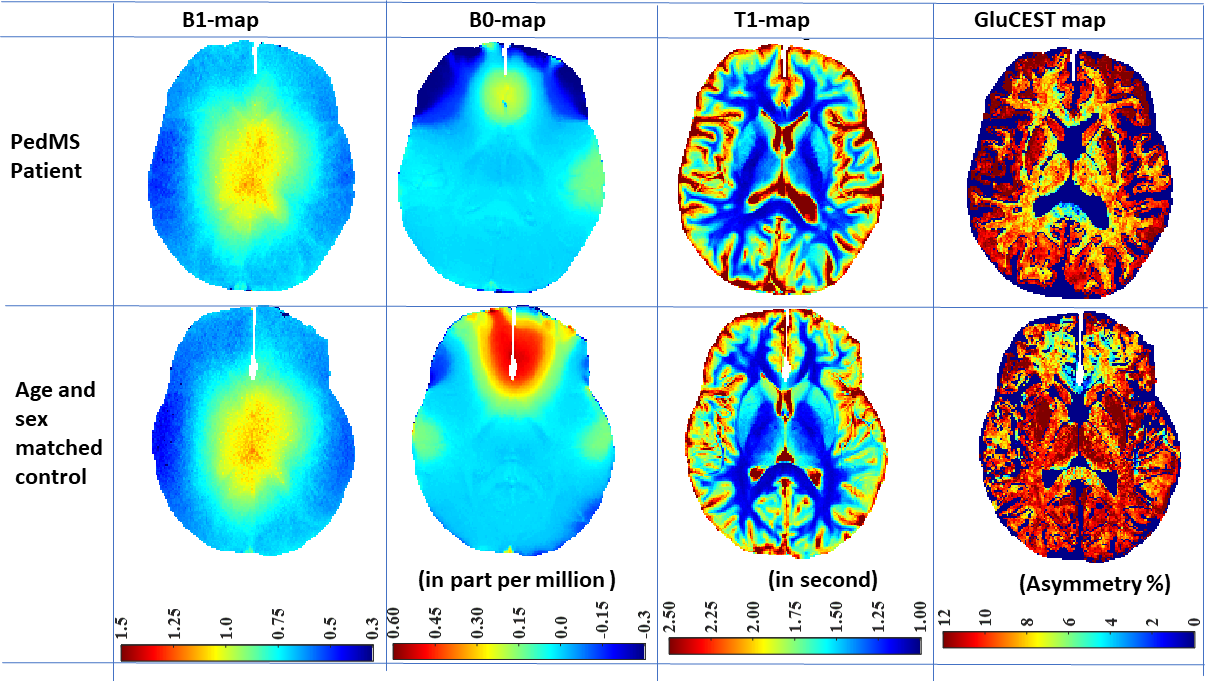
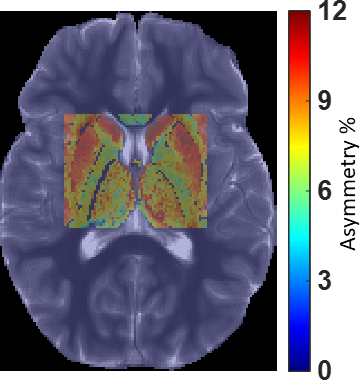
Fig. 2. GluCEST map from a typical region of interest covering deep gray matter and adjoining white matter overlayed on reference T1W image.