2065
3D super-resolution MR elastography of the brain1Physikalisch-Technische Bundesanstalt (PTB), Braunschweig and Berlin, Germany, 2Radiology, Charité - Universitätsmedizin Berlin, Berlin, Germany, 3School of Imaging Sciences and Biomedical Engineering, King's College London, London, United Kingdom, 4Department of Biomedical Engineering, Technical University of Berlin, Berlin, Germany
Synopsis
MR elastography (MRE) provides valuable quantitative information about the mechanical properties of brain tissues. However, due to SNR limitations, often only low through-plane resolution is possible. We present super-resolution MRE based on multiple stacks of complex 3D wavefields of the brain resulting in elastograms with isotropic (1×1×1) mm3 resolution. The approach was evaluated for the in-vivo brain and showed improved visibility of fine structures while presenting consistent shear wave speed values.
Introduction
Magnetic resonance elastography (MRE) provides valuable quantitative information about the mechanical properties of human brain tissue. Commonly, this is done using multi-slice 2D acquisitions. A high signal-to-noise ratio (SNR) is required to be able to determine the stiffness values accurately. However, high SNR in MRE is often ensured by thick image slices, which limits the resolution of details in elastograms[1].Here we present a super-resolution reconstruction (SRR) approach which combines multiple stacks of multi-slice elastography scans with a resolution of (1×1×3) mm3 to a 3D high resolution elastogram with (1×1×1) mm3 isotropic resolution. Compared to a multi-slice acquisition with (1×1×1) mm3 isotropic resolution we obtain 1.8 times higher contrast-to-noise ratio (CNR) and consistent shear wave speed values without an increase in scan time.
Methods
Data acquisition:Data was acquired using spin-echo echo planar imaging on a 3-Tesla MRI system (Lumina, Siemens Healthineers, Erlangen, Germany) with a 32-channel head coil: flip angle: 90°, resolution: (1×1×1) mm3, TE/TR = 125/5230 ms. Three stacks à 25 slices covering a volume of (192×192×75) mm3 were acquired within a total acquisition time of 7 minutes. Each stack was shifted by 1 mm relative to the other stacks along the slice-encoding direction. Consequently, the FOV covered by combining all stacks was (192×192×77) mm3. The following MRE parameters were used: number of MEG directions: 3, mechanical frequencies: 31.25 Hz, 8 time steps over a vibration period.
For comparison, a data set HV was acquired with isotropic resolution of (1×1×1) mm3 and a FOV of (192×192×75) mm3 within 7 minutes of acquisition time. A T1-weighted sequence was used as anatomical reference with a resolution of (1×1×1) mm3 and a FOV of (192×192×75) mm3.
Data postprocessing:
Complex wave fields were recovered from raw data by phase unwrapping, temporal Fourier transformation and spatial filtering[2,3]. Interslice dejittering[4] was applied to generate 3D stacks of complex wave fields which were further processed by SRR. After SSR, wave inversion was performed by wavenumber-based inversion[5] to reconstruct maps of shear wave speed (SWS) as a surrogate marker of stiffness.
As shown in Figure 1, in the state of the art, all steps within the pipeline are applied independently to each acquired slice. In our approach, SRR mixes information of adjacent low-resolution slices of the complex wavefields and the resulting high-resolution wavefields are processed into a high-resolution elastogram.
Super-resolution reconstruction (SRR) of wave images:
The idea of SRR is to acquire several low-resolution stacks of the object from different points of view and to calculate a high-resolution volume from the differences between these[6], as visualized in Figure 2. This can be implemented as an optimization problem, that minimizes the discrepancy between the acquired low-resolution data $$$\tilde{l}$$$ and the low-resolution data $$$l$$$ predicted from the high-resolution volume. Here, $$$s$$$ describes the individual stacks, $$$\tilde{l}$$$ the acquired complex low-resolution (3 mm slice thickness) wave fields, $$$d$$$ their individual spatial directions and $$$w$$$ the high-resolution volume. $$$A$$$ is the effective slice profile of the scanner, calculated from the RF pulse and resulting from the excitation and refocusing pulse[7, 8]. The minimization problem was initialized by SVinit, the combination of the low-resolution stacks taking into account the slice profile of the scanner. It was solved with the Limited-memory BFGS solver[9] and additional Total Variation regularization[10].
$$$\hat w_{d} \ = \underset{w_{d}}{\mathrm{argmin}} \sum_{s=1}^{S} ||\tilde{l_{s,d}}-\underbrace{A_s w_{d}}_\text{$l_{s,d}$}||_2^2 +\lambda {TV}(w_{d})$$$
Results and discussion
SRR was evaluated qualitatively with respect to the visibility of small anatomical structures and quantitatively with respect to the SWS value. SVinit, as a linear combination of the low-resolution stacks, was used as a reference for the SWS values and the isotropically acquired elastogram high-resolution volume HV served as reference for spatial resolution.The complex wavefields before and after SRR are shown in Figure 3: In the different MEG directions, an improved visibility of small structures can be seen, which are shown enlarged in a white box.
Figure 4 displays the resulting elastograms: The input volume SVinit and output volume SVfinal of the SRR are shown, next to HV. The visibility of small structures is improved with the proposed SRR.
To be able to quantitatively assess the visibility of small structures, the CNR in the sulcus (green box in Figure 4) was calculated. The CNR in SVfinal was 1.8 times higher than in HV, allowing us to better differentiate the sulcus from white matter.
The SWS values were compared between the SVinit, SVfinal and HV, once over the entire white matter and once in a small ROI, framed in orange in Figure 4. Table 1 shows that HV underestimates SWS compared to SVinit, while reducing precision, as indicated by the increase in standard deviation when focusing on a small ROI. This can be explained by the decreased SNR of the complex HR wavefields which leads to an underestimation of the SWS values in the elastograms.
Conclusion
The proposed SRR approach generated (1×1×1) mm3 elastograms of the human brain from multiple wavefields acquired with 3 mm slice thickness and shifted by 1 mm along the head-feed axis. This SRR approach was successfully applied to a healthy volunteer, resulting in improved visualization of small details and consistent shear wave speed values of brain tissue.Acknowledgements
The authors gratefully acknowledge funding from the German Research Foundation (GRK2260, BIOQIC).References
[1] Hirsch, S., Sack, I., Braun, J. (2017). Magnetic Resonance Elastography: Physical Background and Medical Applications. Germany: Wiley.
[2] Herthum, H., Dempsey, S. C. H., Samani, A., Schrank, F., Shahryari, M., Warmuth, C., Tzschätzsch, H., Braun, J., & Sack, I. (2021). Superviscous properties of the in vivo brain at large scales. Acta Biomaterialia, 121, 393–404. https://doi.org/10.1016/j.actbio.2020.12.027
[3] Herthum, H., Hetzer, S., Scheel, M., Shahryari, M., Braun, J., Paul, F., & Sack, I. (2021). In vivo stiffness of multiple sclerosis lesions is similar to that of normal-appearing white matter. Acta Biomaterialia. https://doi.org/10.1016/j.actbio.2021.10.038
[4] Barnhill, E., Nikolova, M., Ariyurek, C., Dittmann, F., Braun, J., & Sack, I. (2019). Fast Robust Dejitter and Interslice Discontinuity Removal in MRI Phase Acquisitions: Application to Magnetic Resonance Elastography. IEEE Transactions on Medical Imaging, 38(7), 1578–1587. https://doi.org/10.1109/TMI.2019.2893369
[5] Tzschätzsch, H., Guo, J., Dittmann, F., Hirsch, S., Barnhill, E., Jöhrens, K., Braun, J., & Sack, I. (2016). Tomoelastography by multifrequency wave number recovery from time-harmonic propagating shear waves. Medical Image Analysis, 30, 1–10. https://doi.org/10.1016/j.media.2016.01.001
[6] Greenspan, H., Oz, G., Kiryati, N., & Peled, S. (2002). MRI inter-slice reconstruction using super-resolution. Magnetic Resonance Imaging, 20(5), 437–446. https://doi.org/10.1016/S0730-725X(02)00511-8
[7] Rund, A., Aigner, C. S., Kunisch, K., & Stollberger, R. (2018). Simultaneous multislice refocusing via time optimal control. Magnetic Resonance in Medicine, 80(4), 1416–1428. https://doi.org/10.1002/mrm.27124
[8] Pauly, J., Le Roux, P., Nishimura, D., & Macovski, A. (1991). Parameter relations for the Shinnar-Le Roux selective excitation pulse design algorithm (NMR imaging). IEEE Transactions on Medical Imaging, 10(1), 53–65. https://doi.org/10.1109/42.75611
[9] Liu, D. C., & Nocedal, J. (1989). On the limited memory BFGS method for large scale optimization. Mathematical Programming, 45(1–3), 503–528. https://doi.org/10.1007/BF01589116
[10] Rudin, L. I., Osher, S., & Fatemi, E. (1992). Nonlinear total variation based noise removal algorithms. Physica D: Nonlinear Phenomena, 60(1–4), 259–268. https://doi.org/10.1016/0167-2789(92)90242-F
Figures
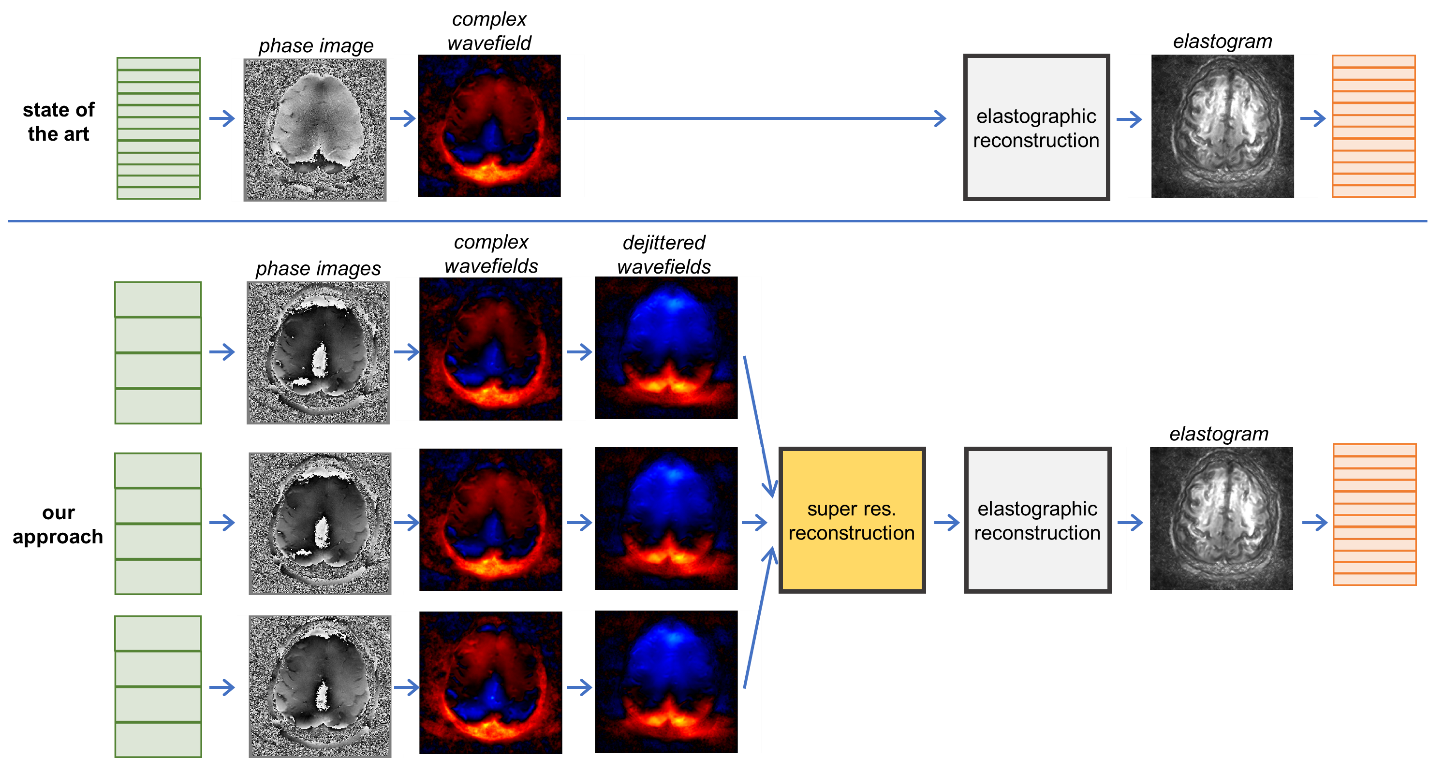
Figure 1: Workflow of the proposed approach compared to the state of the art to acquire high-res. elastograms. In the state of the art, all processing steps from phase images to elastogram are applied to each slice independently. In our approach, complex wave fields are determined for each low-res. slice of each stack, dejittered and then combined to a high-res. wavefield using SRR. The high-res. elastogram is determined from this super-resolved wave field by elastographic reconstruction.
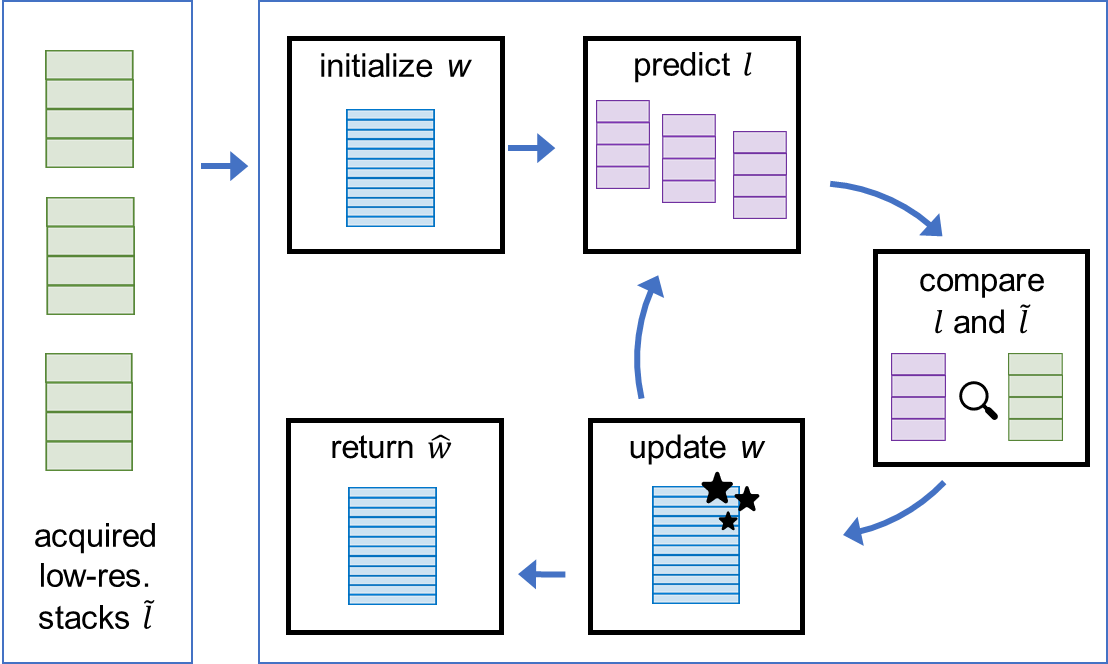
Figure 2: Workflow for SRR: Acquired low-res. data is combined, initializing the iterative process. In each iteration, the difference between the acquired $$$\tilde{l}$$$ and predicted $$$l$$$ low-resolution data is calculated and used to update the high-resolution volume $$$w$$$.
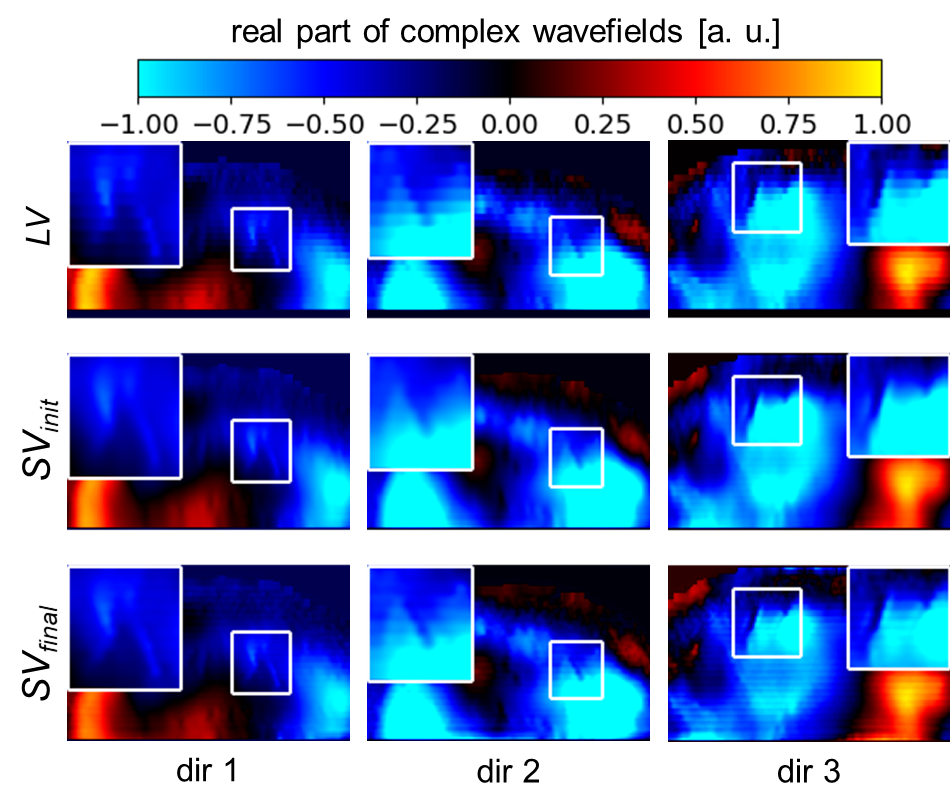
Figure 3: SRR applied on complex wavefields. For every MEG direction, the real part of the complex wavefield of a low-resolution stack LV, the SRR initialization SVinit and its output SVfinal are shown. An improved visualization of small structures can be seen, as shown enlarged in the white boxes.
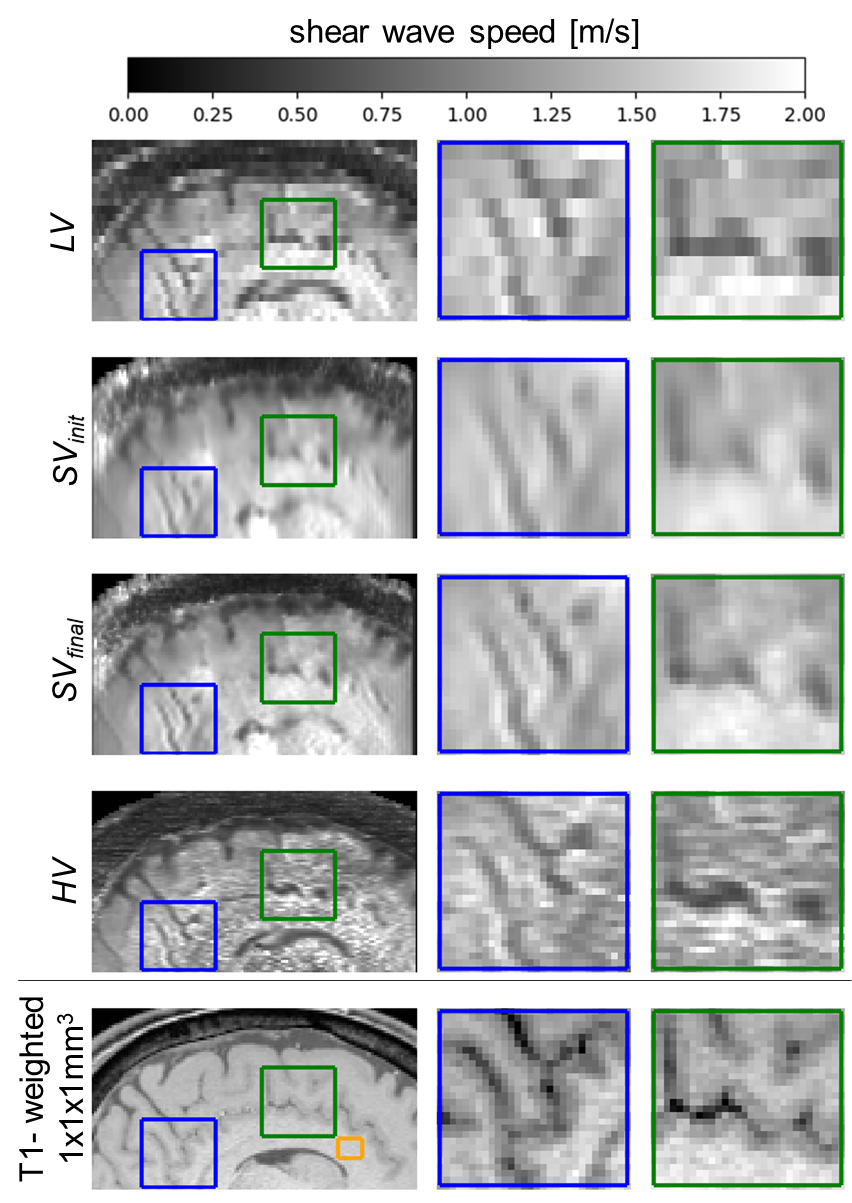
Figure 4: Comparison of the elastogram for a low-resolution stack LV, the SRR initialization SVinit and its output SVfinal. In addition, the elastogram HV directly acquired at isotropic resolution and a T1-weighted scan as anatomical reference are shown. SRR improves the visualization of small details while keeping the same high SNR as the low-resolution stack. Orange ROI in T1-weighted images is referred to in Table 1.
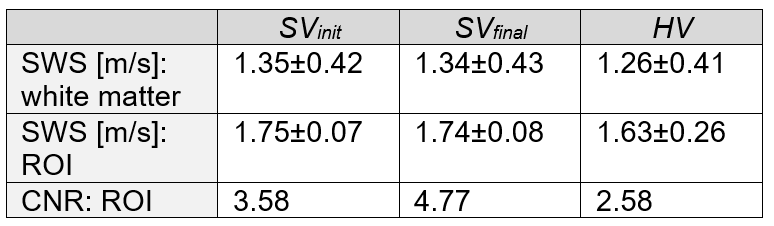
Table 1: Quantitative evaluation of the results: Mean and standard deviation of shear wave speed (SWS) and contrast to noise ratio (CNR) in small region. SWS values in HV are underestimated compared to SVinit and lose precision when focusing on a small region (orange box in Figure 4). CNR of the SRR output SVfinal is higher compared to direct high-resolution acquisition HV due to a clearer differentiation of the tissue types.