2061
Evaluating the match of image quality metrics with radiological assessment in a dataset with and without motion artifacts1Neurobiology Research Unit, Copenhagen University Hospital, Rigshospitalet, Copenhagen, Denmark, 2Department of Mathematical Sciences, University of Copenhagen, Copenhagen, Denmark, 3Niels Bohr Institute, University of Copenhagen, Copenhagen, Denmark, 4Department of Radiology, Copenhagen University Hospital, Rigshospitalet, Copenhagen, Denmark, 5Athinoula A. Martinos Center for Biomedical Imaging, Massachusetts General Hospital, Charlestown, MA, United States, 6Department of Radiology, Harvard Medial School, Boston, MA, United States, 7Department of Radiology, Harvard Medical School, Boston, MA, United States, 8Department of Computer Science, University of Copenhagen, Copenhagen, Denmark
Synopsis
Currently no image quality metric, used for evaluating the performance of artifact correction or image reconstruction methods, is sensitive to all possible image artifacts. This complicates the choice of a proper quantitative quality measure. To provide assistance with this choice, we investigated the correlation of commonly used metrics with radiological evaluation on a dataset acquired with and without motion. The full-reference metrics SSIM and PSNR correlated most strongly with observer scores. Among the reference-free metrics Image Entropy, Average Edge Strength and Tenengrad measure showed a consistent correlation for all investigated sequences.
Introduction
Quantitatively assessing image quality is relevant for many subfields within Magnetic Resonance Imaging (MRI), e.g. for developing and validating new image reconstruction or artifact correction methods. In the motion correction community, a number of image quality metrics have been used1-4. Some „full-reference“ metrics require a ground truth image, whereas other „reference-free“ metrics do not. Furthermore, none of these metrics are sensitive to all possible image artifacts. This lack of a flexible, comprehensive image quality metric complicates the comparison of different methods. In order to get more insight into the clinical relevance of various commonly-used image quality metrics, we evaluated the correlation of these metrics with radiological quality assessment.Methods
We calculated seven commonly-used metrics1-7 (Table 1) on a dataset acquired in 22 healthy adult volunteers with four different MR sequences: T1 MPR, T2 FLAIR, T2 TSE and T1 STIR. The dataset consisted of acquisitions with and without head nodding / shaking motion, as well as with and without prospective motion correction. The uncorrected motionless scans („ground truth“) were not included in the full analysis and only used as reference scans for the full-reference metrics (Figure 1A). Code for calculating the different image quality metrics is available at https://github.com/melanieganz/MoCoProject/tree/main/ImageQualityMetrics.As gold standard for image quality, observer quality scores were given by one experienced radiologist (NS) and two recently graduated radiographers, using an ordinal scale (Figure 1B), which was based on the Likert scale defined by Kecskemeti et al3. Inter-observer reliability was quantified by Cohen’s kappa, which varied between 0.42 - 0.53 (MPR), 0.15 - 0.51 (FLAIR), 0.54 - 0.56 (TSE) and 0.42 - 0.49 (STIR). The individual ratings were averaged with double weight for the radiologist.
The correlation of each metric with the observer scores was determined using the Spearman’s correlation coefficient8. Even though this coefficient is more difficult to interpret, we favored it over the Pearson correlation coefficient, since the scale of the observer scores was not necessarily linear and thus, Pearson’s linearity assumption might be violated. Nevertheless, a regression line was plotted for better visualization of the data.
Results
Figure 2 shows the distribution of all metric values relative to the observer quality scores for the T2 TSE sequence. The correlation coefficients for all metrics and all sequences are summarized in Figure 3. The correlation with observer scores was strongest for the full-reference metrics SSIM and PSNR. While the correlation was significant in all sequences for Image Entropy, Average Edge Strength and Tenengrad measure, the correlation of Gradient Entropy and Co-occurence Entropy was only significant for a subset of sequences.Discussion
MR images can be degraded by various artifacts like ghosting, ringing or blurring, which hamper quantitative image quality assessment, since no single image quality measure is sensitive to all possible artifacts7,9. Gradient-based metrics like Tenengrad, Average Edge Strength and Gradient entropy are designed to quantify sharpness of intensity changes, whereas metrics like SSIM and Co-occurence Entropy aim to assess structural or texture-based information. We found the full-reference metrics SSIM and PSNR - calculated relative to a ground truth scan - to be most strongly correlated with radiological evaluation of image quality. However, in many cases, i.e. when evaluating prospective motion correction techniques, a reliable ground truth scan is not available, which makes these two metrics inapplicable. Among the reference-free metrics included in our analysis, the Image Entropy, Average Edge Strength and Tenengrad measure showed the strongest correlation with radiological evaluation. The gradient-based Average Edge Strength and Tenengrad measure could be misleading in the case of strong intensity changes caused by ghosting artifacts. Furthermore, we observed that a mild degree of ringing was not reflected in any of the tested image quality metrics, which might be explained by averaging operations which are a part of most of the metric calculations. Consequently, additional qualitative image assessment might be advantageous. A limitation of observer quality scoring is its subjectivity. As our analysis of inter-observer reliability showed, the scores from the three raters varied with a Cohen’s Kappa between 0.15 and 0.56, with moderate agreement for some sequences and low agreement for others. Therefore, it is recommended to average the scores of several raters for more reliable assessment.Conclusion
All in all, our results demonstrate that SSIM and PSNR were most correlated with radiological evaluation, if an adequate reference scan is available. Wherever this is not the case, our analysis suggests that Image Entropy, Average Edge Strength and Tenengrad measure are the most strongly correlated reference-free metrics, relative to visual assessment by expert. Therefore, we recommend the usage of either SSIM and PSNR, if a reference is available, or a combination of Image Entropy, Average Edge Strength and Tenengrad in the reference-free case. Furthermore, in the latter case, we would also recommend additional qualitative evaluation by a number of experts.Acknowledgements
No acknowledgement found.References
- Pannetier N, Stavrinos T, Ng P et al. Quantitative framework for prospective motion correction evaluation. Magn Reson Med. 2016; 75(2):810-816.
- Usman M, Latif S, Asim M et al. Retrospective motion correction in multishot MRI using generative adversarial network. Scientific Reports. 2020; 10(4786).
- Kecskemeti S, Samsonov A, Velikina J et al. Robust motion correction strategy for structural MRI in unseated children demonstrated with three-dimensional radial MPnRAGE. Radiology. 2018; 289:509-516.
- Sciarra A, Mattern H, Yakupov R et al. Quantitative evaluation of prospective motion correction in healthy subjects at 7T MRI. Magn Reson Med. 2021; 00:1-12.
- Zbontar J, Knoll F, Sriram A et al. fastMRI: An Open Dataset and Benchmarks for Accelerated MRI. ArXiv. 2018; http://arxiv.org/abs/1811.08839.
- Krotkov E. Focusing. Int J Comput Vis. 1988; 1(3):223-237.
- McGee K, Manduca A, Felmlee J et al. Image metric-based correction (autocorrection) of motion effects: analysis of image metrics. J Magn Reson Imaging. 2000; 11(2):174-181.
- Spearman C. The Proof and Measurement of Association between Two Things. Am J Psychol. 1904; 15(1):72–101.
- Zhang H, Dong B. A review on deep learning in medical image reconstruction. J Oper Res Soc China. 2020; 8:311-340.
Figures
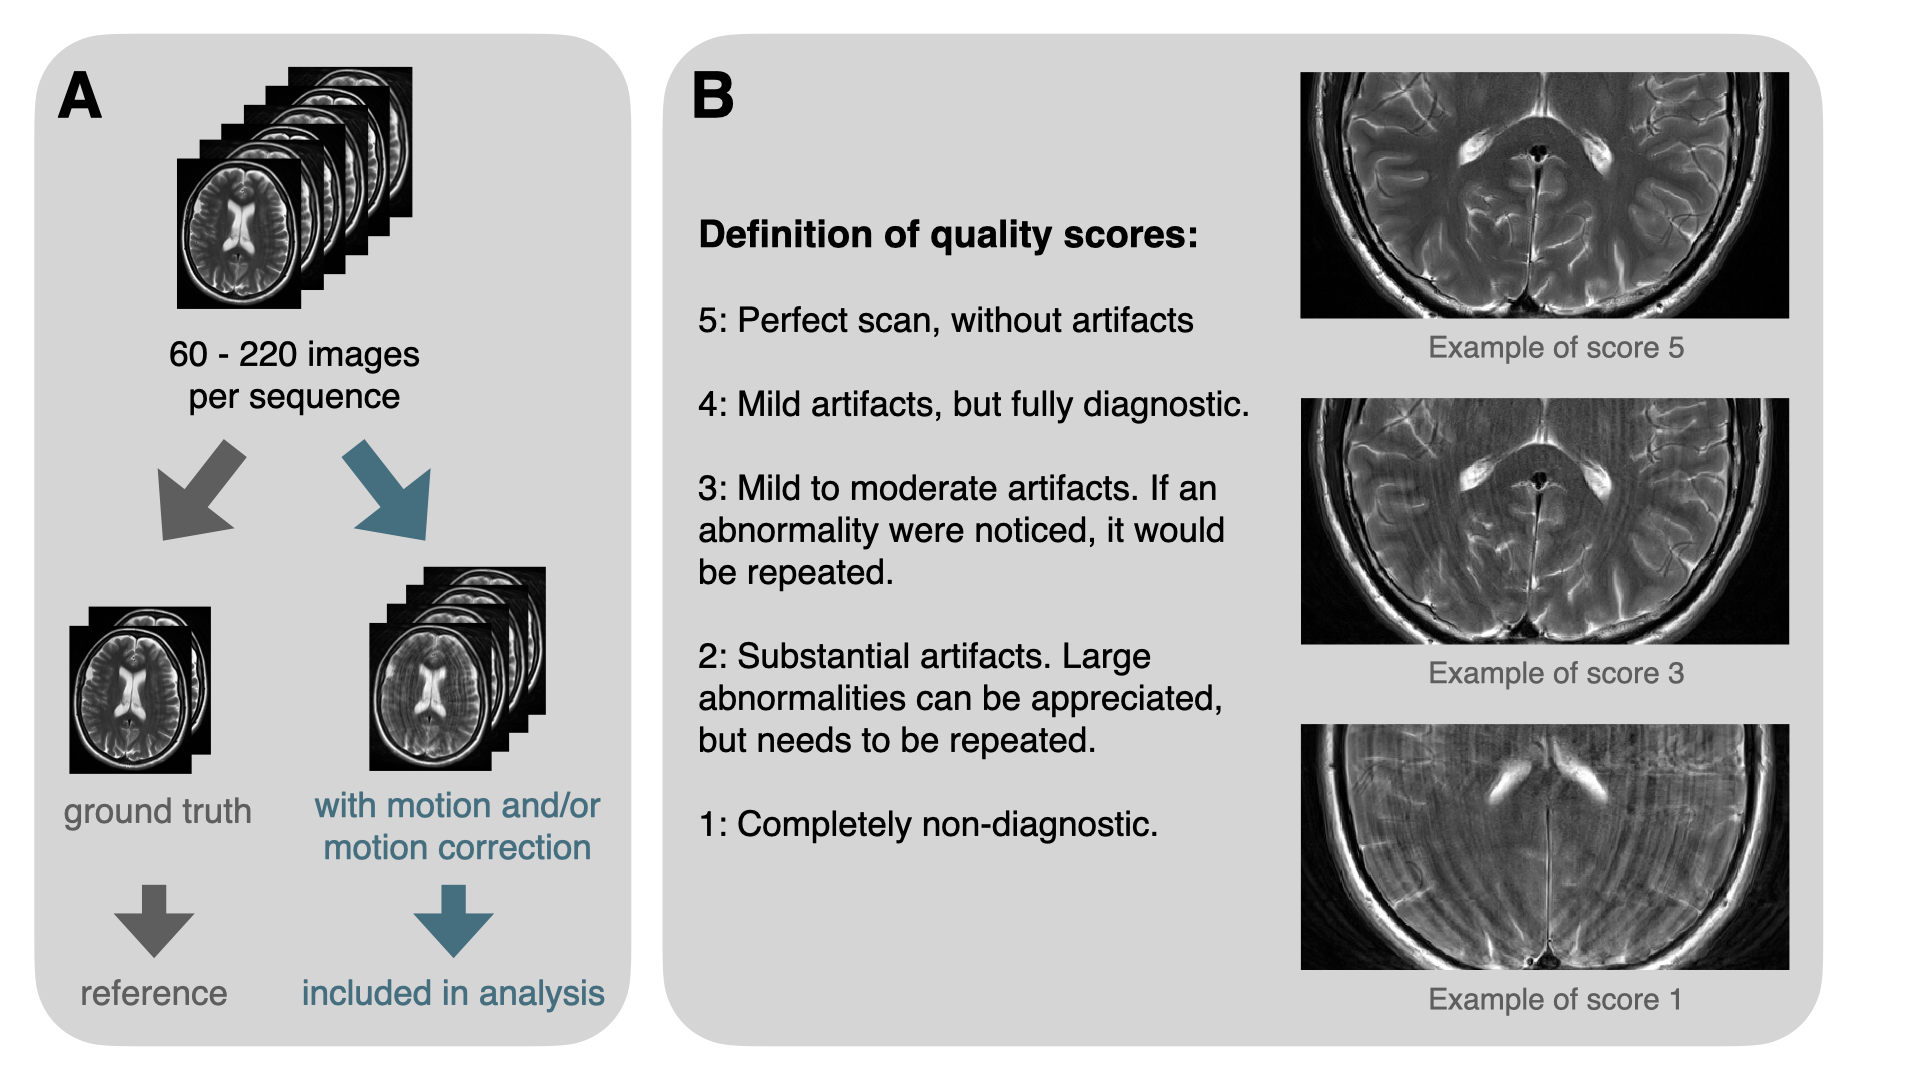
Figure 1: (A) Visualization of splitting the dataset into reference images and images included in the analysis. The reference data consists of still, uncorrected „ground truth“ scans, the scans included in the analysis were acquired with head motion and / or motion correction. (B) Definition of observer quality scores with example snippets of T2 TSE scans graded 1, 3 or 5.
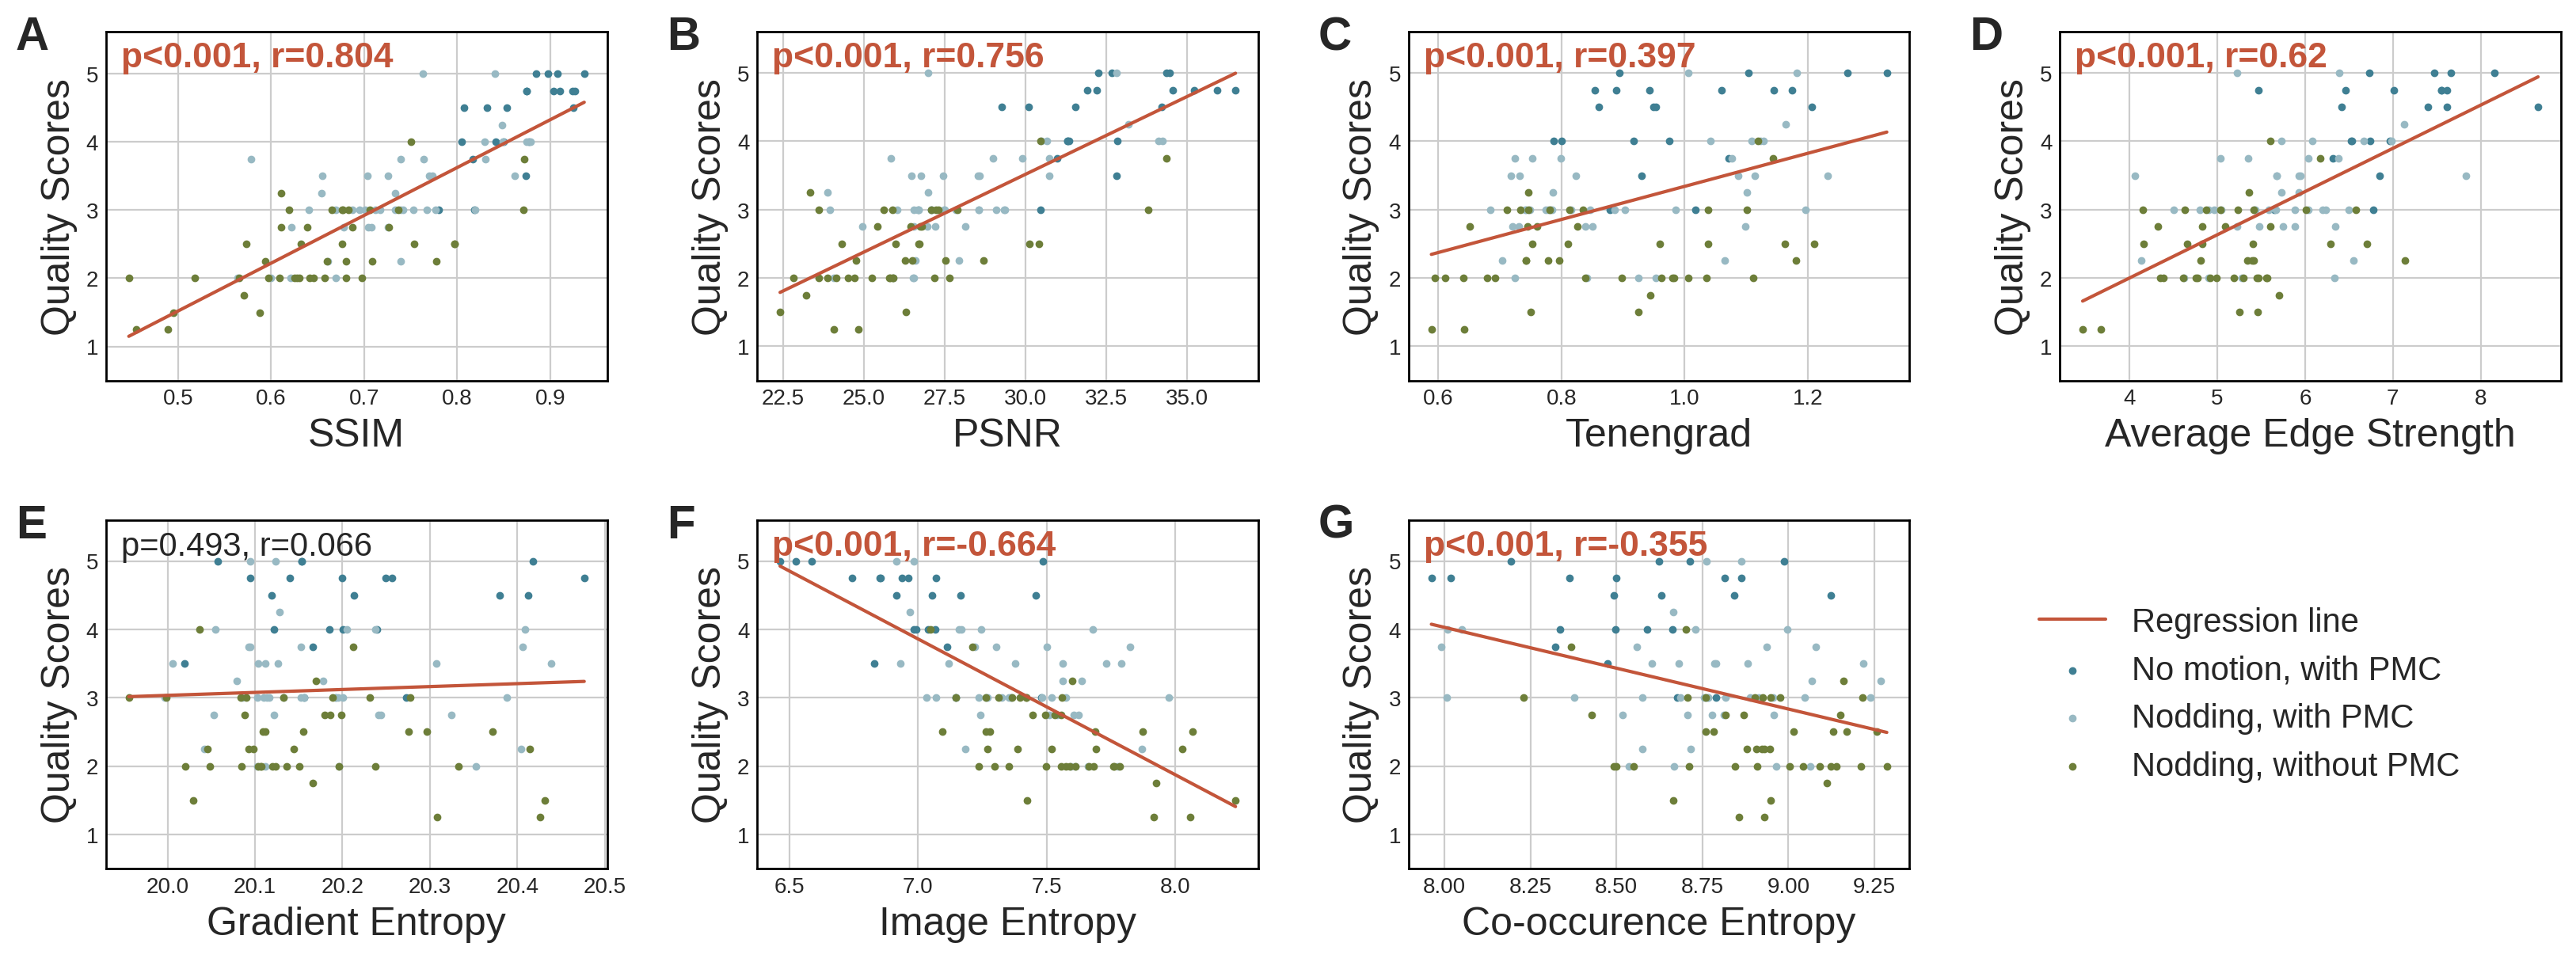
Figure 2: Distribution of observer scores against metric values for T2 TSE scans. The different subfigures show the metrics (A) SSIM, (B) PSNR, (C) Tenengrad, (D) Average Edge Strength, (E) Gradient Entropy, (F) Image Entropy and (G) Co-occurence Entropy. The data points are colored after motion type and whether prospective motion correction (PMC) was applied. The Spearman’s correlation coefficient r and the corresponding p-value are displayed for each metric. Significant correlations (p<0.05) are highlighted by red text. The regression lines are plotted for visualization.
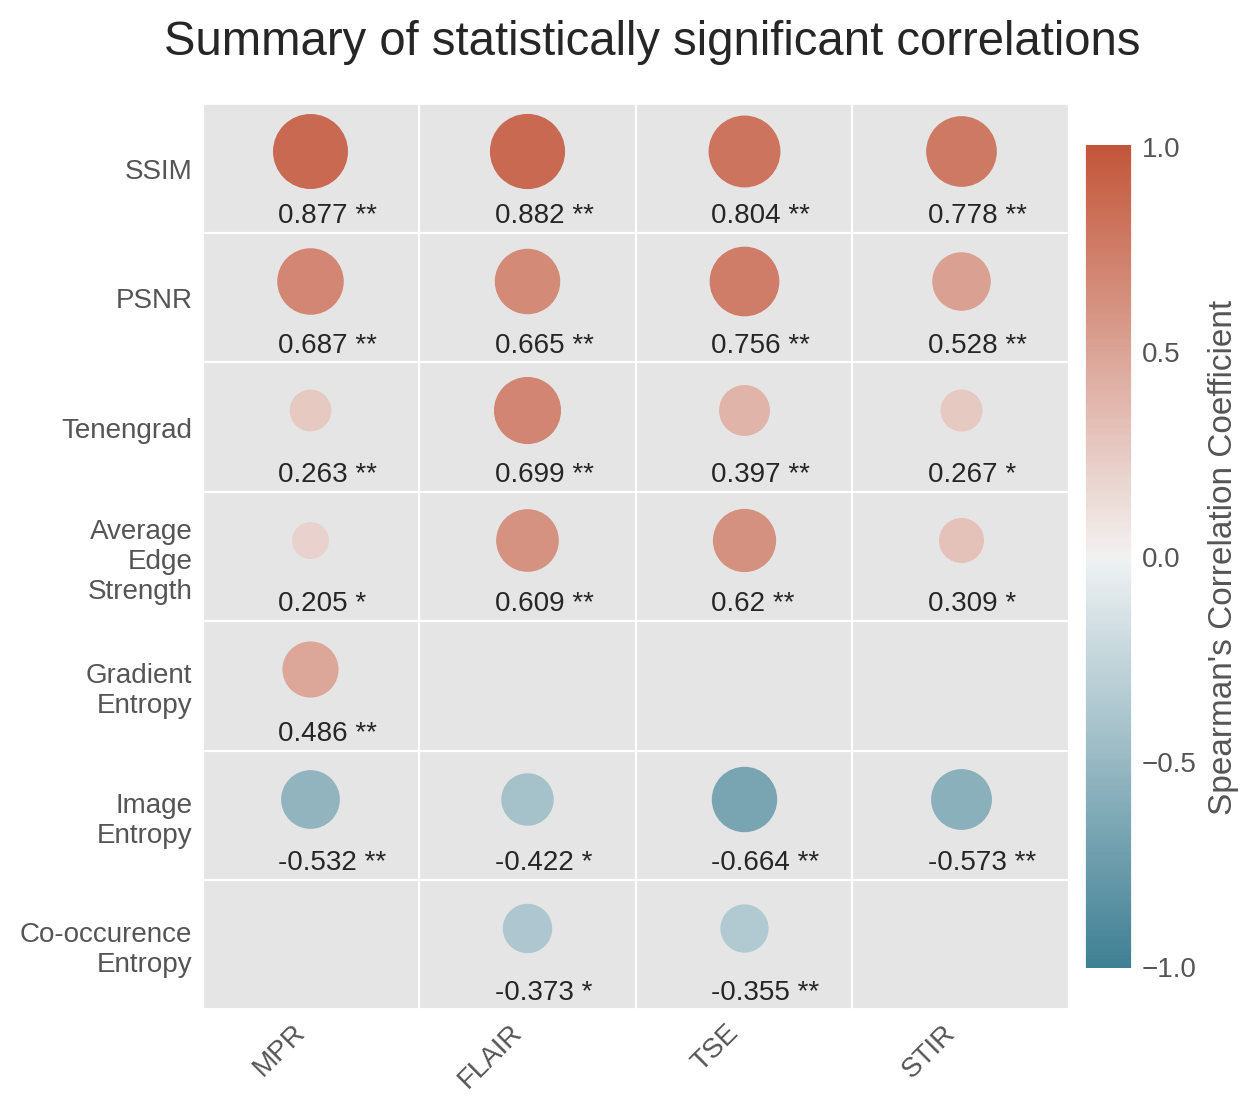
Figure 3: Overview table of Spearman’s correlation coefficients for the correlation of all image quality metrics with observer scores for all four sequences. Only statistically significant correlations are visualized (*: p<0.05, **: p<0.001). The size and color of the circles varies with the value of the correlation coefficient, which is shown below the circles.

Table 1: Image quality metrics for image $$$v$$$, if applicable in reference to image $$$\hat{v}$$$. $$$G_{(x,y,z)}$$$ denotes the gradient in x-, y- or z-direction and $$$E(v_{i,j}^{(k)})$$$ the binary mask of edges.