2058
Novel methods for correcting motion regression errors caused by global intensity changes in scans of cerebrovascular function1Cardiff University Brain Research Imaging Centre (CUBRIC), School of Physics and Astronomy, Cardiff University, Cardiff, United Kingdom, 2Max Planck Institute for Human Cognitive and Brain Sciences, Leipzig, Germany, 3Cardiff University Brain Research Imaging Centre (CUBRIC), School of Engineering, Cardiff University, Cardiff, United Kingdom
Synopsis
Previously we showed that when global intensity changes (GIC’s) are present in data (e.g., CO2 stimuli during measurement of CVR, ASL tagging), volume registration algorithms misrepresent such signal change as motion. Here we look at motion estimates derived from VRA’s, an external marker-less camera, and novel data-derived techniques, to evaluate if this problem can be overcome. We determined that in most cases where GIC’s are present, the use of an ICA in correction can improve erroneous results from VRA estimates. This isn’t the case in all scans however and the GIC causing this error should be removed prior to correction.
Introduction
Previously (ISMRM 20201), we highlighted an issue with conventional volume registration techniques used to correct motion in cerebrovascular function studies that induce global intensity changes (GICs) using CO2 stimuli and ASL tagging. We determined that these volume registration algorithms (VRA’s) evaluate GIC’s at edge voxels to be motion, thus causing relevant signal loss when motion parameters are regressed from the data. Here, we compare VRA-based and an external marker-less camera-based correction with novel techniques designed to limit the influence GICs on the estimated motion parameters.Methods
Image AcquisitionData were collected on a Siemens 3T MAGNETOM Prisma scanner with a 64-channel receiver head coil. The scanning protocol was:
· Multi-PLD pCASL (TR1,2=5.6/3.1s,TE=11ms, TI=250-3000ms in 250ms steps, α=90°,In-plane=3.4mm2, 20 slices(6mm)). Collected to quantify CBF. Expected TI ramp and ASL tagging to drive errors in VRA motion parameter estimate.
· Dual-excitation pCASL (TR=1.1/3.8s,TE=11/30ms, α=90°, In-plane=3.4mm2, 19 slices(6mm)). Collected to quantify CVR, CBF, OEF and CMRO2. Participants underwent periods of hypercapnia and hyperoxia. Expected CO2 increases to drive erroneous motion estimate in the BOLD portion and a mixture of ASL tagging and CO2 to drive error in ASL motion estimate.
· Breath Hold (TR=2s,TE=30ms,α=70°,In-plane=2mm2,64 slices(2mm)),TR=2s,TE=30ms, In-plane=2mm2 ,64 slices(2mm)). Collected to quantify CVR. Expected CO2 to drive errors in motion estimate although expected large amounts of motion to be present also.
· Resting-state (TR=2s,TE=30ms,α=70°,In-plane=2mm2, 64 slices(2mm)). Collected as a control without any GIC, connectivity measures were quantified. Expected motion estimates to perform in a similar way across all motion-correction methods.
· Resting-state with applied motion. The protocol was identical to the Resting-state. Participants were asked to move their head along with a predefined movement sequence. Collected to determine how well methods perform in severe motion conditions, connectivity values were quantified. Expected similar results to that of resting-state.
Camera Motion collection
The marker-less camera (TracInnovations, Denmark) acquired motion data throughout the scan by using infra-red light to create a ‘mesh’ on the face to track motion. This data was calibrated to the scanner coordinates using an MPRAGE to create final motion parameters.
Data Analysis
Estimates of motion were calculated in four groups of methods; VRA-based, camera-based, ICA-based, and Erosion-based. The VRA-based method used AFNI’s 3dAllineate2,3 to perform rigid-body volume registration and calculate motion parameters. The camera-based method estimated motion parameters using a marker-less system. The ICA-based method used an Independent Component Analysis4 and the theoretical signal expected to be caused by any CO2 or tagging induced global changes, to isolate and remove components related to these theoretical signals. Then a VRA was used to calculate motion parameters on the dataset stripped of the components containing these theoretical signals. The severity of removal was based on a correlation of the theoretical signal with each ICA component. In method 1 the ICA components that had p-values of statistical significance at p<0.05 (uncorrected) were removed, whereas in method 2 a Bonferroni correction accounted for multiple comparisons and statistically significant components were removed. The erosion-based method excluded voxels from the VRA using a whole brain mask which had been eroded (from the outer edge) by either 5mm or 20mm.
All analyses used linear regression with the motion parameters (from each correction type) as regressors from either the global signal (Fig 1), the theoretical GIC, hypothesised to drive the error in the VRA (Fig 2) or the VRA motion parameters (Fig 3). R2 values were calculated from each regression and paired t-tests were used to estimate the significance when compared to the VRA's R2 values.
Results
In Figure 1, the erosion methods showed R2 values consistent with that of the VRA estimate for most scans. The ICA methods displayed a lower R2 value than that of the VRA in most cases suggesting less signal is lost. For the Resting + CO2 scan, p-values of 2.2x10⁻⁴ and 1.6x10⁻⁴ were calculated for ICA method 1 and 2 respectively. In Figure 2, the ICA methods showed a lower R2 in all scan types with p-values of 2.1x10⁻⁴ and 5.8x10⁻³ (Resting + CO2) for method 1 and 2 respectively. The ICA methods showed lower R2 values in the Resting-state scan with p-values of 7.8x10⁻³ and 2.6x10⁻³ for method 1 and 2 respectively. In Figure 3, the erosion value of 20mm showed low values of R2 for some scans.Discussion
We’ve shown that the use of an ICA to remove signal pertaining to the GIC’s can lead to more accurate motion estimates containing less information concerning these GIC’s. However, in some cases this may not be enough and other methods should be incorporated to remove the GIC prior to correcting for motion, for example, in multi-PLD ASL scans where a TI ramp drives a global signal increase. The use of an eroded mask can in some cases aid this estimation of motion but in many scenarios, this can lead to erroneous results similar to VRA estimates. In the case of scans where no GIC’s are present one could argue that the VRA method is sufficient, however given that breath holding results in an increase in CO2, this could affect the reliability of VRA estimates and as such the ICA methods could aid in this estimation.Acknowledgements
This work was supported by Wellcome [WT200804]References
1 Beckerleg, R. A., Whittaker, J. R., Gallichan, D. & Murphy, K. in 2020 ISMRM & SMRT Virtual Conference & Exhibition.
2 RW, C. AFNI: software for analysis and visualization of functional magnetic resonance neuroimages. Comput Biomed Res 29(3), 162-173, doi:10.1006/cbmr.1996.0014 (1996).
3 Cox, R. & Hyde, J. Software tools for analysis and visualization of FMRI Data. NMR in Biomedicine 10, 171-178, doi:10.1002/(sici)1099-1492(199706/08)10:4/5<171::aid-nbm453>3.0.co;2-l (1997).
4 Beckmann, C. F. & Smith, S. M. Probabilistic independent component analysis for functional magnetic resonance imaging. IEEE Trans Med Imaging 23, 137-152, doi:10.1109/TMI.2003.822821 (2004).
Figures
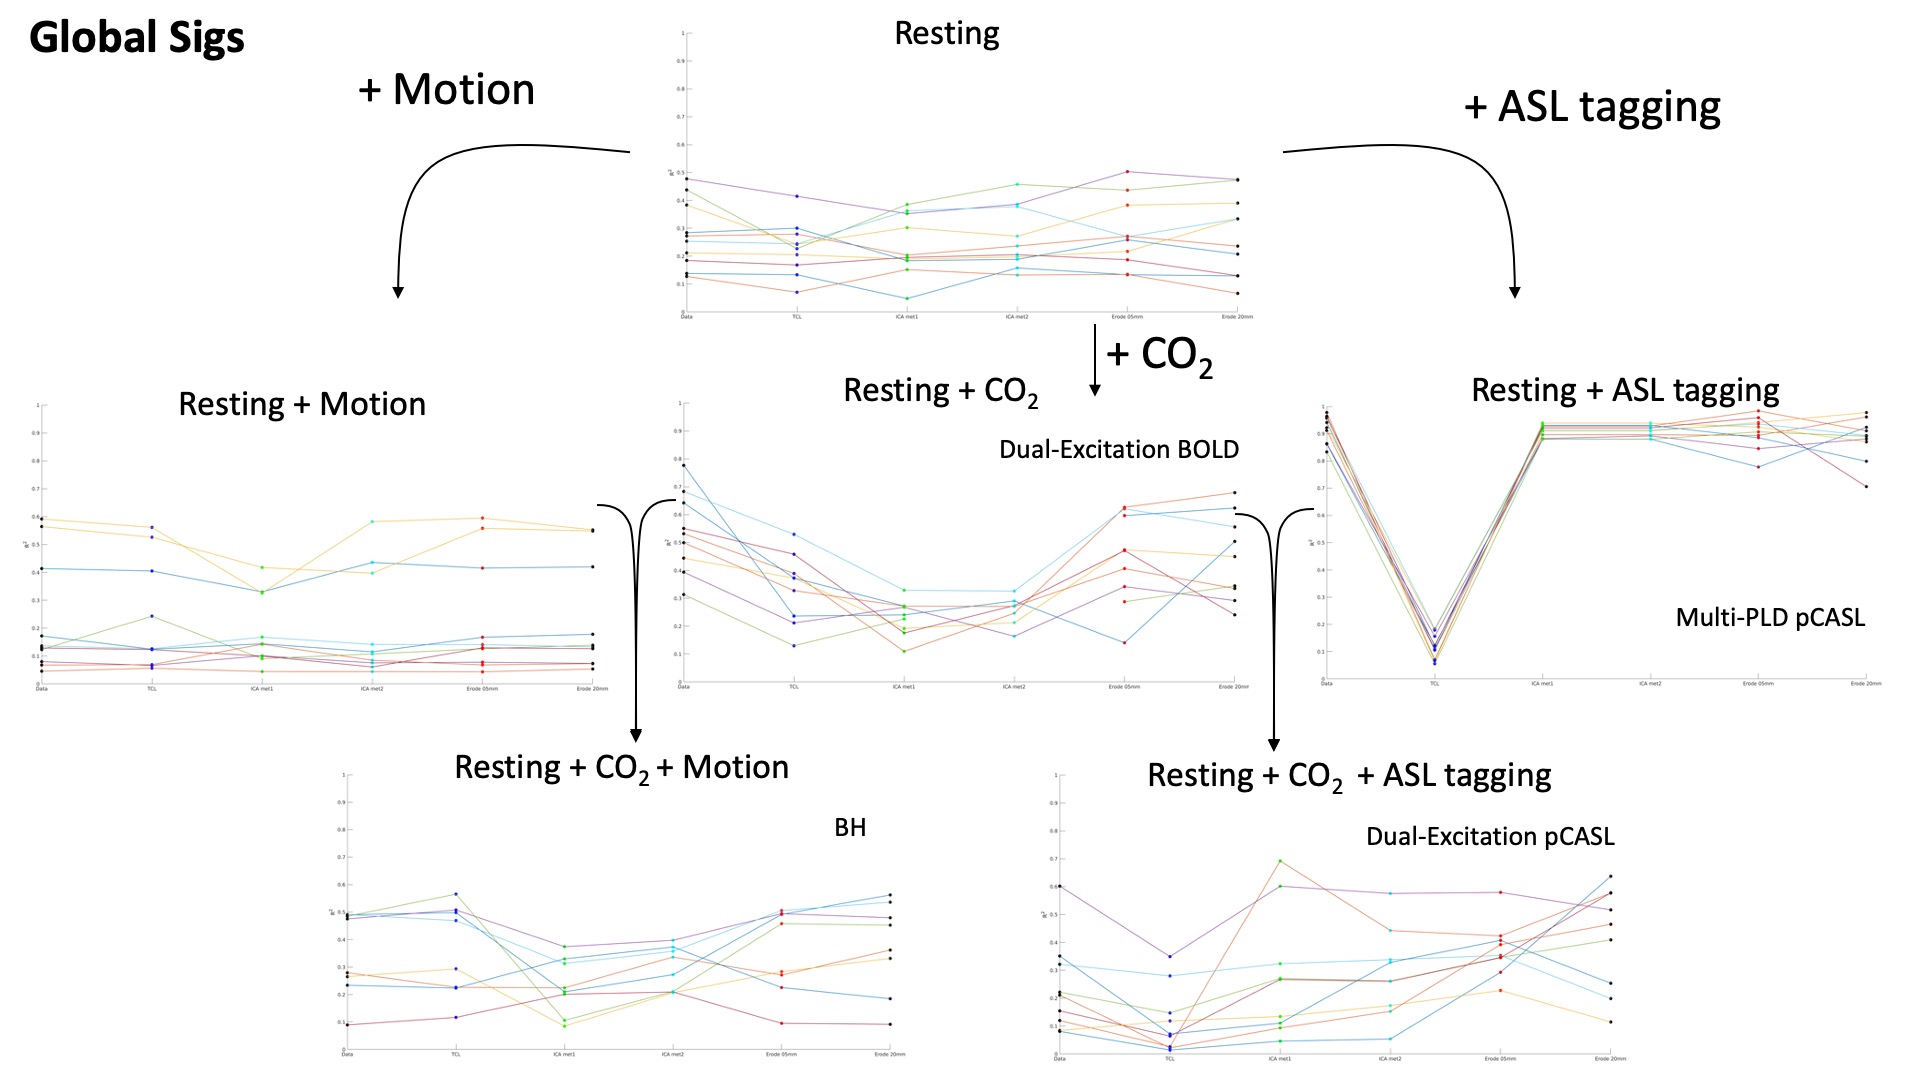
R2 variance values showing how much variance the motion parameters from each method could explain in the global signal (average over voxels). The lines connecting each method show the deviation between methods. At each step in the diagram the scan type can be associated with a resting scan by the added intensity change.
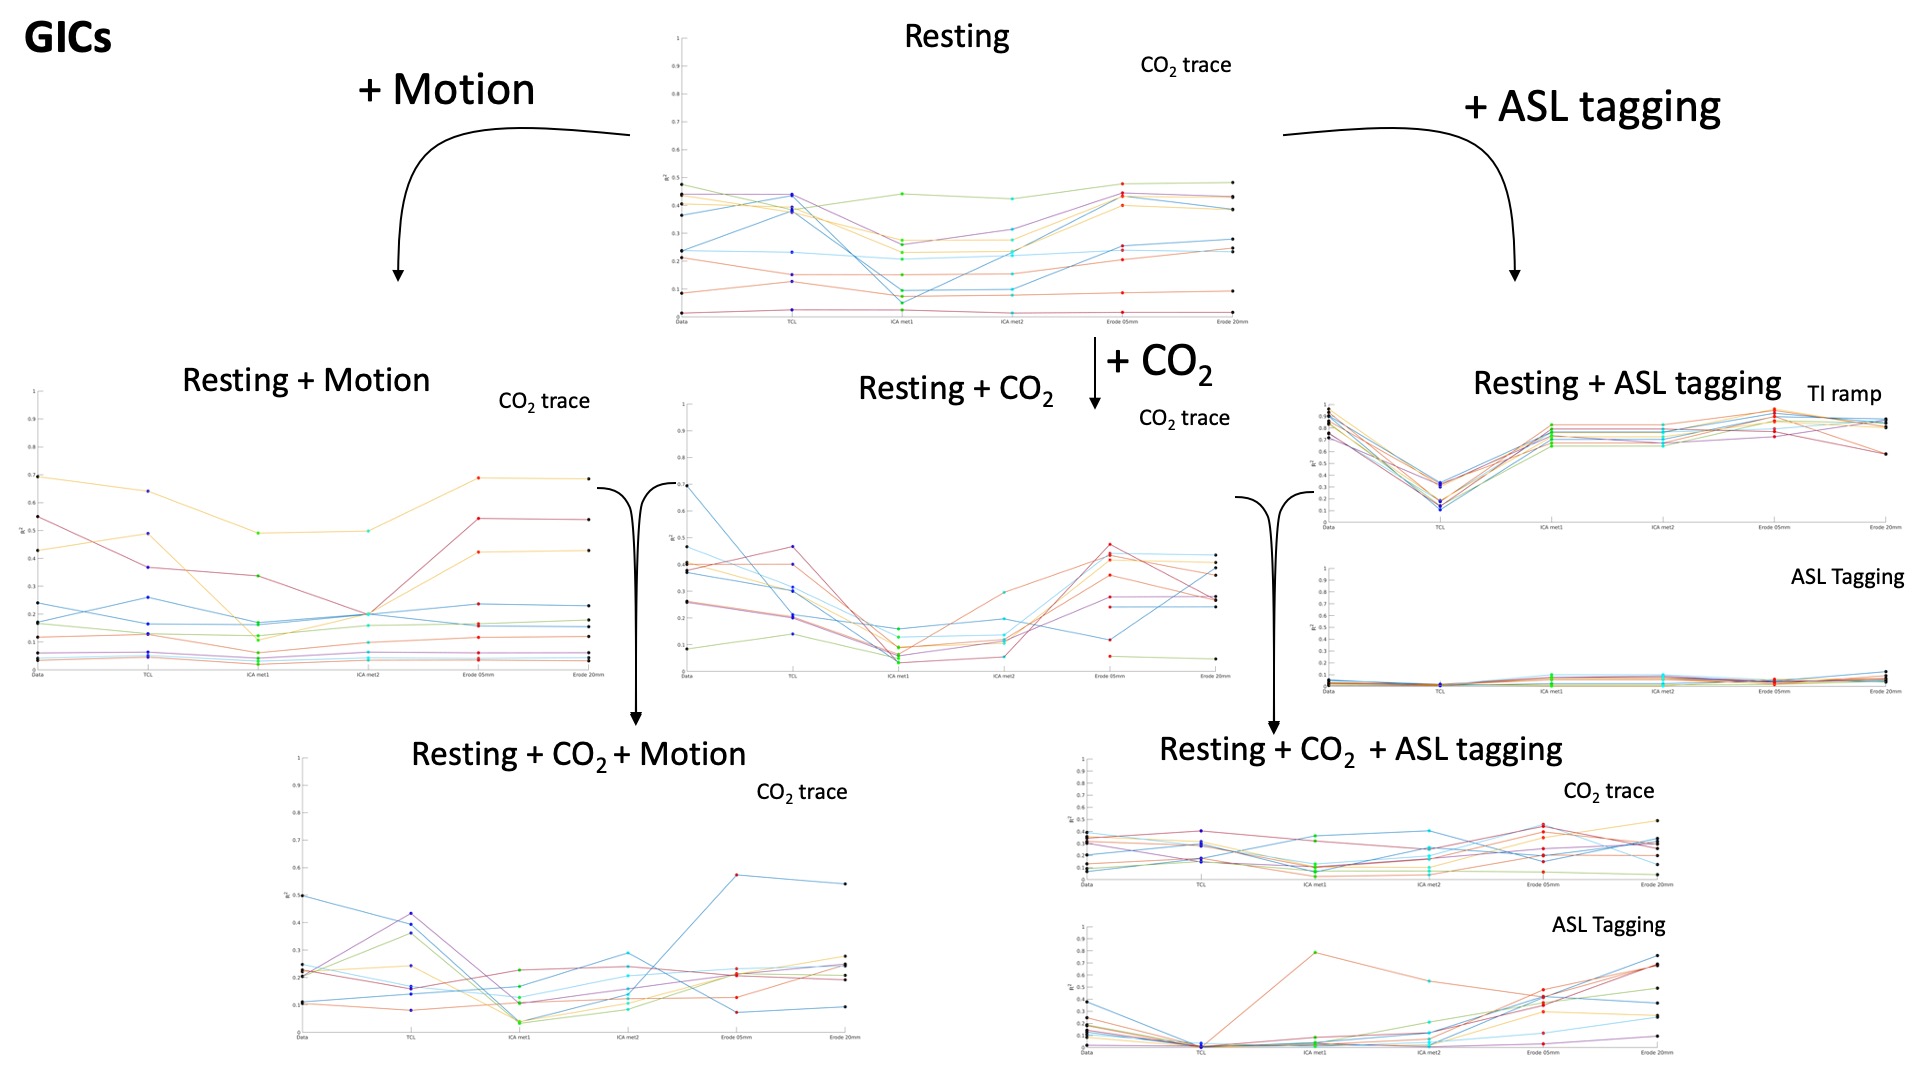
R2 variance values showing how much variance the motion parameters from each method could explain in the theoretical signal expected to be caused by any CO2 or tagging induced global changes. The lines connecting each method show the deviation between methods. At each step in the diagram the scan type can be associated with a resting scan by the added intensity change.
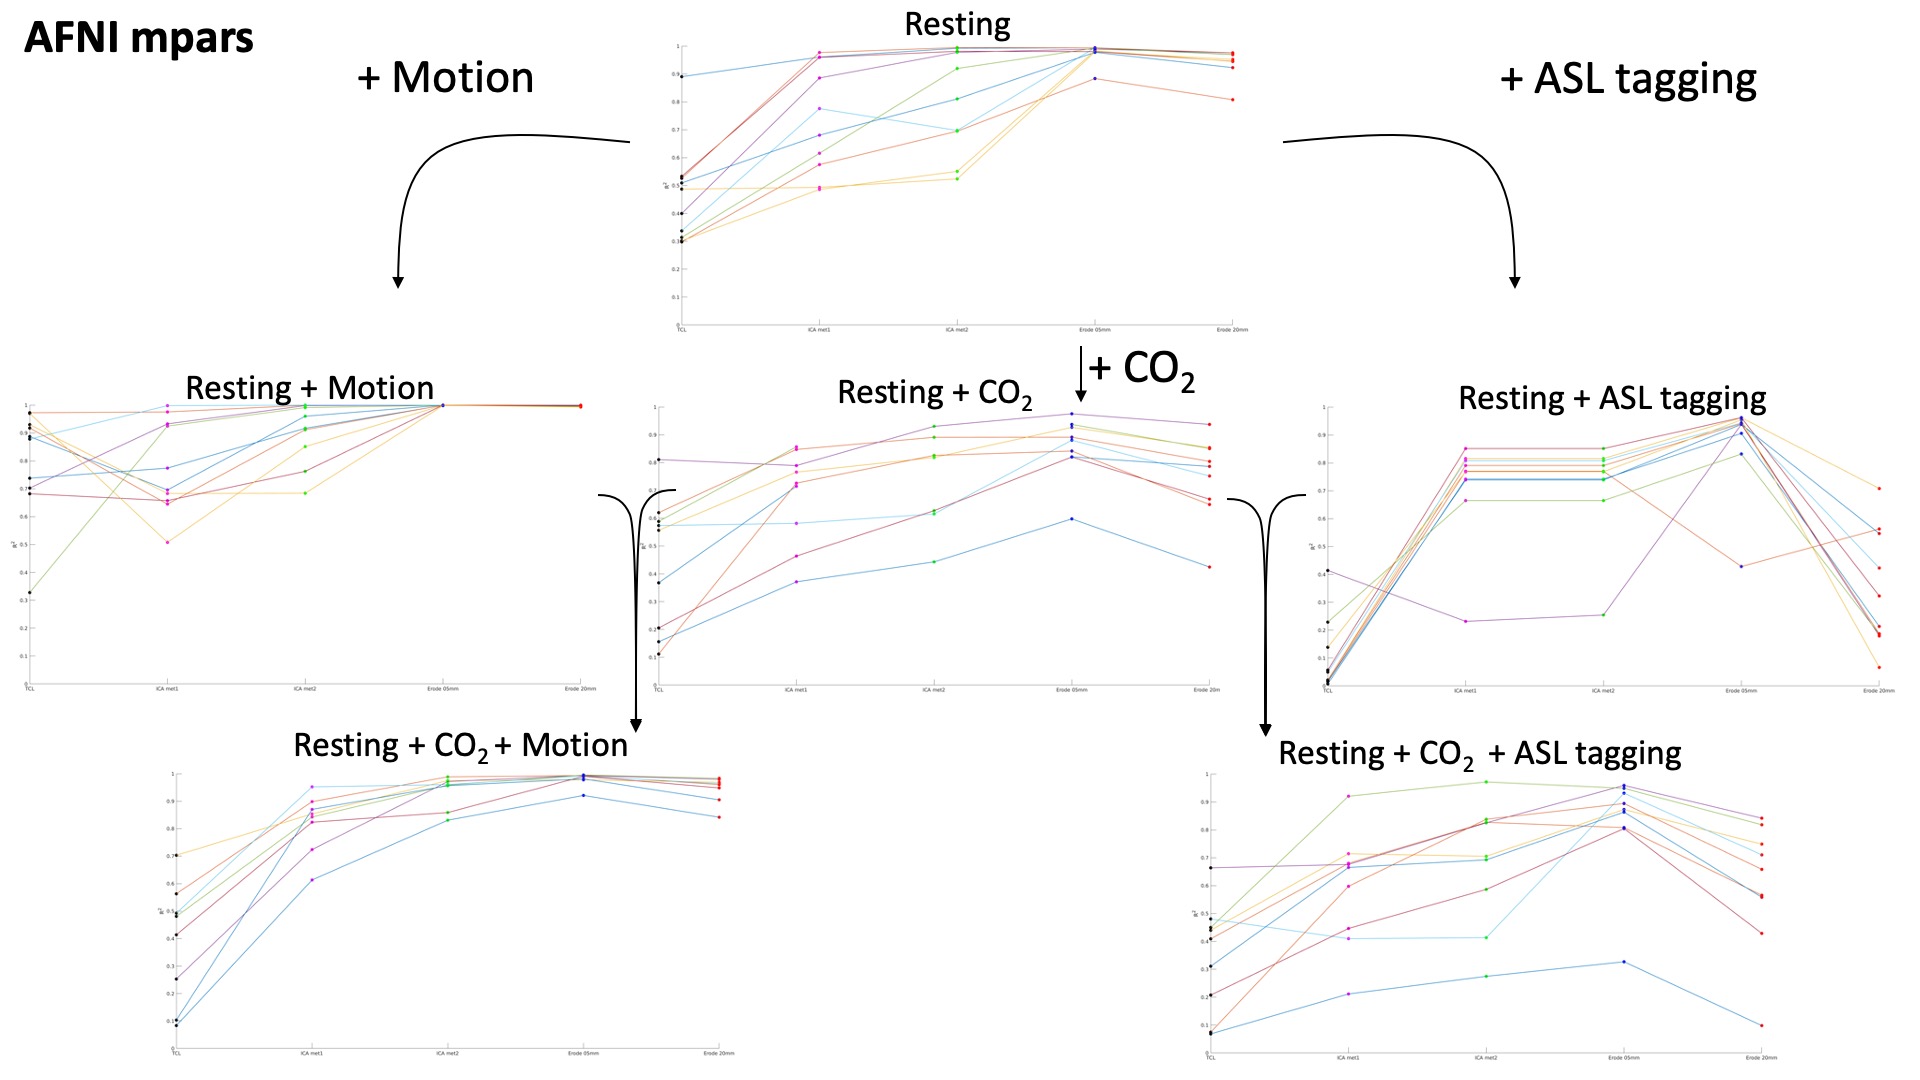
R2 variance values showing how much variance the motion parameters from each method could explain in the motion parameter estimate from the volume registration. The lines connecting each method show the deviation between methods. At each step in the diagram the scan type can be associated with a resting scan by the added intensity change.