2055
A deep learning image based calibration model to predict motion using auxiliary sensors1CAI2R, NYU School of Medicine, New York, NY, United States, 2Siemens Medical Solutions USA, New York, NY, United States
Synopsis
For MRI hindered by motion artifacts sensors are able to provide a surrogate for bulk motion, but may not be tissue specific. In this work, we use deep learning to build a motion model with an auxiliary pilot tone sensor during a fast-image calibration step. A neural network is used to learn the correlation between the pilot tone signal and the pixel-wise liver displacement which is predicted using an automatic segmentation model. The motion model is used to predict displacement on low frame rate images, thus offering the opportunity to perform motion resolved reconstruction.
Introduction
Due to its low frame rate, MRI can be hindered by physiological motion, especially in the chest and abdomen, resulting in blurry images and other artifacts. Besides an uncomfortable breath hold, other motion correction techniques using auxiliary sensors such as respiratory belts, optical cameras and the pilot tone have been shown to have efficacy1. While these sensors are able to provide a surrogate for approximating relative motion, these signals typically represent macro motion that may not directly represent motion of a particular tissue of interest. Correlating auxiliary signals with local motion during a fast image-based calibration step can potentially overcome this gap. To demonstrate this concept, we use deep learning to correlate a pilot tone signal with pixel-wise liver displacement that is measured directly in high frame rate images. This tissue- and subject-specific model is then applied to reduce motion artifacts in low frame rate liver images.Methods
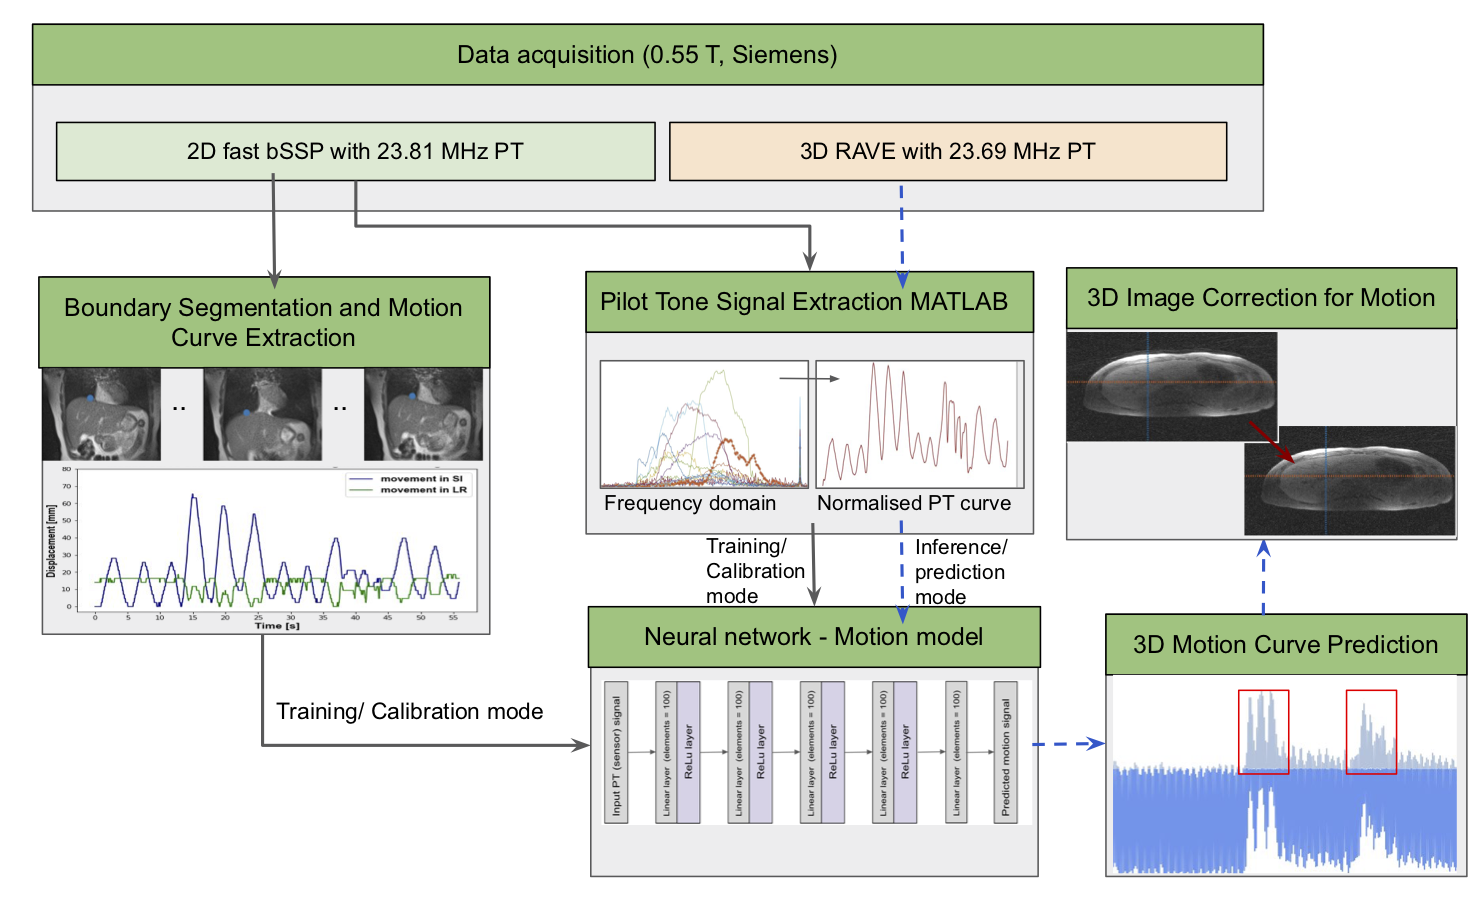
Data acquisition: 3 healthy volunteers were recruited and free-breathing liver images were acquired on a commercial MRI system (1.5T MAGNETOM Aera; Siemens Healthcare, Erlangen, Germany) modified to operate at 0.55T with 23.59 MHz center frequency. In this study, we used the pilot tone (PT) as an auxiliary sensor. To build the motion model, concurrent PT (23.81 MHz) and single-slice images with high temporal resolution (frame rate = 17.69/s) were acquired with an in-house 2D bSSFP sequence (TR=2.26ms, TE = 1.13ms matrix size = 128 x 128, 2.34mm in-plane resolution). The model was utilized to predict and correct motion in a typical abdominal acquisition in which high temporal resolution is not feasible: 6 min 3D RAVE (TR=3.57ms, TE = 1.69ms matrix size = 256 x 256, slice thickness = 5mm, 1.56mm in-plane resolution) with concurrent PT (23.69 MHz). During both scans, volunteers were instructed to breathe deeply, normally or cough.Automatic liver tracking and motion curve extraction: A 2D U‐Net (Dice loss, Adam optimizer, learning rate = 1e−4, batch size = 10) was trained to identify the upper liver adjacent to the lungs in order to directly track liver motion in 2D bSSFP images2 . A 70-20-10% split was used for training-testing-validation. Network predicted segmentations were post-processed to fill holes and extract the biggest connected component. Dice similarity scores were calculated on the test set to show reliability of the segmentation. After predicting the liver-lung boundary using the network, a motion curve was extracted for each patient by identifying the median pixel location along the boundary.
Pilot-tone signal extraction: All MRI data processing and reconstruction was performed using MATLAB (MathWorks, Natick, MA). The PT signal was detected and separated from the raw MRI data using a peak detection algorithm in the frequency domain. For consistency among all experiments, the SOBI algorithm was applied to the PT amplitude signal encoded by a selected receive coil to isolate that representing respiratory motion3.
Motion model development: A neural network (Figure 1) with 5 linear layers (100 elements), followed by a ReLu activation layer (MSE loss, Adam optimizer, LR=0.001) was trained to predict superior-inferior liver motion from the extracted PT signal4.
Image reconstruction:The trained image-based model was then used to predict the motion curve during a 6 min 3D RAVE sequence. We demonstrate the technique in a selected 50 s window by reconstructing images with and without k-space lines that were predicted to correspond to greater than 30 mm liver displacement. Reconstruction was performed in MATLAB using the Fessler and Sutton NUFFT toolbox5. A complete schematic of the processing pipeline is shown in figure 1.
Results
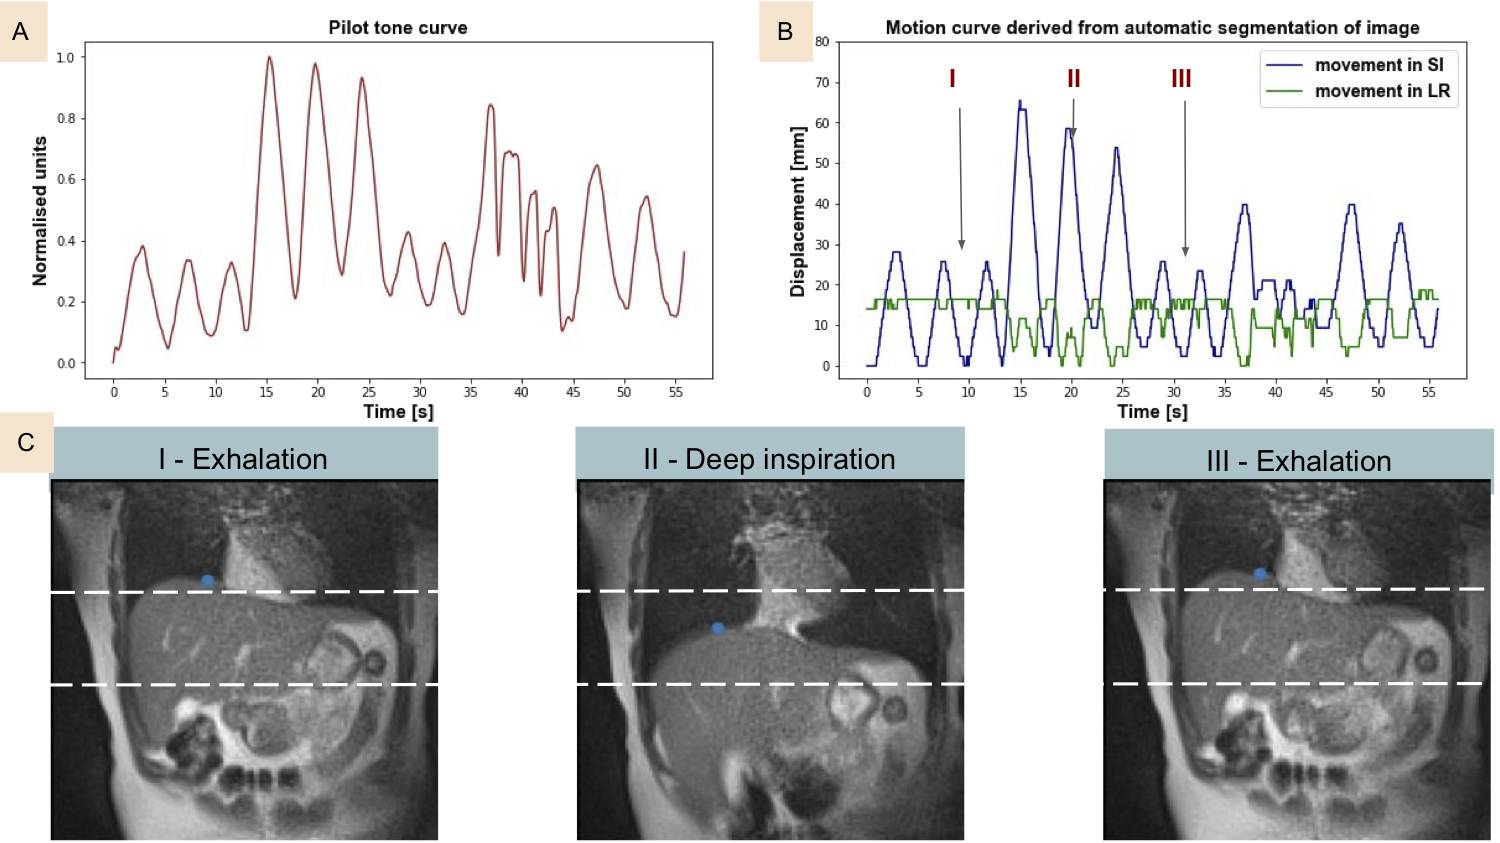
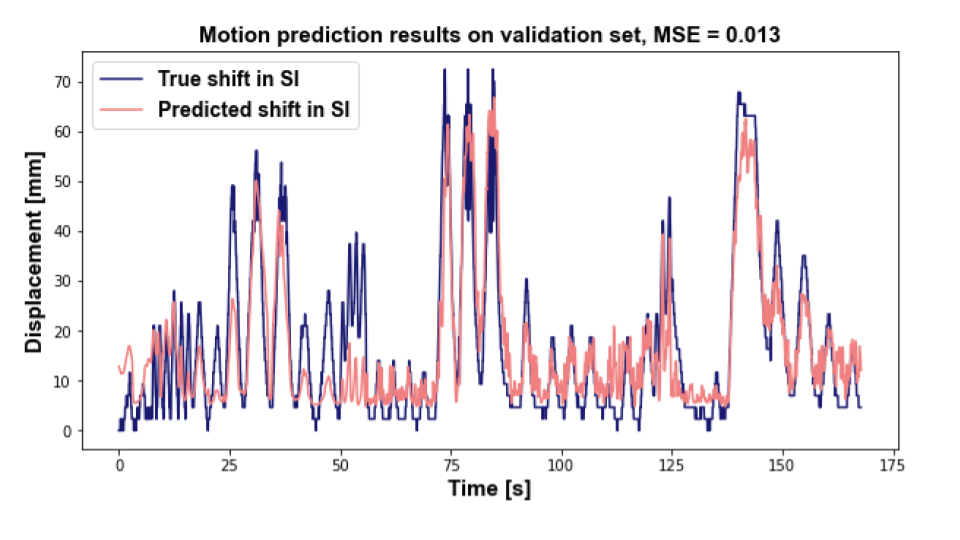
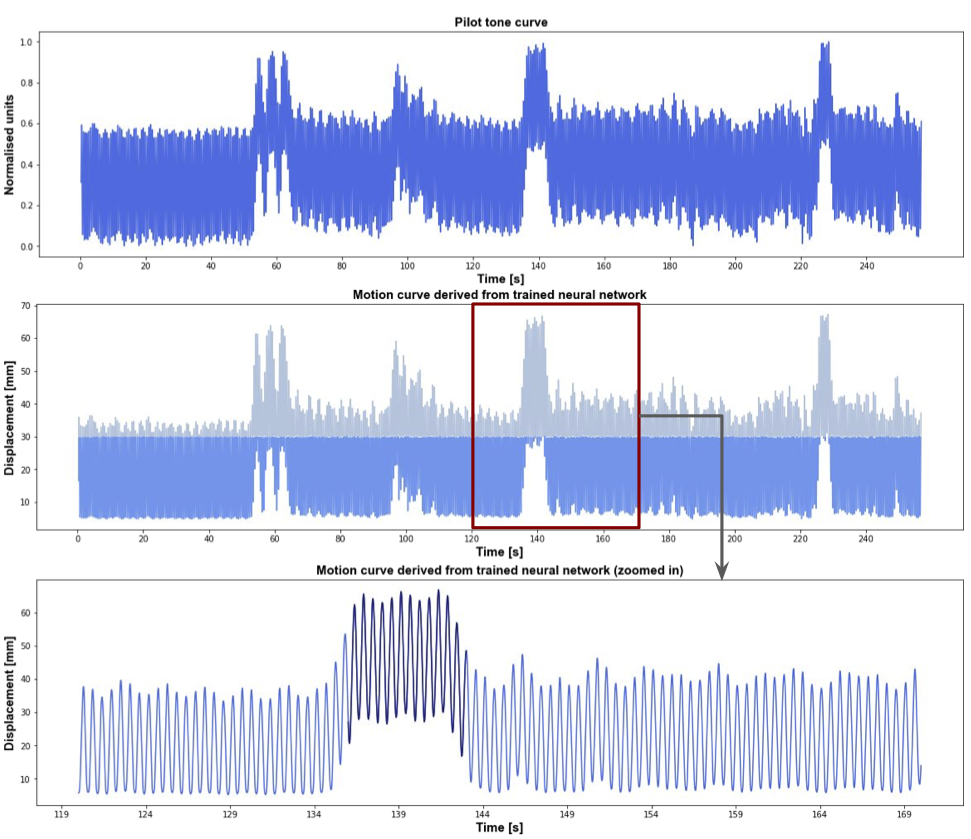
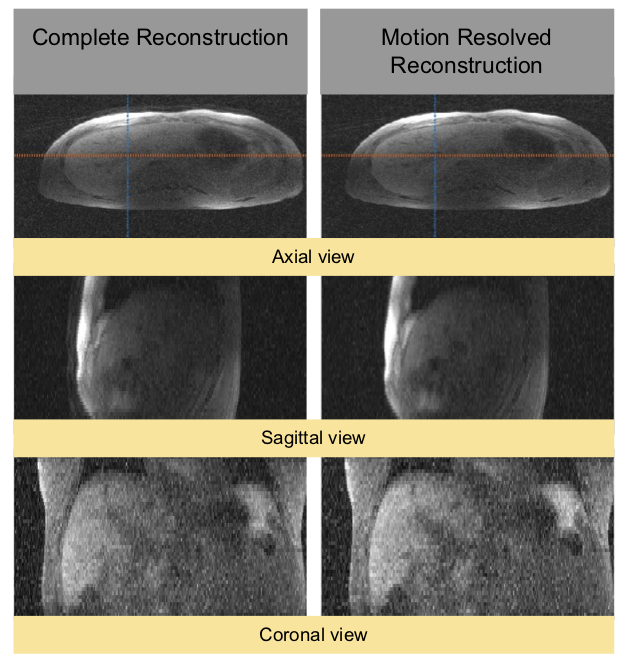
For the upper liver segmentation, the test set average dice=0.93. Figure 2 shows an example of the derived PT signal (A), the motion curve derived from the liver-lung boundary (B), and the automatic liver-lung boundary prediction at three time points (C). True and predicted motion displacement curves on the validation set are shown in figure 3 (MSE=0.013). Figure 4 shows the derived PT during the 3D RAVE sequence (top), the predicted liver motion curve (middle), the predicted curve between 120 and 170 s highlighting high liver motion in dark blue (bottom). As a preliminary demonstration, figure 5 shows the reconstructed image from all k-space lines shown in figure 4 (bottom) contrasted with an image in which the dark blue lines were removed to reduce the impact of large motion in all three planes. Reduced streaking and blurring artifacts, clearer boundaries and sharper vessels are observed after motion correction.Discussion
The generalizable development of this work focuses on modeling auxiliary sensor signals on tissue-specific motion, wherein displacement is estimated directly in high frame rate images. While we demonstrated this concept by using a PT signal to predict liver motion, it can in principle be applied flexibly to a range of tissues. However, given the high level of correlation observed between PT and liver displacement, additional investigation is warranted for other tissue-sensor combinations. A larger cohort is needed to build and incorporate more robust and flexible models since this study was limited to motion in 3 subjects only.Conclusion
Deep learning based motion model calibration improves the possibility of using auxiliary sensors to resolve motion.Acknowledgements
The authors thank Leanna Pancoast, Douglas Bratner and all the other members of the RF team for insightful discussions. This work was partially supported by National Institutes of Health grants R21CA213169, R01DK106292, R21AG061579, R01DK114428, and R21EB027263 and was performed under the rubric of the Center for Advanced Imaging Innovation and Research (CAI2R, www.cai2r.net) at the New York University School of Medicine, which is an NIBIB Biomedical Technology Resource Center (NIH P41 EB017183).References
1. Marques, José P., Frank FJ Simonis, and Andrew G. Webb. "Low‐field MRI: An MR physics perspective." Journal of magnetic resonance imaging 49.6 (2019): 1528-1542.
2. Ronneberger, Olaf, Philipp Fischer, and Thomas Brox. "U-net: Convolutional networks for biomedical image segmentation." International Conference on Medical image computing and computer-assisted intervention. Springer, Cham, 2015.
3. Solomon E, Rigie DS, Vahle T, et al. Free-breathing radial imaging using a pilot-tone radiofrequency transmitter for detection of respiratory motion. Magn Reson Med. 2021;85:2672– 2685
4. Fawaz, Hassan Ismail, et al. "Deep learning for time series classification: a review." Data mining and knowledge discovery 33.4 (2019): 917-963.
5. Fessler JA, Sutton BP. Nonuniform fast Fourier transforms using min-max interpolation. IEEE Trans Signal Process. 2003;51:560-574.
Figures