2052
Myelination patterns support the last-in-first-out and gain-predicts-loss paradigms in normative aging1Magnetic Resonance Physics of Aging and Dementia Unit, National Institute on Aging, Baltimore, MD, United States
Synopsis
Using myelin water fraction (MWF), a proxy of myelin content, and diffusion tensor imaging (DTI) indices, we investigated the retrogenesis paradigm in a large cohort of cognitively unimpaired participants spanning a wide age range. Specifically, we assessed the last-in-first-out and gain-predicts-loss hypotheses, describing trends of tissue degeneration across cerebral regions and comparing maturation and degeneration rates within regions. Our MWF results support the last-in-first-out hypothesis, indicating that posterior regions are generally spared from degeneration compared to anterior regions, as well the gain-predicts-loss paradigm, suggesting that the regional maturation and degeneration rates were approximately symmetric.
Introduction
Evidence suggests that early maturating cerebral structures, such as the posterior regions, are spared from neurodegeneration as compared to the late maturating structures, such as the anterior regions; this is known as the retrogenesis paradigm (1, 2). Pioneering work by Bartzokis and colleagues has indicated that, unlike heavily myelinated white matter (WM) structures, late-myelinated WM structures are the earliest and most affected in Alzheimer’s disease, while concomitant damage to these fibers increases susceptibility to amyloid-β and iron accumulations (3-6). The retrogenesis paradigm consists of two major hypotheses, the last-in-first-out hypothesis, and the gain-predicts-loss hypothesis. The former suggests that slowly developing brain structures are the most vulnerable to neurodegeneration, while the latter postulates that the maturation rate during neurodevelopment and the degeneration rate at older age are equal. Therefore, knowledge of a tissue state in adulthood should predict the tissue state at a symmetric age post-peak. While emerging MRI evidence supports this paradigm, these studies used nonspecific quantitative MRI techniques (1, 7, 8). Here, we investigate the retrogenesis paradigm using myelin water fraction (MWF), a direct and specific measure of myelin content (9-10), as well as diffusion tensor imaging (DTI) indices, sensitive measures of myelin content and axonal density in WM. Our study is conducted on a large cohort of well-documented cognitively normal subjects spanning a wide age range.Methods
Study cohort and data acquisitionThe study cohort consisted of 147 subjects (53.7±21.2 years, 63 women) spanning the age range between 21 and 94 years. All subjects underwent the BMC-mcDESPOT imaging protocol for MWF imaging (11-13). Among them, 132 (52.4±21 years, 58 women) have also undergone our DTI imaging protocol for fractional anisotropy (FA), mean diffusivity (MD), radial diffusivity (RD) and axial diffusivity (AxD) imaging.
Image processing
For each subject, a whole-brain MWF map was generated using the BMC-mcDESPOT analysis (11-13). Furthermore, whole-brain FA, RD, MD, and AxD maps were calculated from the eigenvalues derived from the corresponding DTI dataset using FSL (14). All derived parameter maps were nonlinearly registered to the MNI atlas using FSL (14). Finally, fourteen cerebral WM regions-of-interest (ROIs) were defined from MNI.
Statistical analyses
First, the age at maximum or minimum of each parameter in each ROI was calculated. We then fit the data to a piecewise linear model, as describe in (7), with two segments corresponding to the maturation and degeneration phases with the point of transition defined as the peak age. The absolute values of the slopes of these two segments, the rates of maturation and degeneration, were then statistically compared in each ROI.
Results & Discussion
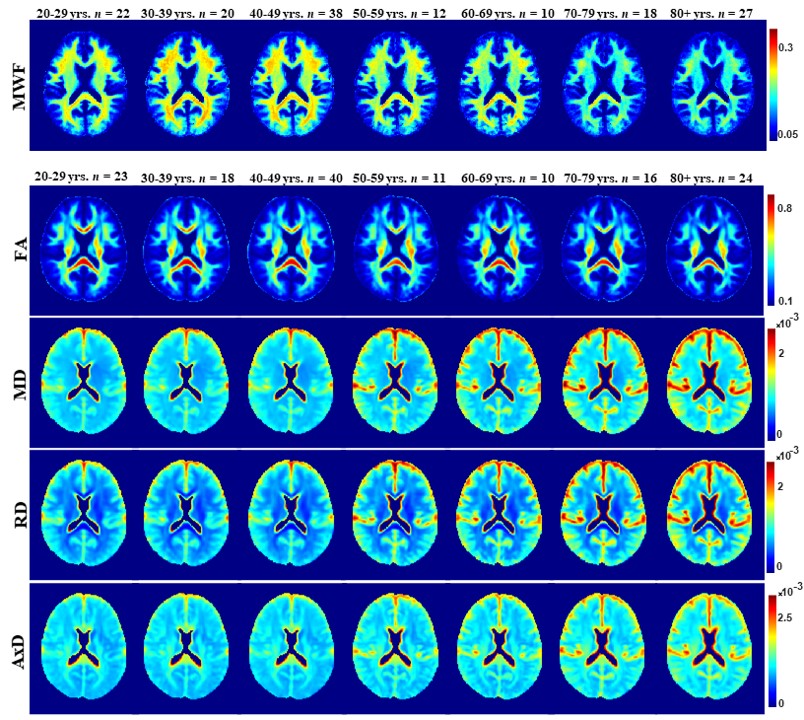
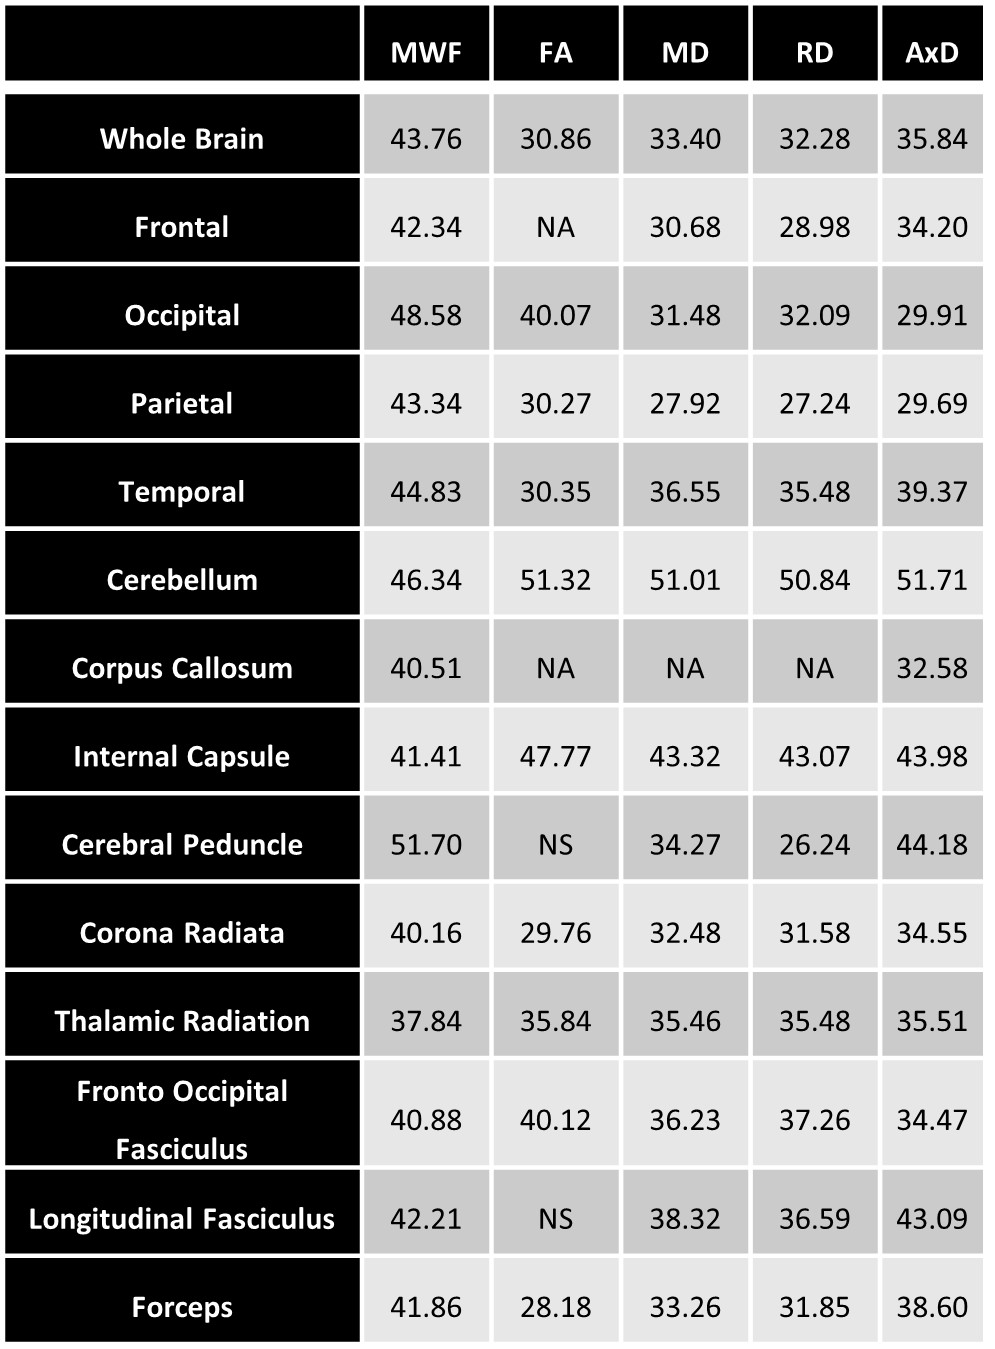
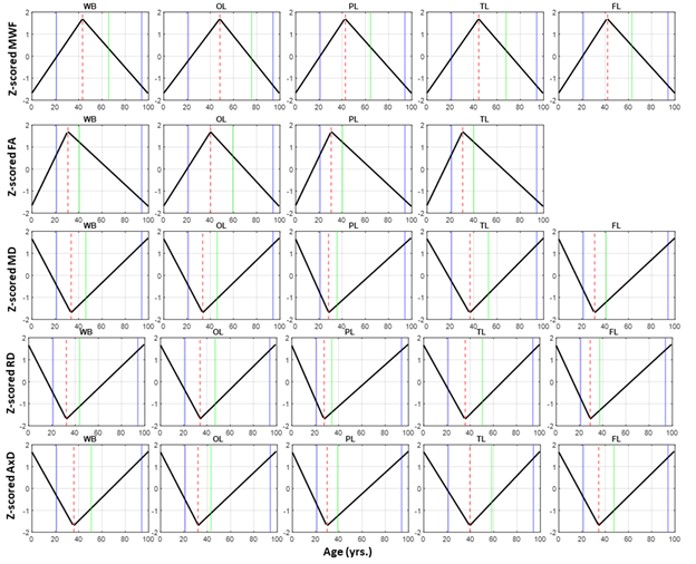
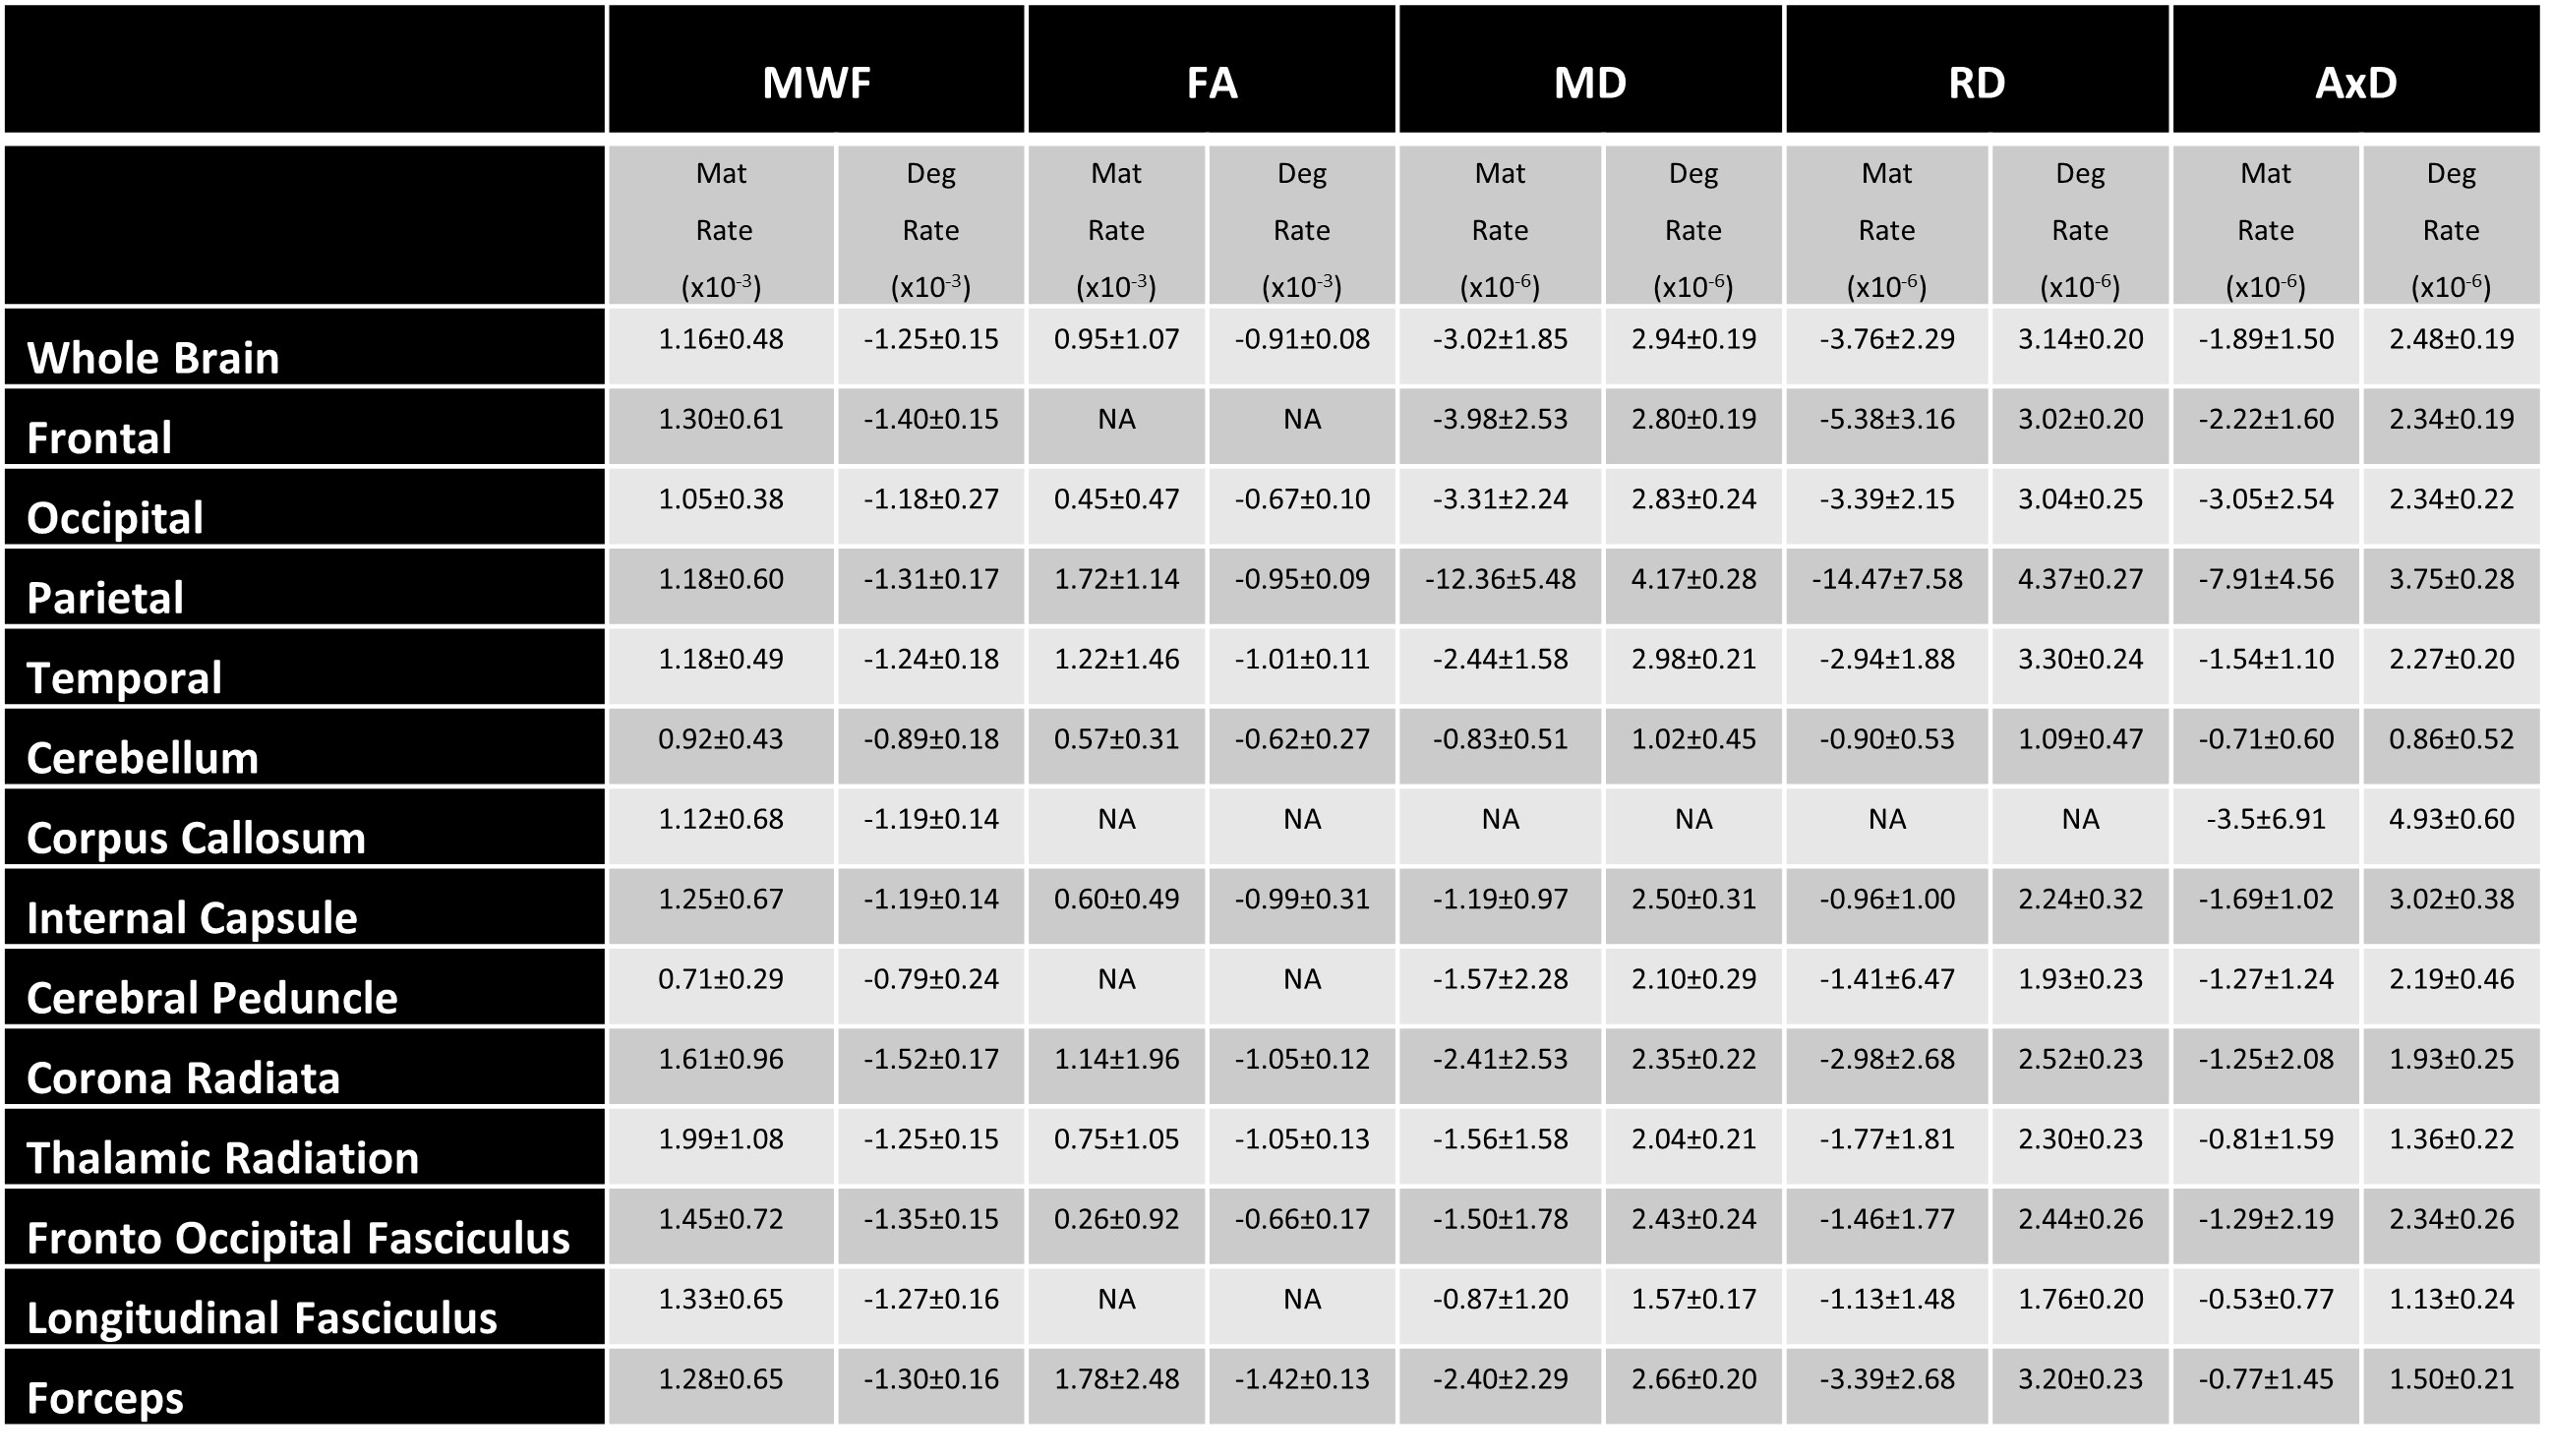
Figure 1 illustrates the regional differences in MWF and DTI indices in each age decade across the adult lifespan. Visual inspection shows that there is significant contrast across the lifespan, notably, MWF increases into middle age (40 to 50 years) then decreases with advanced age. DTI indices, however, show an earlier peak age, with FA decreasing and MD, RD, and AxD increasing earlier in the adult lifespan. Figure 2 provides the values of the peak age of each metric in each ROI, used to investigate the last-in-first-out hypothesis. These results indicate that the posterior regions such as the occipital lobe and cerebellum generally peak at later ages compared to anterior regions such as the frontal lobes. This provides support for this hypothesis, which is consistent with prior studies comparing degeneration of anterior regions to posterior regions (1, 2, 15, 16).Figure 3 shows plots of the maturation and degeneration phases for five representative WM regions in each parameter studied as a function of age. Visual inspection indicates that for MWF, the maturation and degeneration phases appear near-symmetrical, while this is less consistent in DTI indices. Figure 4 provides the maturation and degeneration rates for all fourteen WM regions investigated, with standard errors (SEs). No significant differences were found between the maturation and degeneration rates of any metric within any ROI. Indeed, MWF exhibits temporal symmetry supporting the gain-predicts-loss hypothesis of tissue maturation and degeneration in WM. We interpret this novel result as indicating that maturation and degeneration of myelin sheets occur in a more temporally symmetric fashion. This agrees with previous studies that used sensitive but nonspecific measures of myelin content, including longitudinal relaxation rates and diffusion metrics (7, 8). Interestingly, this was, overall, not the case for the DTI indices for which the degenerative phase occurred more rapidly than the maturation phase. The DTI indices, as indicated above, reached the maximum maturation at earlier ages when compared to MWF. Therefore, assessing the gain-predicts-loss paradigm in this context is unreliable given the limited data points in the maturation phase, as reflected by the large SEs in derived rates.
Conclusion
Using a uniquely large, well-characterized cohort of cognitively unimpaired adults, we demonstrated support for the retrogenesis paradigm. Our results indicate that the anterior WM regions are more susceptible to degeneration as compared to the posterior regions, and that the maturation and degeneration rates of myelin sheets within a region are approximately equal. If confirmed, the MWF model will guide early interventions as it suggests that knowledge of a tissue state in early adulthood should predict the tissue state at a symmetric age post-peak.Acknowledgements
This work was supported by the Intramural Research Program of the National Institute on Aging of the National Institutes of Health.
References
1. Brickman AM, Meier IB, Korgaonkar MS, Provenzano FA, Grieve SM, Siedlecki KL, et al. Testing the white matter retrogenesis hypothesis of cognitive aging. Neurobiology of aging. 2012;33(8):1699-715.
2. Raz N. Aging of the brain and its impact on cognitive performance: Integration of structural and functional findings. The handbook of aging and cognition, 2nd ed. Mahwah, NJ, US: Lawrence Erlbaum Associates Publishers; 2000. p. 1-90.
3. Bartzokis G. Age-related myelin breakdown: a developmental model of cognitive decline and Alzheimer's disease. Neurobiology of aging. 2004;25(1):5-18; author reply 49-62.
4. Bartzokis G, Cummings JL, Sultzer D, Henderson VW, Nuechterlein KH, Mintz J. White Matter Structural Integrity in Healthy Aging Adults and Patients With Alzheimer Disease: A Magnetic Resonance Imaging Study. Archives of neurology. 2003;60(3):393-8.
5. Bartzokis G, Lu PH, Mintz J. Human brain myelination and amyloid beta deposition in Alzheimer's disease. Alzheimer's & dementia : the journal of the Alzheimer's Association. 2007;3(2):122-5.
6. Bartzokis G, Lu PH, Tingus K, Mendez MF, Richard A, Peters DG, et al. Lifespan trajectory of myelin integrity and maximum motor speed. Neurobiology of aging. 2010;31(9):1554-62.
7. Yeatman JD, Wandell BA, Mezer AA. Lifespan maturation and degeneration of human brain white matter. Nature communications. 2014;5:4932-.
8. Slater DA, Melie-Garcia L, Preisig M, Kherif F, Lutti A, Draganski B. Evolution of white matter tract microstructure across the life span. Human brain mapping. 2019;40(7):2252-68.
9. Laule C, Leung E, Lis DK, Traboulsee AL, Paty DW, MacKay AL, et al. Myelin water imaging in multiple sclerosis: quantitative correlations with histopathology. Multiple sclerosis (Houndmills, Basingstoke, England). 2006;12(6):747-53.
10. MacKay AL, Laule C. Magnetic Resonance of Myelin Water: An in vivo Marker for Myelin. Brain Plasticity. 2016;2(1):71-91.
11. Bouhrara M, Spencer RG. Incorporation of nonzero echo times in the SPGR and bSSFP signal models used in mcDESPOT. Magnetic resonance in medicine. 2015;74(5):1227-35.
12. Bouhrara M, Spencer RG. Improved determination of the myelin water fraction in human brain using magnetic resonance imaging through Bayesian analysis of mcDESPOT. NeuroImage. 2016;127:456-71.
13. Bouhrara M, Spencer RG. Rapid simultaneous high-resolution mapping of myelin water fraction and relaxation times in human brain using BMC-mcDESPOT. NeuroImage. 2017;147:800-11.
14. Jenkinson M, Beckmann CF, Behrens TE, Woolrich MW, Smith SM. FSL. NeuroImage. 2012;62(2):782-90.
15. Stricker NH, Schweinsburg BC, Delano-Wood L, Wierenga CE, Bangen KJ, Haaland KY, et al. Decreased white matter integrity in late-myelinating fiber pathways in Alzheimer's disease supports retrogenesis. NeuroImage. 2009;45(1):10-6.
16. Bender AR, Völkle MC, Raz N. Differential aging of cerebral white matter in middle-aged and older adults: A seven-year follow-up. NeuroImage. 2016;125:74-83.
Figures