2051
Redefining Access to High-Value MRI: Results from the CAMERA MRI in Africa Needs Assessment Survey1Perelman School of Medicine, University of Pennsylvania, Philadelphia, PA, United States, 2Lawson Health Research Institute, London, ON, Canada, 3Mbarara University of Science and Technology, Mbarara, Uganda, 4Crestview Radiology Ltd, Lagos, Nigeria, 5Department of Medical Biophysics, Western University, London, ON, Canada, 6Department of Radiology and Nuclear Medicine, Amsterdam Neuroscience, Amsterdam University Medical Center, Amsterdam, Netherlands, 7Department of Computer Science, University College London, London, United Kingdom, 8Central Hospital of Maputo, Maputo, Mozambique, 9Department of Bioengineering, Instituto Superior, Técnico, Universidade de Lisboa, Lisbon, Portugal, 10Department of Radiology and Imaging Sciences, Emory University, Atlanta, GA, United States, 11Department of Radiology, University of Michigan, Ann Arbor, MI, United States, 12Department of Radiology, Leiden University Medical Center, Leiden, Netherlands, 13Clinical Imaging Sciences Centre, Department of Neuroscience, University of Sussex, Brighton, United Kingdom, 14Department of Biomedical Engineering, Rochester Institute of Technology, Rochester, NY, United States, 15Department of Radiology, Aga Khan University Hospital, Nairobi, Kenya, 16Department of Oncology, Guy’s & St Thomas’ Hospital, London, United Kingdom, 17Department of Radiology, University College Hospital Ibadan, Ibadan, Nigeria, 18Department of Neurology and Neurosurgery, Montreal Neurological Institute, McGill University, Montreal, QC, Canada
Synopsis
We examined access to MRI in Sub-Saharan Africa to provide a novel framework to address MRI needs. A 68-question needs assessment survey was distributed to collaborators, radiologists and radiographers in Africa, yielding 158 unique responses. Survey responses were analyzed to provide insight into challenges and opportunities for MRI access. Geographical information systems (GIS) were applied to responses from Nigeria to model access to high-value MRI. To our knowledge, this is the first study that used GIS mapping to estimate MRI access. This novel approach can be applied to low-resource settings globally to provide a comprehensive framework to understand MRI access.
Introduction
MRI usage has grown exponentially since its development in the 1970s, owing to its applications in the management of non-communicable diseases (NCDs), including cancer, cardiovascular and neurological disorders. Though NCDs are often associated with high-income countries, the burden of NCDs in Sub-Saharan Africa (SSA) is significant and growing. From 1990 to 2017, the disability-adjusted life-years (DALYs) due to NCDs in SSA rose by 67%, while decreasing in high-income countries.1,2 As disability from NCDs continues to increase in SSA, it is critical to address barriers to NCD management to achieve the global target of reducing by one third premature mortality from NCDs by 2030.3 This study aims to provide a more comprehensive assessment of access to high value MRI services, describe needs for MRI development, and provide a framework of opportunities to address MRI needs in SSA. Here, we describe preliminary results from a needs assessment survey (NAS) as a first step towards understanding the multidimensional and vast challenges to effective MRI usage in SSA.Methods
French/English versions of the Consortium for Advancement of MRI Education and Research in Africa (CAMERA) NAS were created using Google Forms and distributed via email/WhatsApp to known collaborators, radiologists and radiographers in Africa. The NAS consisted of 68 questions assessing key challenges in MRI access, training/education, research capacity and technology sustainability. To update MRI scanner density in Africa, NAS results were supplemented with data on the total number of MRI scanners per country from the World Health Organization4 and IAEA IMAGINE Database. Population density was obtained from World Bank estimates. Survey responses from Nigeria were used to create a novel comprehensive accessibility index (CAI) to better characterize imaging needs, going beyond scanner density (MRI per million people (pmp))5 to estimate access to high-value MRI services in Nigeria. Geographical information system (GIS) mapping was applied to the Nigeria data to model CAI. Specifically, GIS estimates CAI by incorporating 1) physical/geographical accessibility (equitable distribution based on drive/walk time to facility), along with novel indices introduced here; 2) economic accessibility (affordability), and 3) technical accessibility (quality of MRI service). Facility location, population, elevation, and other ancillary local data were used to model physical accessibility to operational MRI scanners using network analysis to overcome geocoding issues prevalent in SSA. GIS mapping was performed separately for driving and walking scenarios for each Nigerian geopolitical zone using QGIS.6Results
Preliminary results from the NAS and the physical accessibility index of CAI are presented in Figures 1-5. NAS was conducted in 2020 over a 6-month period. 158 unique survey responses from 12 countries were captured after removing duplicate entries. On average, MRI scanner density in Africa was 0.8 scanners pmp (fig.1A). 51% of respondents have low-field (<1T) MRI with up to 90% of these systems exceeding their obsolescence period7(fig.1B). Up to 86% of facilities reported access to constant power supply (≥75% 24h/7day/week) and 41.3% reported downtime frequency of ≥50%. 47.8% perform clinical scans on ≤5 patients/scanner/day while 6.5% scan ≥15 patients/scanner/day. The top reported indications were brain, spine, and musculoskeletal. 55% of respondents do not have access to an MRI physicist, while 82% have regular access to a third party service engineer. Up to 62% expressed interest or have participated in research using MRI but only 29% of radiologists and 20% of radiographers regularly attend CME events (fig 2). GIS maps based on driving time (fig.3) and walking time (fig.4) to MRI facilities show large disparities in physical access to MRI service in Nigeria, with the best served area concentrated in the South West region (fig.5).Discussion and Conclusion
With nearly one-fifth of the world’s population, Africa has the least access to MRI machines. Our NAS combined with WHO and IAEA provide the most up-to-date data on MRI density in Africa, although several high field systems have been installed since June 2020 when last survey responses were captured. Although the majority of responses came from West Africa, the findings provide unique insight into Africa’s MRI needs. While it appears that more high field systems are being used in the region, reported gaps in training, maintenance, and research capacity indicate ongoing challenges in providing sustainable high value MRI access in SSA.GIS of physical/geographical accessibility have recently been created for a wide range of healthcare applications,8 with increasing use in Radiology.9 For the first time, we demonstrate the applications of GIS in estimating MRI access using Nigeria as a case model to create a novel comprehensive index of MRI accessibility, robust to needs of low-resource settings. As illustrated here, GIS provides more in-depth characterization of MRI needs beyond previously reported MRI scanner densities.10-12 Ongoing GIS analysis to incorporate affordability and quality of service indices will provide a CAI, which can serve as a novel approach for determining degree of healthcare access, globally. This, along with complete analysis of the CAMERA NAS and recent MRI in Africa discussions at ISMRM and ESMRMB will aid in creating a framework for advancing MRI capacity in SSA.
Acknowledgements
No acknowledgement found.References
Gouda, Hebe N., et al. "Burden of non-communicable diseases in sub-Saharan Africa, 1990–2017: results from the Global Burden of Disease Study 2017." The Lancet Global Health 7.10 (2019): e1375-e1387.
Hay, Simon I., et al. "Global, regional, and national disability-adjusted life-years (DALYs) for 333 diseases and injuries and healthy life expectancy (HALE) for 195 countries and territories, 1990–2016: a systematic analysis for the Global Burden of Disease Study 2016." The Lancet 390.10100 (2017): 1260-1344.
“Goal 3 | Department of Economic and Social Affairs.” United Nations, United Nations, https://sdgs.un.org/goals/goal3.
“Gho | by Category | Medical Equipment - Data by Country.” World Health Organization, World Health Organization, https://apps.who.int/gho/data/view.main.302010.
“Imagine - IAEA Medical Imaging and Nuclear Medicine Global Resources Database.” Human Health Campus - Database & Statistics, https://humanhealth.iaea.org/HHW/DBStatistics/IMAGINEMaps.html.
“Qgis.” Welcome to the QGIS Project!, http://qgis.osgeo.org/.
European Society of Radiology (ESR. "Renewal of radiological equipment." Insights into imaging 5.5 (2014): 543-546.
Musa, George J., et al. "Use of GIS mapping as a public health tool–-from cholera to cancer." Health services insights 6 (2013): HSI-S10471.
Daniels, Marcus J., et al. "Strategic Radiology Outreach Planning for Underserved Populations Using Geographic Information Systems." Journal of the American College of Radiology 18.4 (2021): 537-544.
Geethanath, Sairam, and John Thomas Vaughan Jr. "Accessible magnetic resonance imaging: A review." Journal of Magnetic Resonance Imaging 49.7 (2019): e65-e77.
Hricak, Hedvig, et al. "Medical imaging and nuclear medicine: a Lancet Oncology Commission." The Lancet Oncology (2021).
Ogbole, Godwin Inalegwu, et al. "Survey of magnetic resonance imaging availability in West Africa." Pan African Medical Journal 30.1 (2018).
Figures
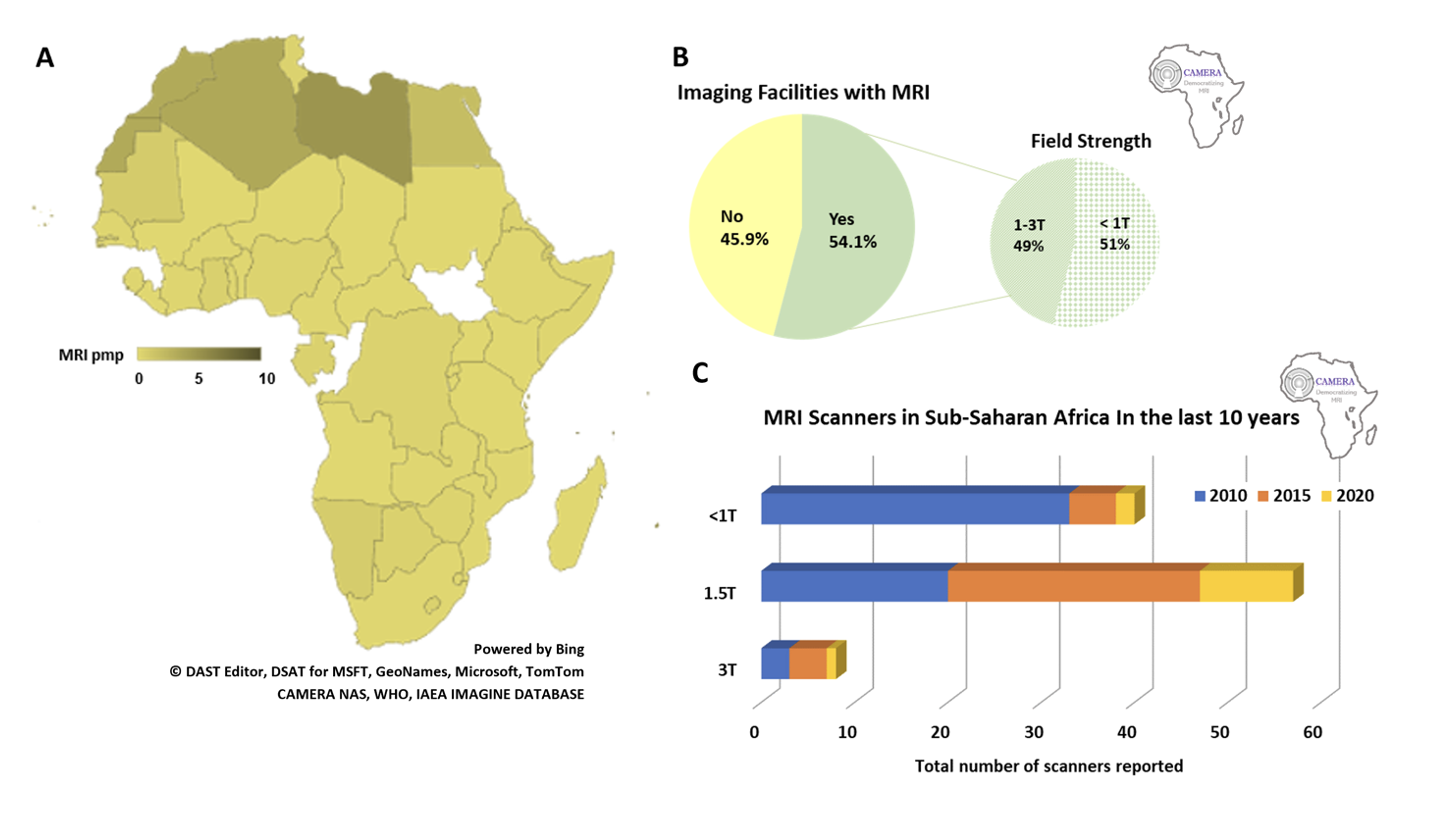
MRI Density and Proportion of Scanners by Field Strength
Density of MRI across Africa demonstrating the number of scanners per million people (pmp) for each country with data (colored) (A). Over 50% of CAMERA NAS respondents reported access to MRI although predominantly low-field (≤1T) (B). However, there is a growing number of high field (1.5T and 3T) in Sub-Saharan Africa but also ongoing procurement of low-field MRI (≤1T) (C).
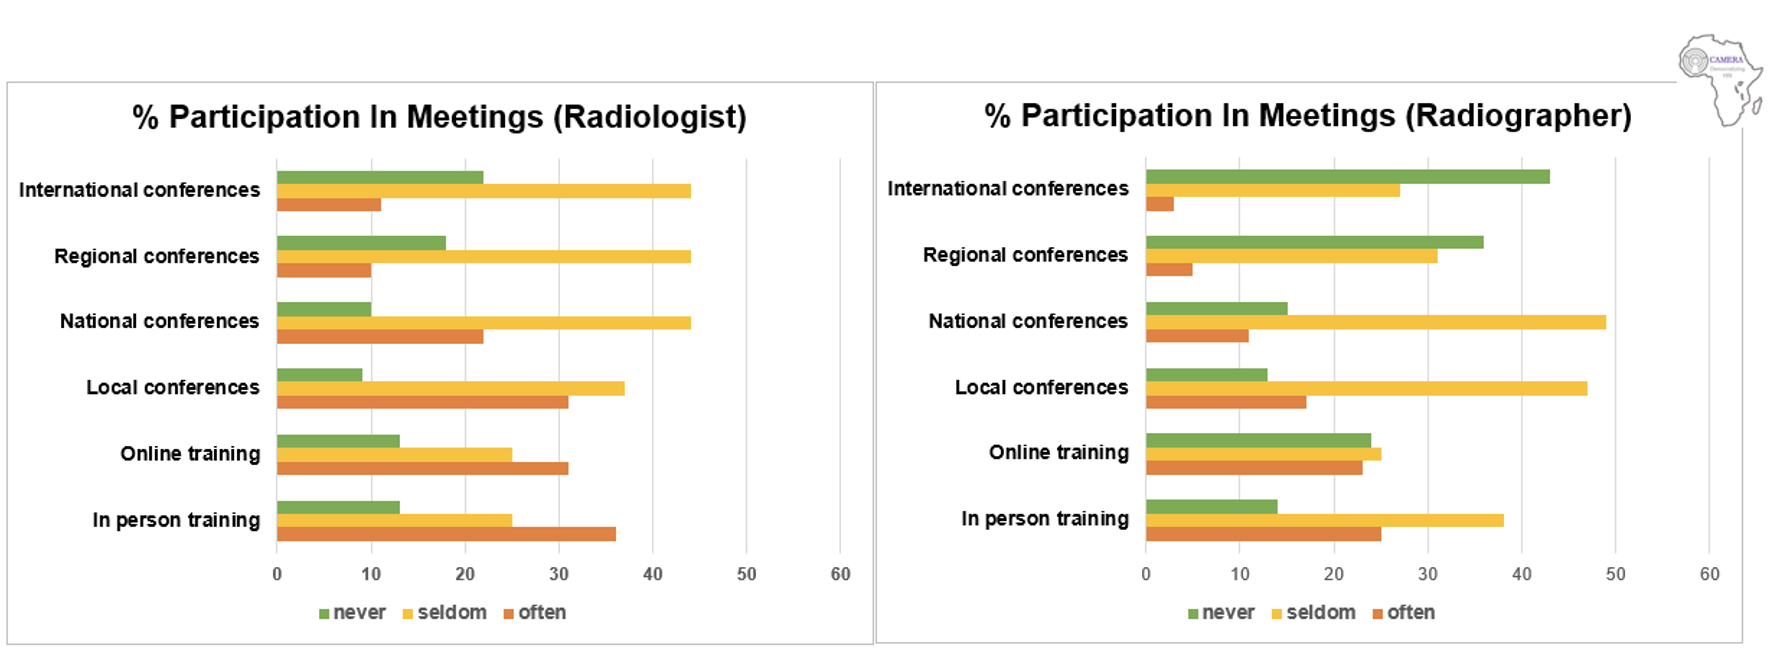
Figure 2: MRI Training and Education Access in SSA
Proportion (%) of respondents (n=158) who have participated in MRI meetings, workshops or conferences in the past 5 years often (2-3 times per year), or seldom (1 time per year) or never over this period using various modes of participation (online or in-person) and at various levels of participation, locally (within their institution), nationally (within their country), regionally (within Africa) or internationally (abroad).
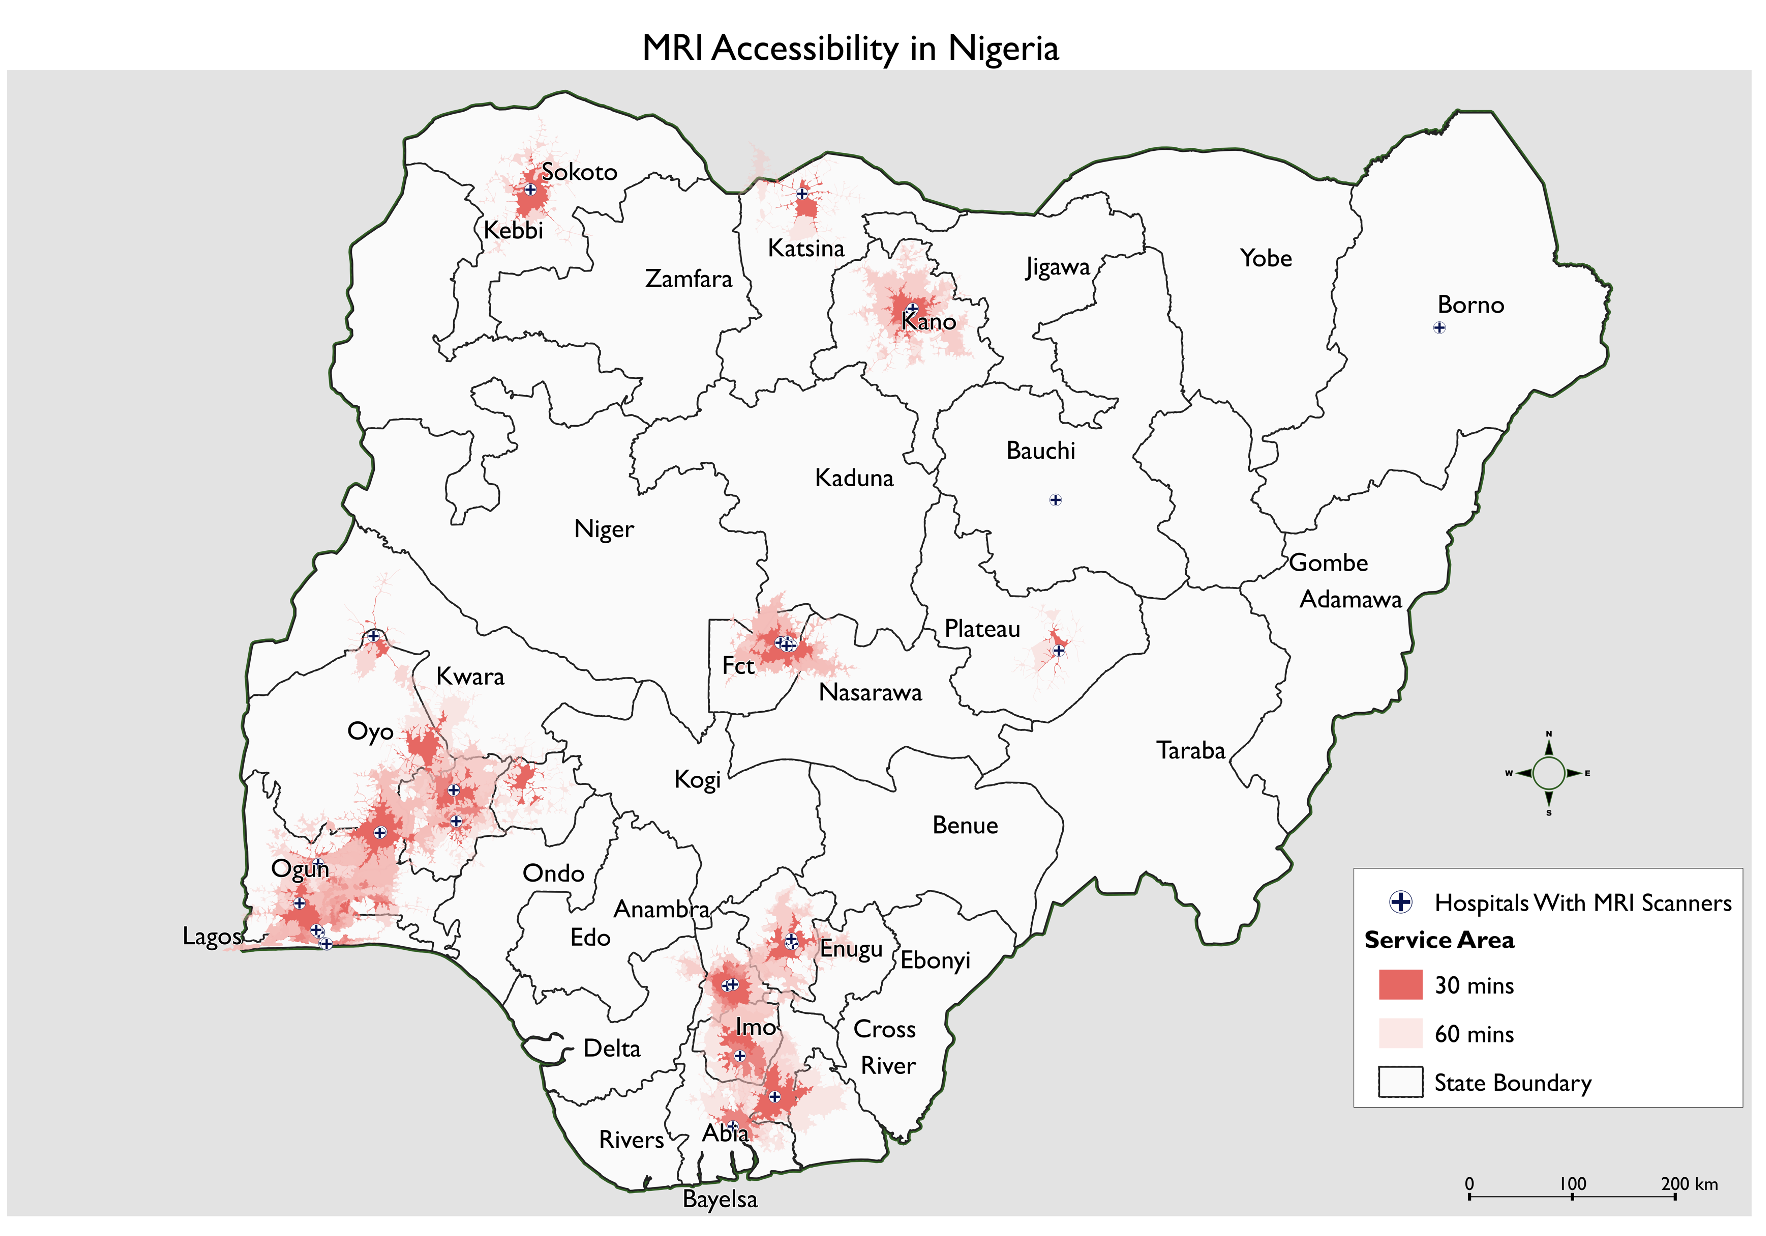
GIS Driving Time to Closest MRI Facility in Nigeria
GIS map of driving time to facilities with MRI service show extent of served (≤ 60 min) and underserved areas (> 60 min). GIS maps of each geopolitical region/zone (North Central, North East, North West, South East, South South, South West) were combined to create one composite National GIS driving time map.
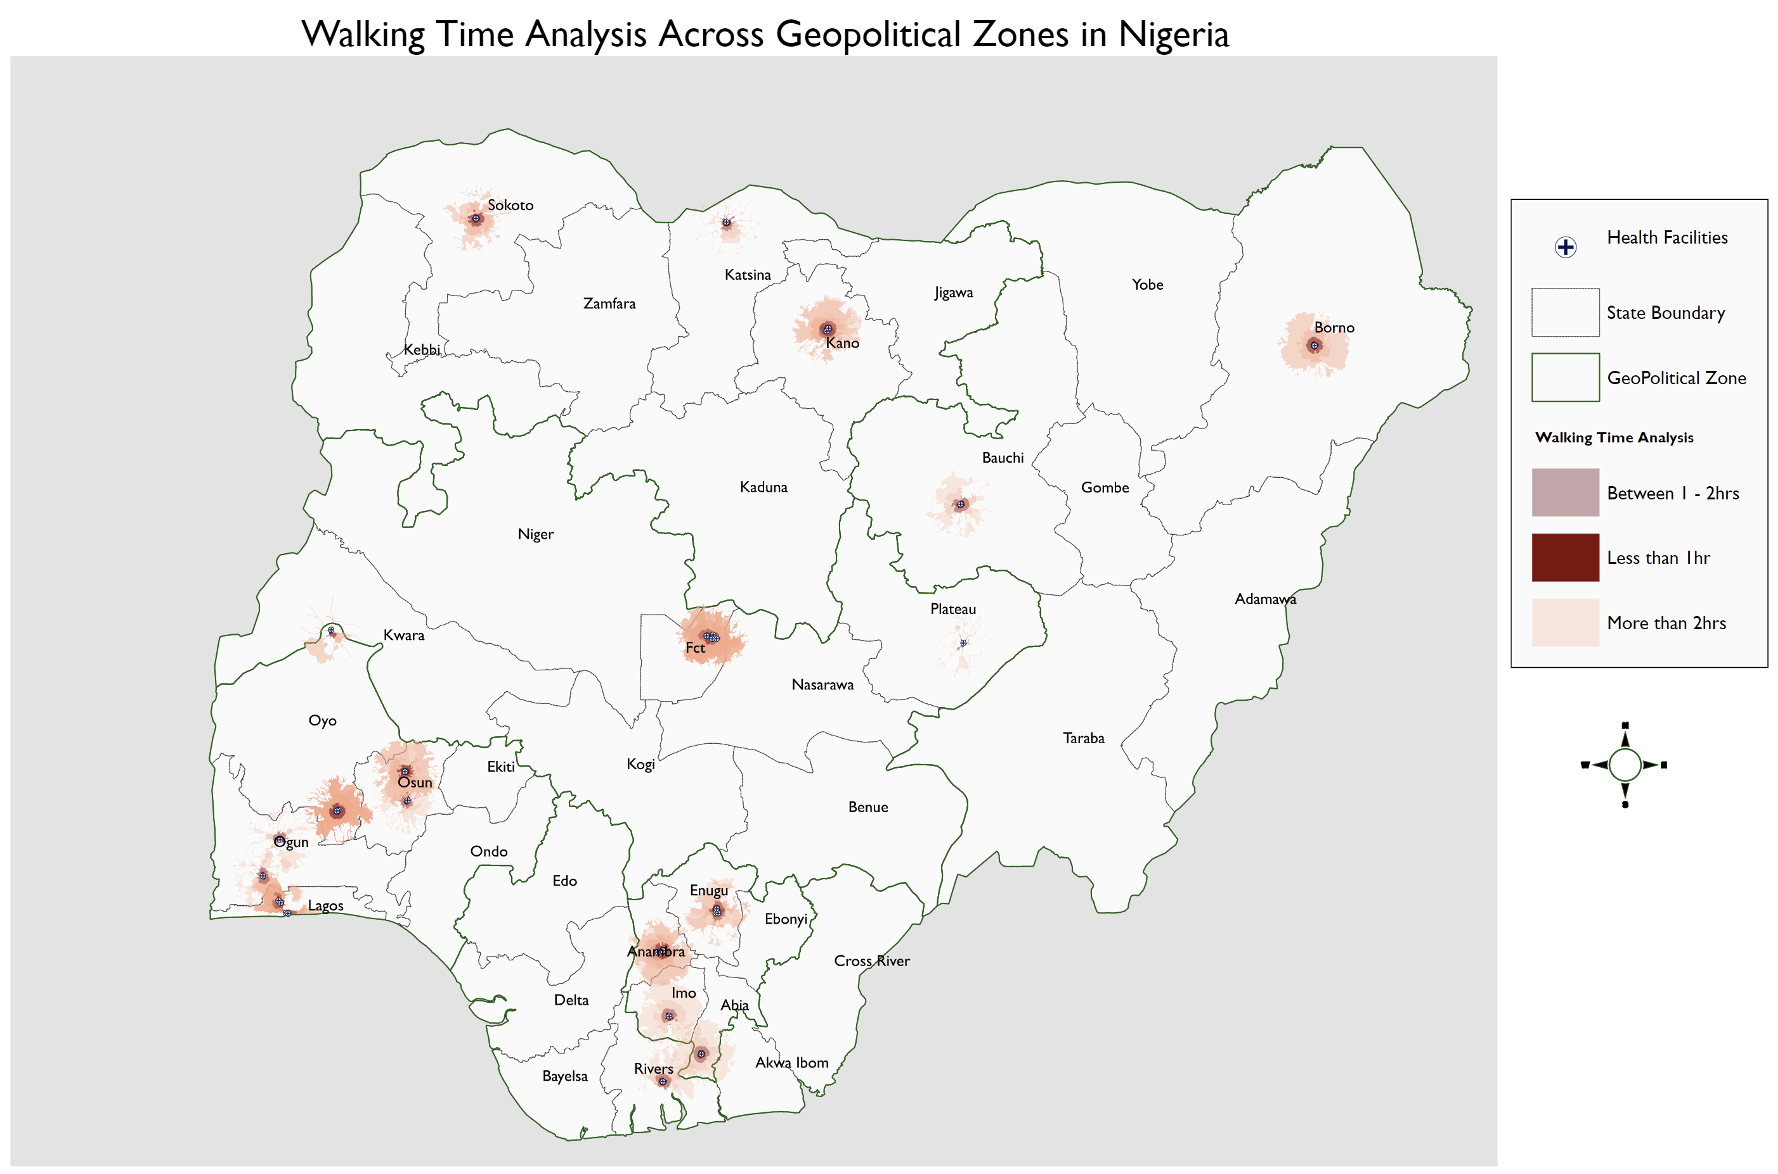
GIS Walking Time to Closest MRI Facility in Nigeria
GIS map of walking time to facilities with MRI service show extent of served (≤ 60 min) and underserved areas (> 60 min). GIS maps of each geopolitical region/zone (North Central, North East, North West, South East, South South, South West) were combined to create one composite National GIS walking time map.
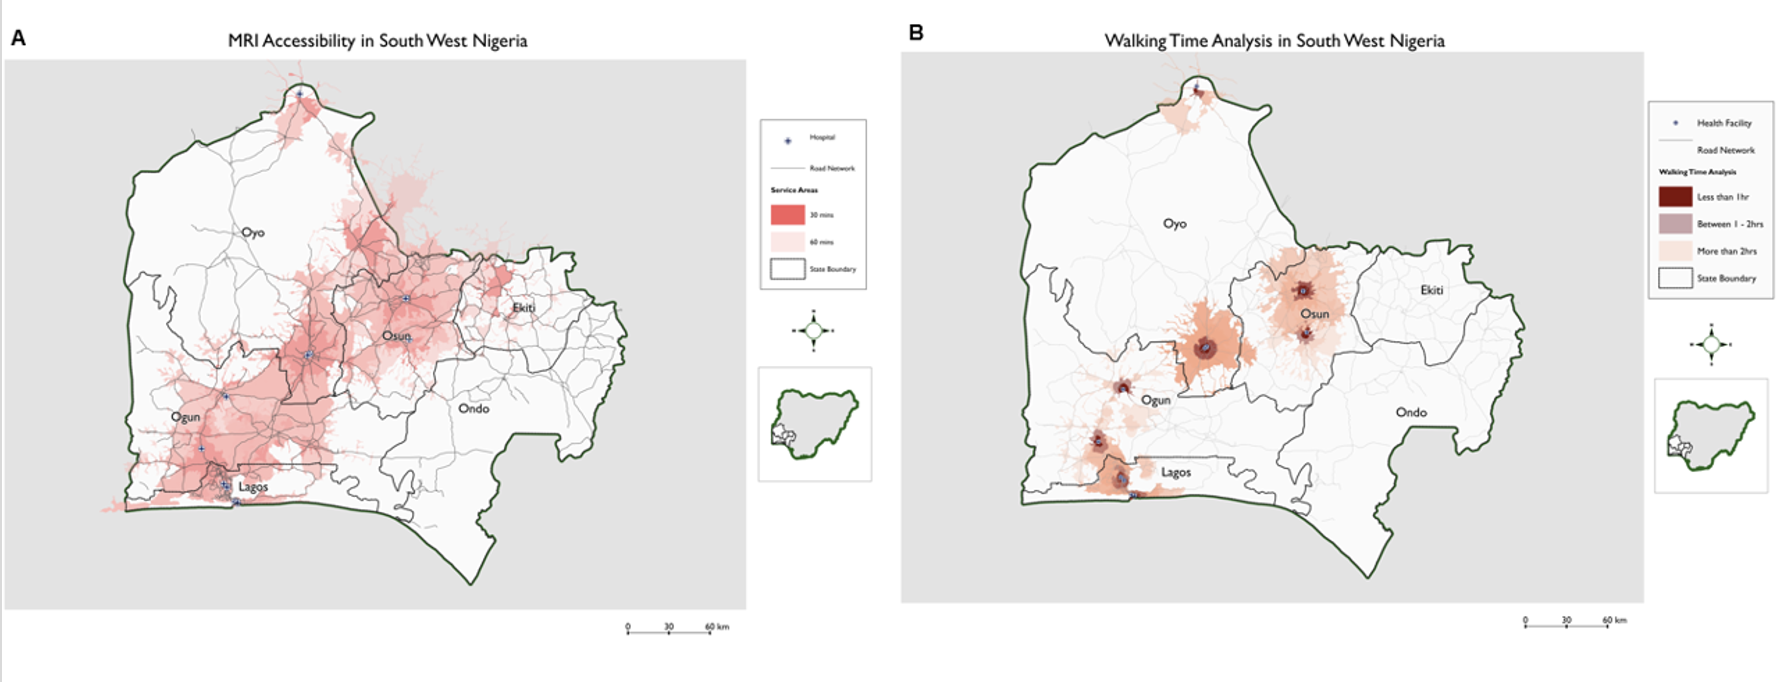
Driving (A) and walking (B) time to MRI Facilities in South West Nigeria
GIS map of driving (A) and walking (B) time to facilities with MRI service in South West Zone, the best served region of the country, shown here with road networks to further illustrate the extent of served (≤ 60 min) and underserved areas (> 60 min). GIS map scale from 0 to 60 km.