2047
Association between neurofilament (NF-L) levels and amyotrophic lateral sclerosis (ALS) neurodegeneration patterns in the precentral cortex1Aix Marseille Univ, CNRS, CRMBM, Marseille, France, 2APHM, Hôpital de la Timone, CEMEREM, Marseille, France, 3APHM, Hôpital de la Timone, Department of Neuroradiologie, Marseille, France, 4Immunology Laboratory, Conception Hospital, AP-HM, Marseille, France, 5APHM, Hôpital de la Timone, Referral Centre for Neuromuscular Diseases and ALS, Marseille, France, 6INS, INSERM, UMR 1106, Marseille, France
Synopsis
Neurofilament light-chain (NF-L) levels in serum and cerebrospinal fluid (CSF) have recently been demonstrated as robust clinical biomarkers in amyotrophic lateral sclerosis (ALS). Nonetheless, the association between NF-L levels and ALS specific neurodegeneration patterns in the precentral cortex, a primarily affected area, has not been fully divulged. Combining 3T and 7T anatomical imaging with NF-L measures, clinical and electrophysiological data, we demonstrated regional-specific degradation within the precentral cortex according to affected limb areas. Further, NF-L levels negatively correlated with cortical thickness within the premotor cortex, suggesting the premotor cortex may be an important contributor to augmented NF-L levels in ALS.
Introduction
Amyotrophic lateral sclerosis (ALS) is a neurodegenerative disease characterized by rapid degeneration of upper and lower motor neurons. Around 50% of patients diagnosed with ALS will die within 2.5 years of symptom onset1, with rapid progression of symptoms including spasticity, muscle weakness, wasting and distorted speech. Until recently, no robust biomarkers for disease diagnosis or prognosis existed. It has been demonstrated in past years however, that neurofilament light chain levels (NF-L) in the serum and cerebrospinal fluid (CSF) – present following axonal damage – could be a highly sensitive biomarkers for the diagnosis and prognosis of ALS2–4. Yet, although NF-L has been shown to be a crucial biomarker for clinical disease course, its association with ALS specific patterns of neurodegeneration are not well understood. The goal of the study was to investigate the role of NF-L serum and CSF measures, as putative mediators between neurodegeneration in the precentral cortex and clinical outcome measures in a population of ALS patients.Methods
To follow this aim, we retrospectively included 25 patients with a confirmed ALS diagnosis who underwent a 3T (n=19) or 7T (n=6) MRI and who had at least a serum (n=24) or CSF (n=16) Nf-L measurements. The 7T MRI protocol included a high-resolution three-dimensional Magnetization Prepared 2 Rapid Acquisition Gradient Echoes (MP2RAGE; TR/TE/TI1/TI2 = 5000/3/900/2750 ms, 256 sagittal slices, FOV = 240 mm, isotropic resolution of 0.6 mm3, GRAPPA with an acceleration factor of 3; TA = 10 min 12 s) and a sagittal two-dimensional magnetization-prepared turbo-FLASH (fast low-angle shot) B1+ mapping5 sequence (TR/TE = 2000/14 ms, 14 axial sections, slice thickness 5 mm, FOV = 250 mm, in plan resolution of 3.9 × 3.9 mm2, TA = 2 min 14 s) and were acquired using a 32-channel (32Rx/1Tx) head coil (Nova). MP2RAGE images were denoised6 and brain-masks created using HD-BET7. The 3T protocol included a three-dimensional Magnetization-Prepared Rapid Gradient Echo T1-weighted (MPRAGE; TR/TE/IT = 2300/2.98/900 ms; 160 sagittal slices, FOV = 256 mm, isotropic resolution of 1 mm3, GRAPPA with an acceleration factor of 2, TA = 5 min 21 s) and was acquired using a 32-channel (32Rx/1Tx) head coil (Siemens). Freesurfer was used to manually correct brain masks and estimate cortical thickness (https://surfer.nmr.mgh.harvard.edu/fswiki/recon-all). Serum and CSF NF-L levels (pg/mL) were measured using electrochemiluminescence assays with the R-PLEX Human Neurofilament L Antibody Set (Mesoscale Discovery). Clinical disability was quantified with the ALSFRS-R (ALS Functional Rating Scale - Revised) and separated according to arm, leg, respiratory and bulbar sub-scores. Motor evoked potential (MEP) data was also examined for each arm and leg using transcranial magnetic stimulation (TMS). A group of 40 age and sex matched healthy individuals scanned at either 3T (n=25) or 7T (n=15) served as a control group for the imaging data. We applied surface based GLM analyses restricted to the precentral cortex (?.aparc.annot precentral) to investigate spatial patterns of cortical thickness loss compared to healthy controls and in relation to ALSFRS-R and ALSFRS-R sub-scores. After this feasibility analysis, we investigated the association of cortical thickness and serum or CSF NF-L levels in the precentral cortex corrected for ALSFRS-R sub-scores. Models were adjusted for age, sex and the scanner type (3T or 7T). An unadjusted p-value below <0.05 was used to explore the GLM results.Results
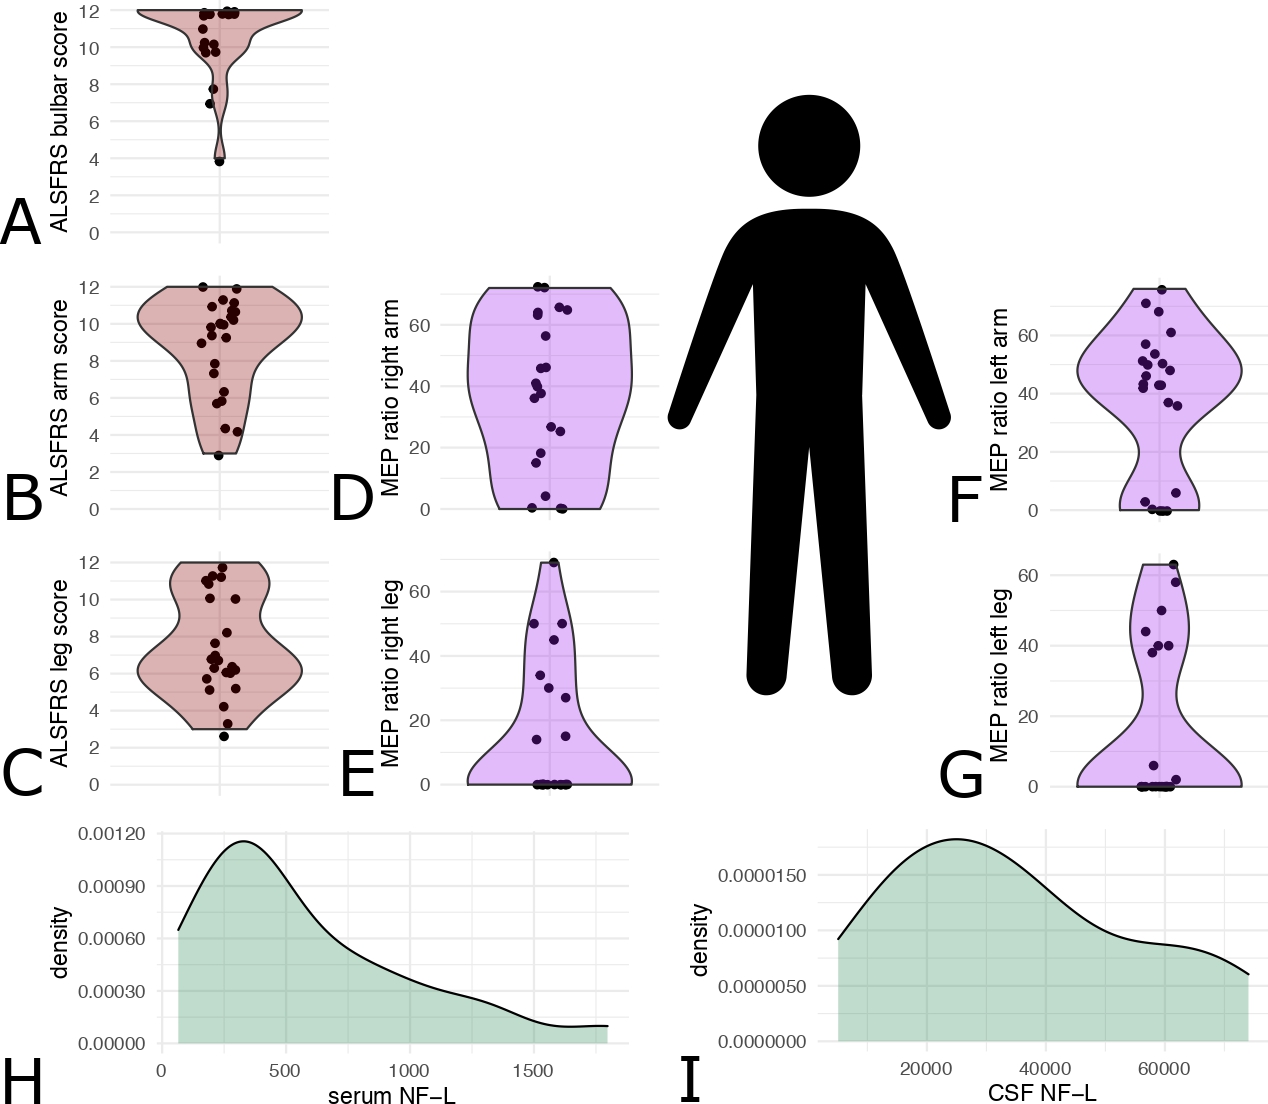
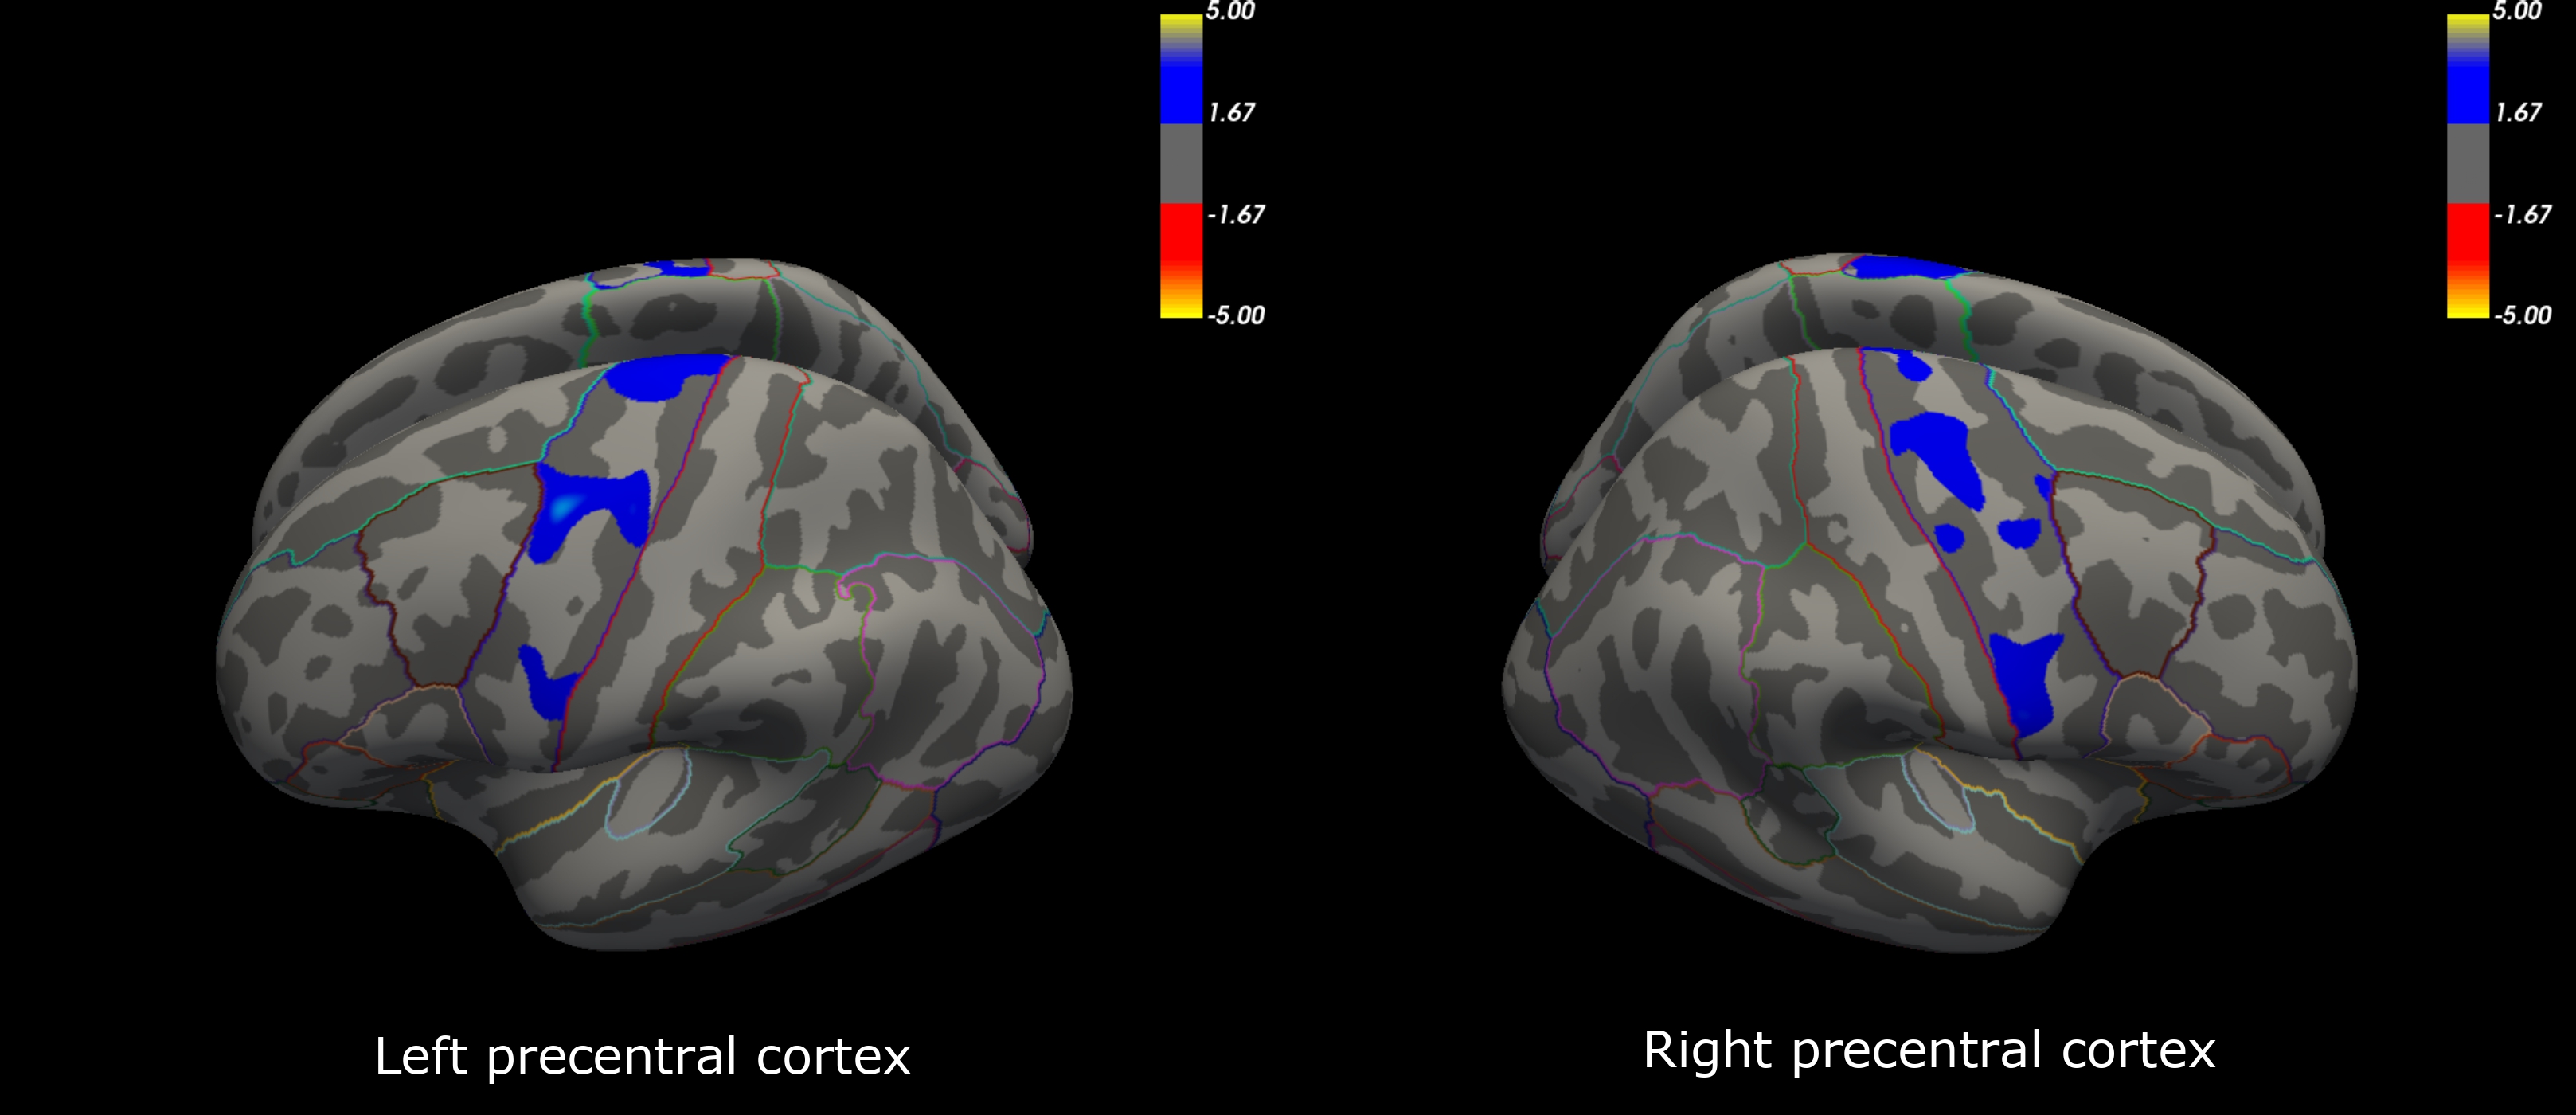
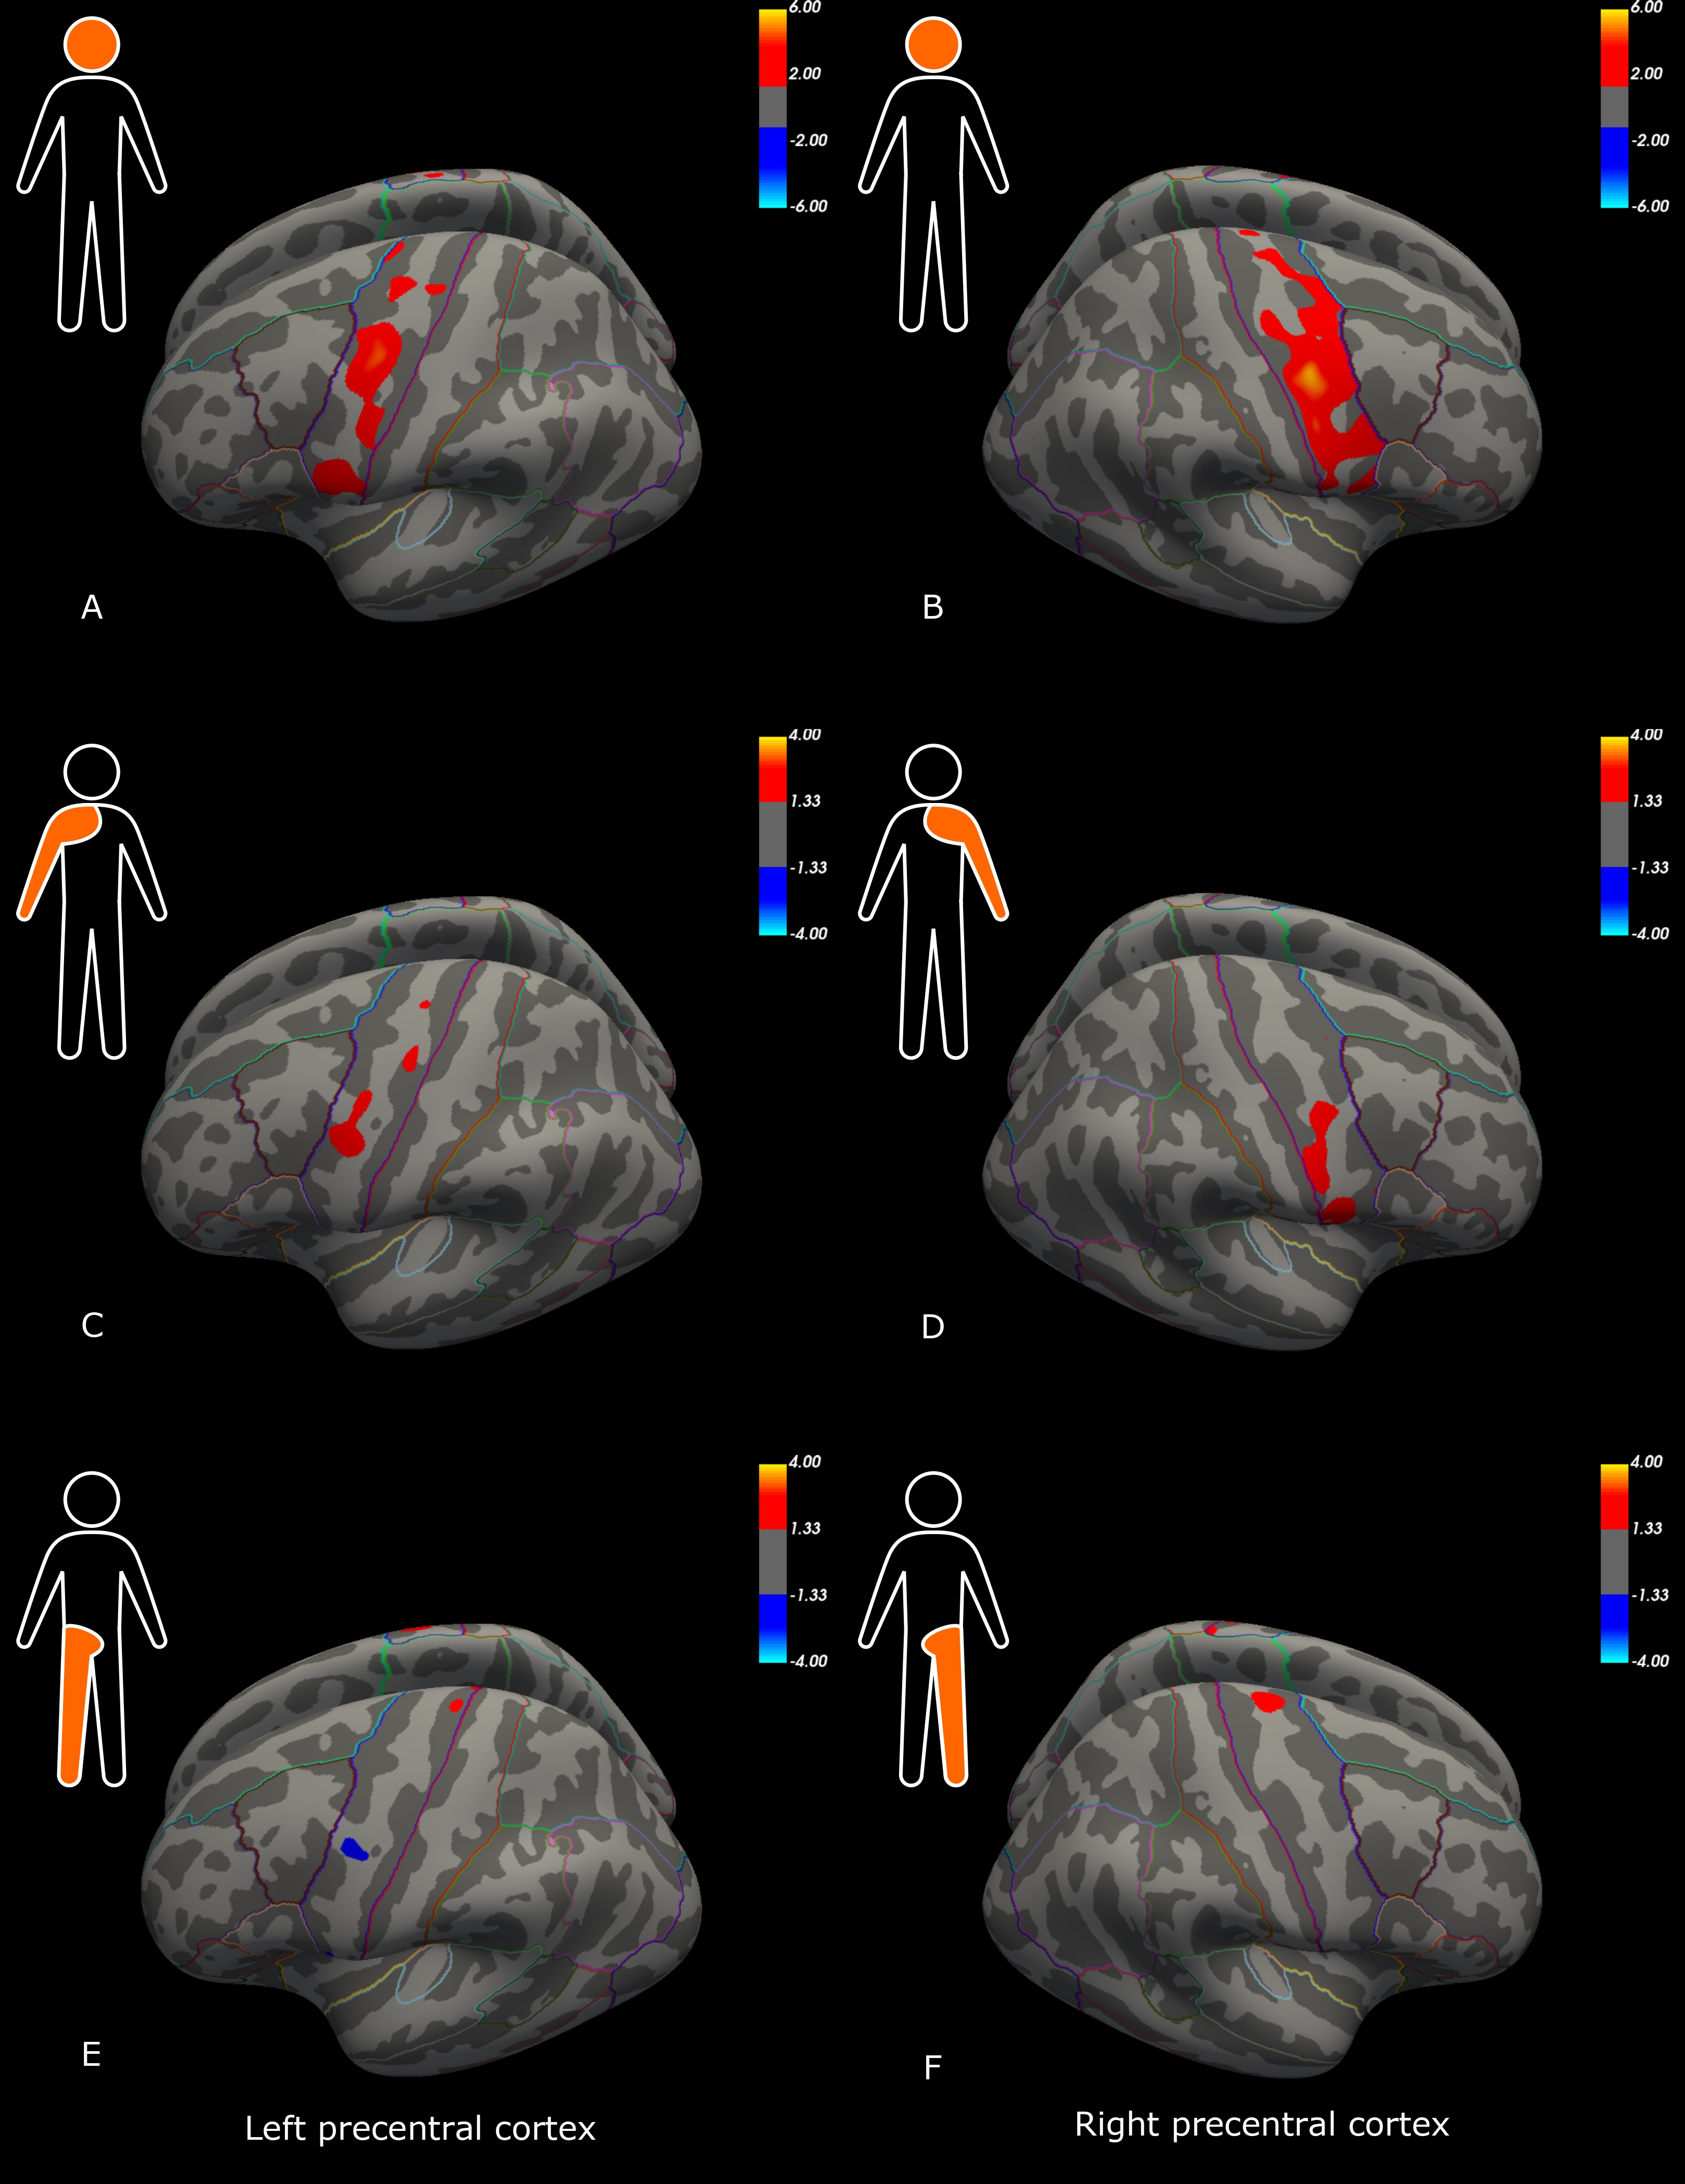
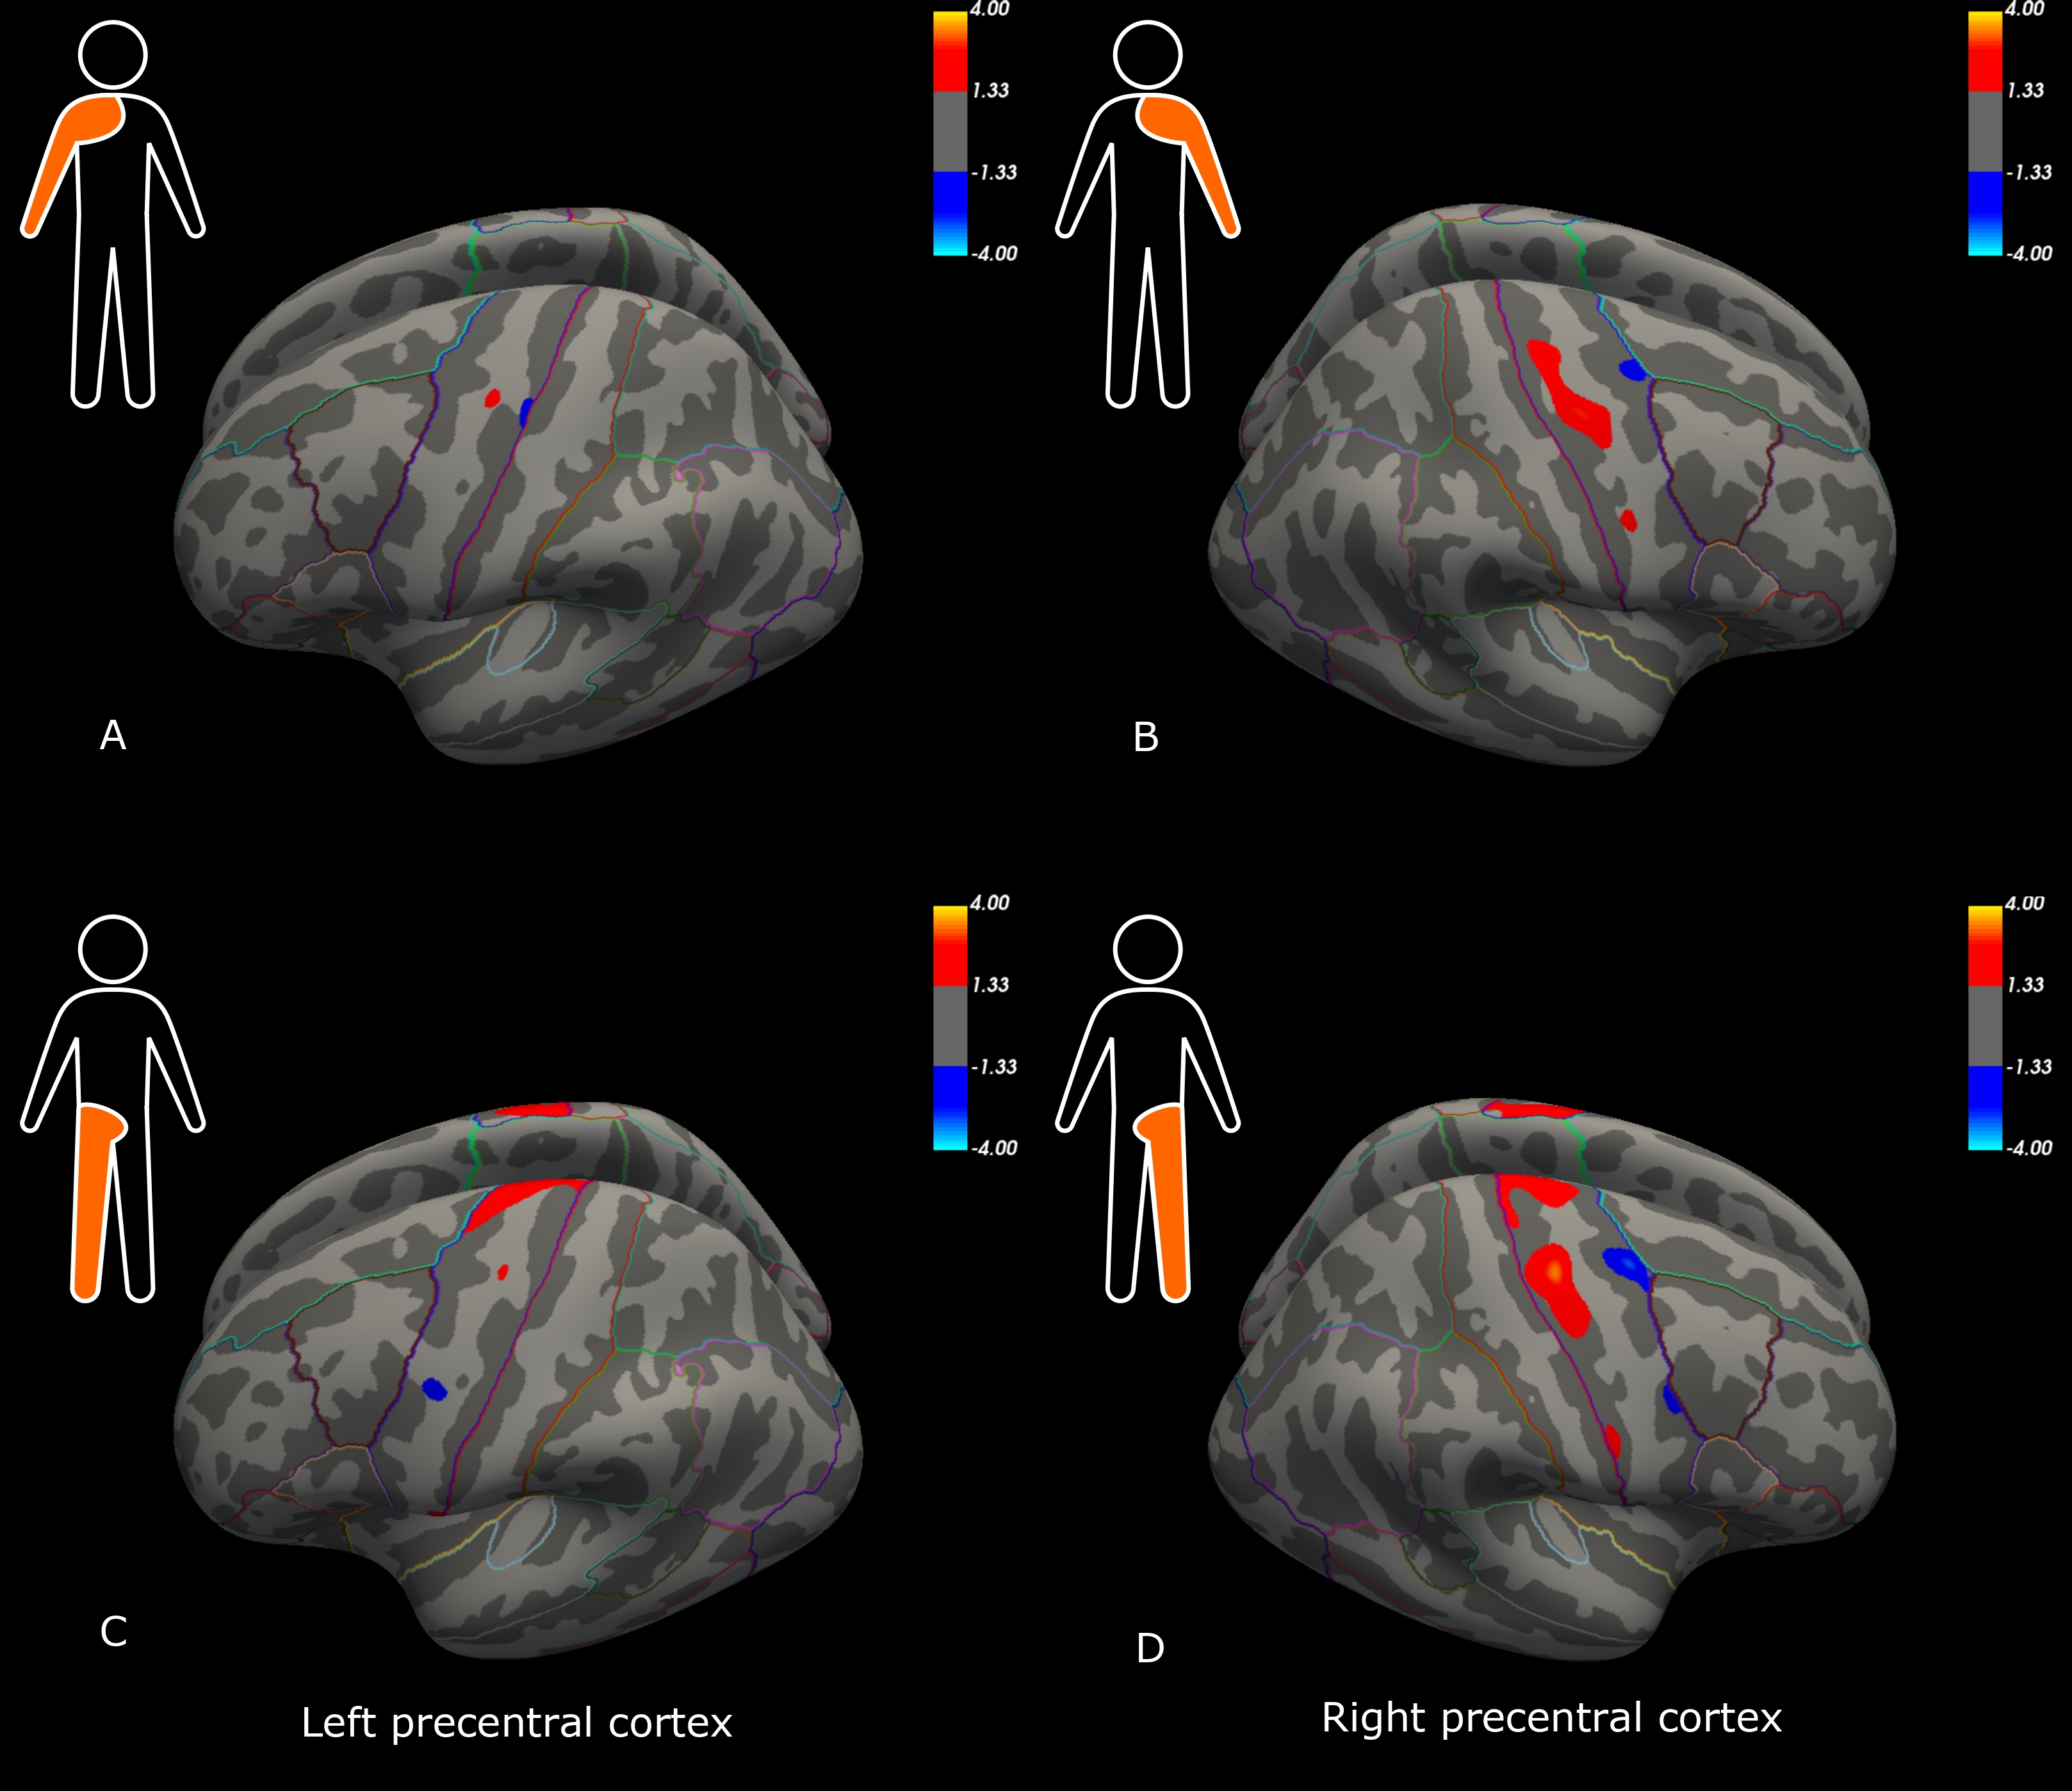
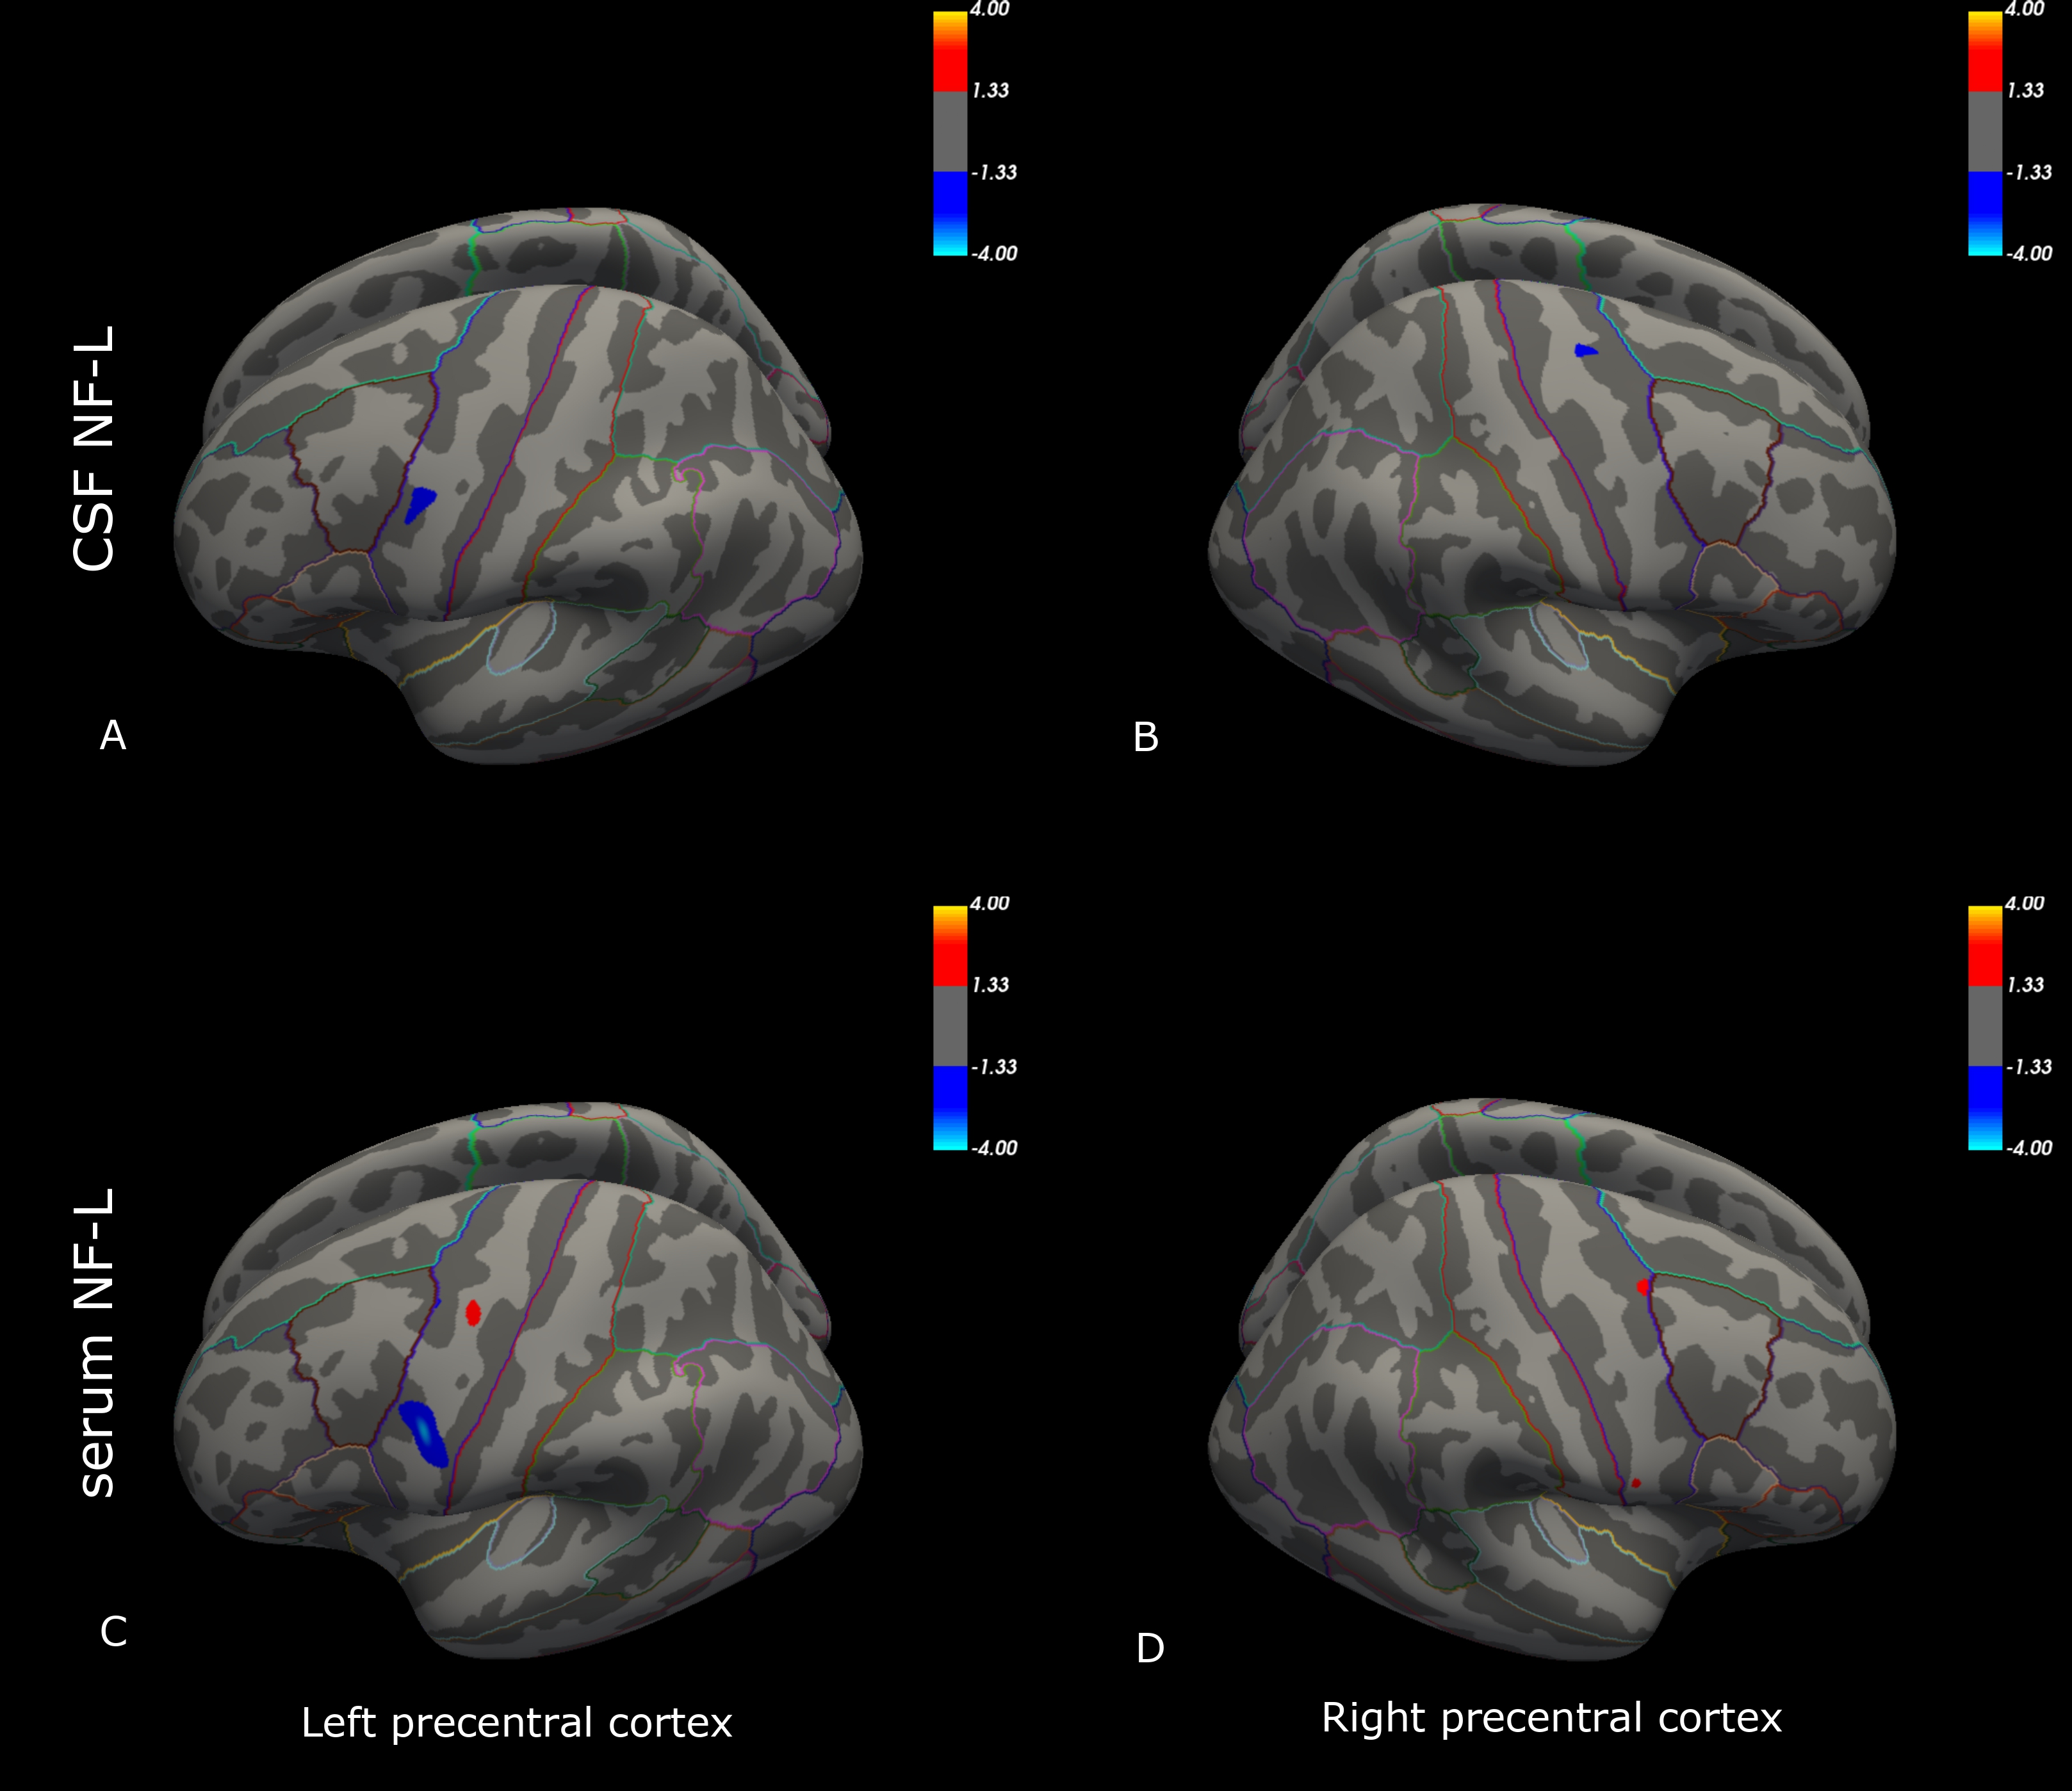
Initial descriptive data are shown in Figure 1, including the distribution of ALSFRS-R sub-scores (bulbar, arm and leg), MEP amplitude ratios, and NF-L serum and CSF values for the ALS patients. Compared to the control group, patients had significant cortical thinning across the precentral cortex (Figure 2). Further, ALSFRS-R sub-scores specific to bulbar regions (Figure 3A-B), upper limbs (Figure 3C-D) and lower limbs (Figure 3E-F) correlated overall positively with cortical thickness, in generally expected areas of the precentral cortex based on the motor and sensorimotor homunculus8. Similar spatial distributions were found for MEP amplitude ratios of the upper (Figure 4A-B) and lower limbs (Figure 4C-D). GLM analyses revealed that NF-L levels in the CSF correlated negatively with cortical thickness levels in the left premotor cortex and right motor cortex (Figure 5A-B). Serum NF-L levels correlated negatively with cortical thickness levels in the left premotor cortex (Figure 5C) with areas of positive correlation in both hemispheres (Figure 5C-D). Overlap with neurofilament results seemed evident only for ALSFRS-R upper limb scores which showed correlation in the left premotor cortex.Discussion
These results are in line with previous results showing that ALS patients have decreased cortical thickness in the precentral cortex compared to controls. Further, correlation of clinical sub-scores and MEP ratios with cortical thickness confirmed expected regional-specific thinning of the precentral cortex according to the concerned limb area, indicating sufficient power to detect relevant effects despite a low number of subjects. Finally, these results establish the link between decreased cortical thickness and increased levels of neurofilaments in the CSF and, partly, the serum. Added weight is thus given to the clinical utility of NF-L levels through confirming the link to neurodegenerative processes within the premotor cortex. These results may suggest that the premotor cortex, an area involved in movement execution and with direct corticospinal descending tracts, may be an important origin of elevated Nf-L levels in ALS.Acknowledgements
This research was funded by APHM (AORC Junior 2014 program), ARSLA (Association pour la Recherche sur la Sclérose Latérale Amyotrophique et autres maladies du motoneurone) and FRC (Fédération pour la Recherche sur le Cerveau).References
1. Talbot K. Motor neuron disease: the bare essentials. Pract Neurol. 2009 Oct;9(5):303–9.
2. Rossi D, Volanti P, Brambilla L, Colletti T, Spataro R, La Bella V. CSF neurofilament proteins as diagnostic and prognostic biomarkers for amyotrophic lateral sclerosis. J Neurol. 2018 Mar 1;265(3):510–21.
3. Gaiani A, Martinelli I, Bello L, Querin G, Puthenparampil M, Ruggero S, et al. Diagnostic and Prognostic Biomarkers in Amyotrophic Lateral Sclerosis: Neurofilament Light Chain Levels in Definite Subtypes of Disease. JAMA Neurol. 2017 May 1;74(5):525–32.
4. Brodovitch A, Boucraut J, Delmont E, Parlanti A, Grapperon AM, Attarian S, et al. Combination of serum and CSF neurofilament-light and neuroinflammatory biomarkers to evaluate ALS. Sci Rep. 2021 Jan 12;11(703).
5. Fautz H, Vogel M, Gross P, Kerr A, Zhu Y. B1 mapping of coil arrays for parallel transmission. In: In: Proc Int Mag Reson Med Torronto. 2008. p. 1247.
6. O’Brien KR, Kober T, Hagmann P, Maeder P, Marques J, Lazeyras F, et al. Robust T1-Weighted Structural Brain Imaging and Morphometry at 7T Using MP2RAGE. PLoS One. 2014 Jun 16;9(6):e99676.
7. Isensee F, Schell M, Pflueger I, Brugnara G, Bonekamp D, Neuberger U, et al. Automated brain extraction of multisequence MRI using artificial neural networks. Hum Brain Mapp. 2019 Dec 1;40(17):4952–64.
8. Saadon-Grosman N, Loewenstein Y, Arzy S. The “creatures” of the human cortical somatosensory system. Brain Commun. 2020 Jan 1;2(1).
Figures