2044
Auditory topographic maps in the congenitally blind brain: Effects of NORDIC de-noising and sensory substitution training1Department of Ophthalmology, New York University Langone Health, New York, NY, United States, 2Neuroscience Institute, New York University Langone Health, New York City, NY, United States, 3Mayo Clinic Rochester, Rochester, MN, United States, 4Korb and associates, Boston, MA, United States, 5Department of Ophthalmology, University of Pittsburgh School of Medicine, Pittsburgh, PA, United States
Synopsis
Sensory substitution devices (SSDs) can represent the structure of visual space through sound. To determine whether this representation is topographically organized in the congenitally blind brain, we used NORDIC de-noising and population receptive field mapping (pRF) to correlate functional brain changes to changes in sound stimulus verticality (frequency) and laterality (panning/timing) following SSD principles. We show that NORDIC significantly increased temporal signal-to-noise ratios and activation areas in subjects’ auditory cortices. PRF revealed that auditory topographic maps representing verticality and laterality emerged in occipital-parietal cortices of 3/7 congenitally blind subjects only after 10-minutes of SSD training, indicating rapid cross-modal cortical recruitment.
Introduction
Sensory substitution devices (SSDs), such as ‘the vOICe’1 preserve visual images in sound, allowing blind individuals access to substituted-vision. Learning SSDs recruits early visual2 and task-specific cortical regions3,4,5 for the blind. However, it is unclear whether this is topographically organized similar to sensory regions such as S1 (somatotopic), A1 (tonotopic), and V1 (retinotopic)6,7,8. Prior studies have found topographic lateralization to sound echoes in occipital regions of 3/5 blind echolocation experts from BOLD-fMRI phase-encoded eccentricity maps9. Topographically organized tactile sensations in occipital cortices have been found for blind subjects during occipital TMS stimulation for 3/13 Braille readers, or 4/13 vision-to-tactile SSD users after 1-week of training10,11. Recently, a congenitally blind vision-to-audio SSD user with ~15 years’ experience showed responsivity to both verticality (frequency) and laterality (time) across bilateral parietal regions from pRF-fMRI using sound12. Currently, it is not known how common these topographic maps are or when they appear post-training.Topographic maps may be easier to detect using functional data with higher signal-to-noise ratios (SNR). ‘NOise Reduction with Distribution Corrected’ (NORDIC) PCA has been shown to selectively suppress thermal noise - significantly improving temporal SNR13. This reduces the quantity of fMRI data required to reach key statistical thresholds. However, its efficacy has not been demonstrated for pRF-mapping. Evaluating NORDIC’s effect on pRF-derived tonotopic maps in the auditory cortex provides insights into NORDIC’s suitability for pRF and its applicability to topographic maps of substituted-vision.
Methods
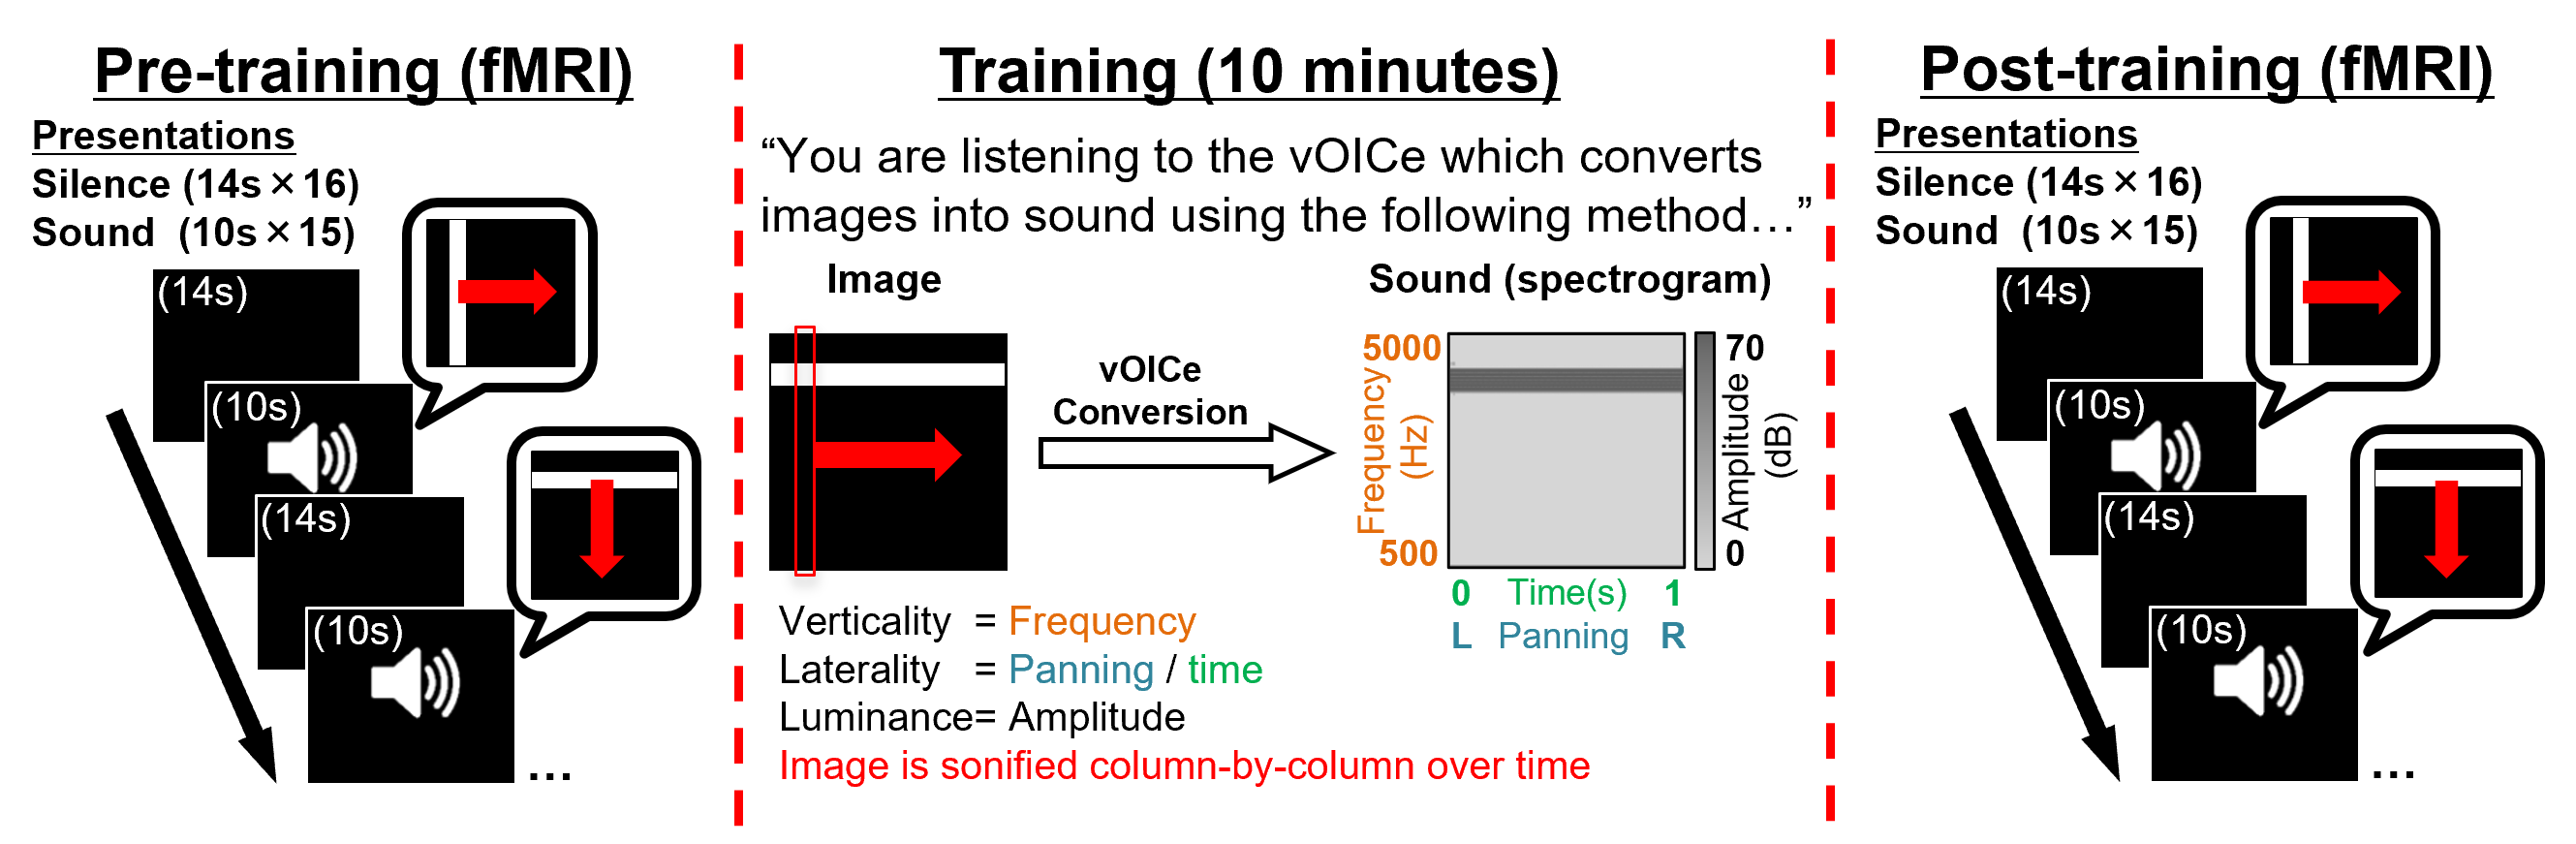
Seven congenitally blind subjects (4 female, age=55.42±13.71yrs, basic/no light perception) had functional and anatomical MR images obtained inside a 3-Tesla Siemens Allegra MRI scanner (Siemens Healthcare, Erlangen, Germany). High resolution anatomical T1-weighted MR images were obtained using the 3D MPRAGE pulse sequence (voxel size=1×1×1mm3 over 25.6×25.6×17.6cm3 FoV; 1.4s repetition time, 2.5ms echo time). Functional MR images were aligned to cover bilateral visual and auditory cortices and acquired using a single-shot gradient-echo echo-planar-imaging pulse sequence (TR/TE=2000/26ms, voxel size=2×2mm2 over 20.5×20.5cm2 with 28 slices at 3.24mm thickness). Pre- and post-training functional runs each took 6 minutes and 14 seconds to acquire 187 volumes.Functional run tasks: Subjects heard 15×10s stimulation periods interleaved with 16×14s silence periods (Figure 1). Stimulation involved vOICe sonifications of a white bar (subtending 1/10th of the substituted ‘visual field’, black background) orientated either vertically and travelling left/right, or horizontally and travelling up/down. The white bar travelled with a constant velocity, taking 10s from edge to edge. The vOICe sonifies 1 still image per second, column-by-column, panning from left-to-right with verticality encoded as auditory-frequency (low-to-high=500-5000Hz). During ‘pre-training’ runs, subjects (naïve to the vOICe) responded to ‘stimulation’ periods. Afterwards, subjects learnt the vOICe-encoding over 10 minutes, and during ‘post-training’ runs, responded indicating the direction of the ‘sweeping bar’.
NORDIC-corrected13 functional MR and T1 structural images were pre-processed, co-registered, and MNI-normalized using the default BrainVoyager pipeline. Functional files were brain-masked and tSNR evaluated by calculating ‘mean(voxel mean÷S.D.)’. For pRF analysis, 187 binarized images (representing 2s ‘visual’-stimulation each) were created. Predicted hemodynamic changes were modelled for 10 receptive field sizes for 400 evenly spaced positions (20 horizontal × 20 vertical) in response to the time course of binarized images. PRF-mapping then attributes the best-fitting position and RF-size to each voxel’s BOLD time series using the least squares method.
Results
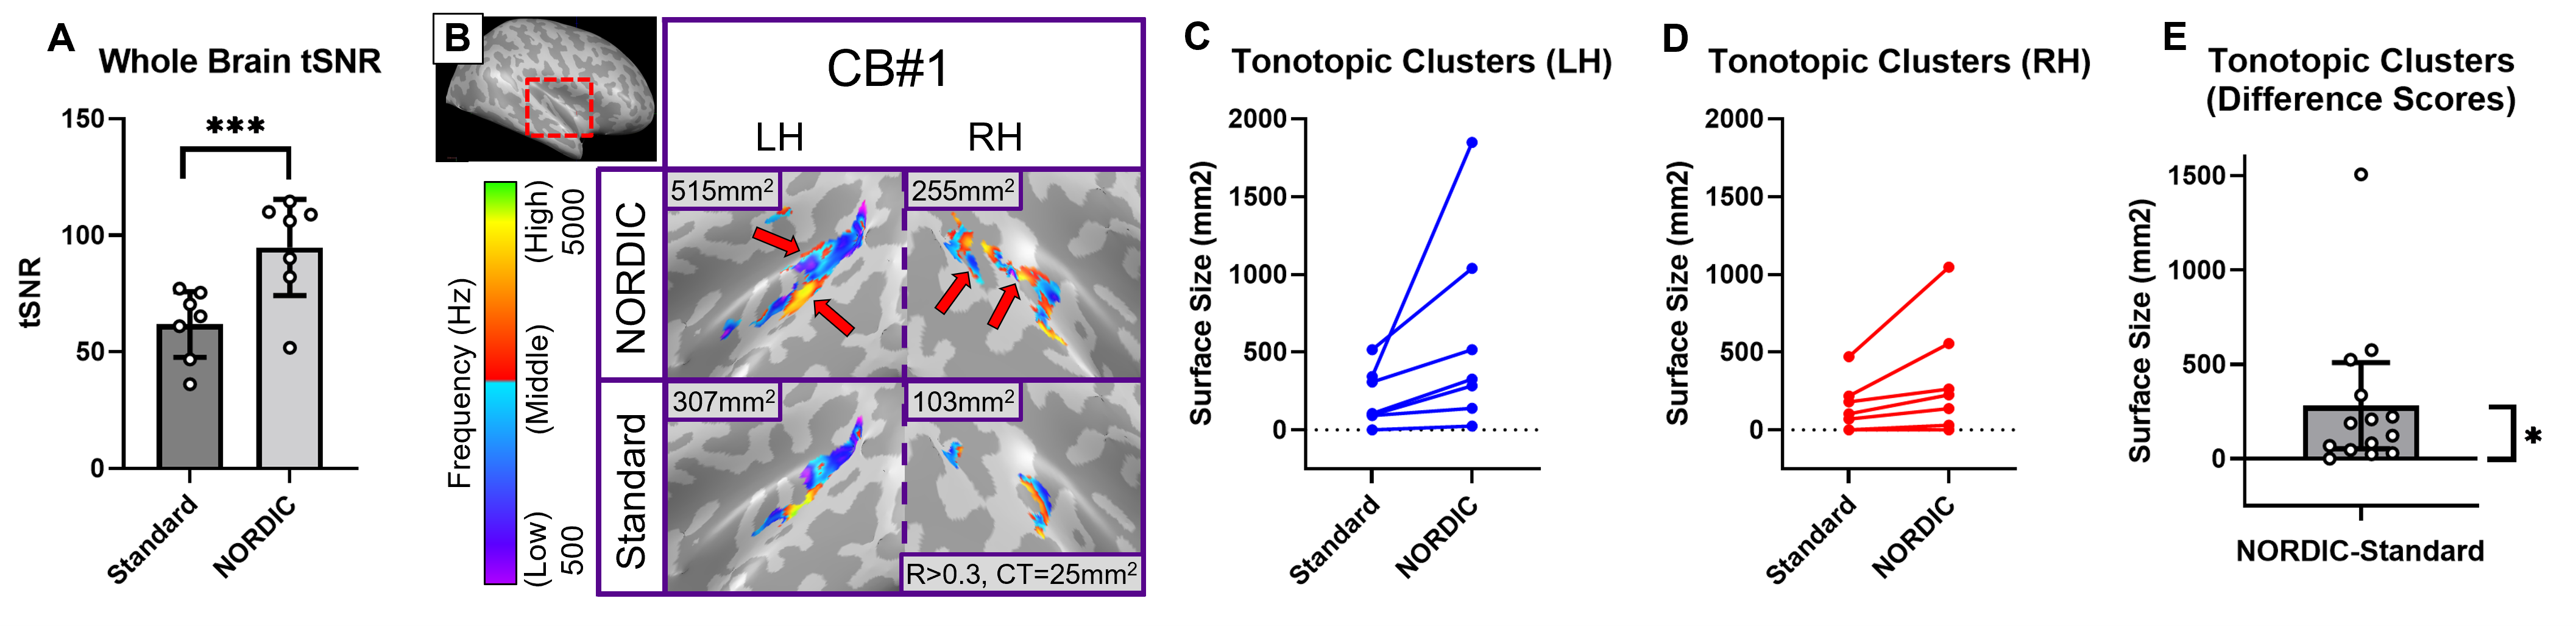
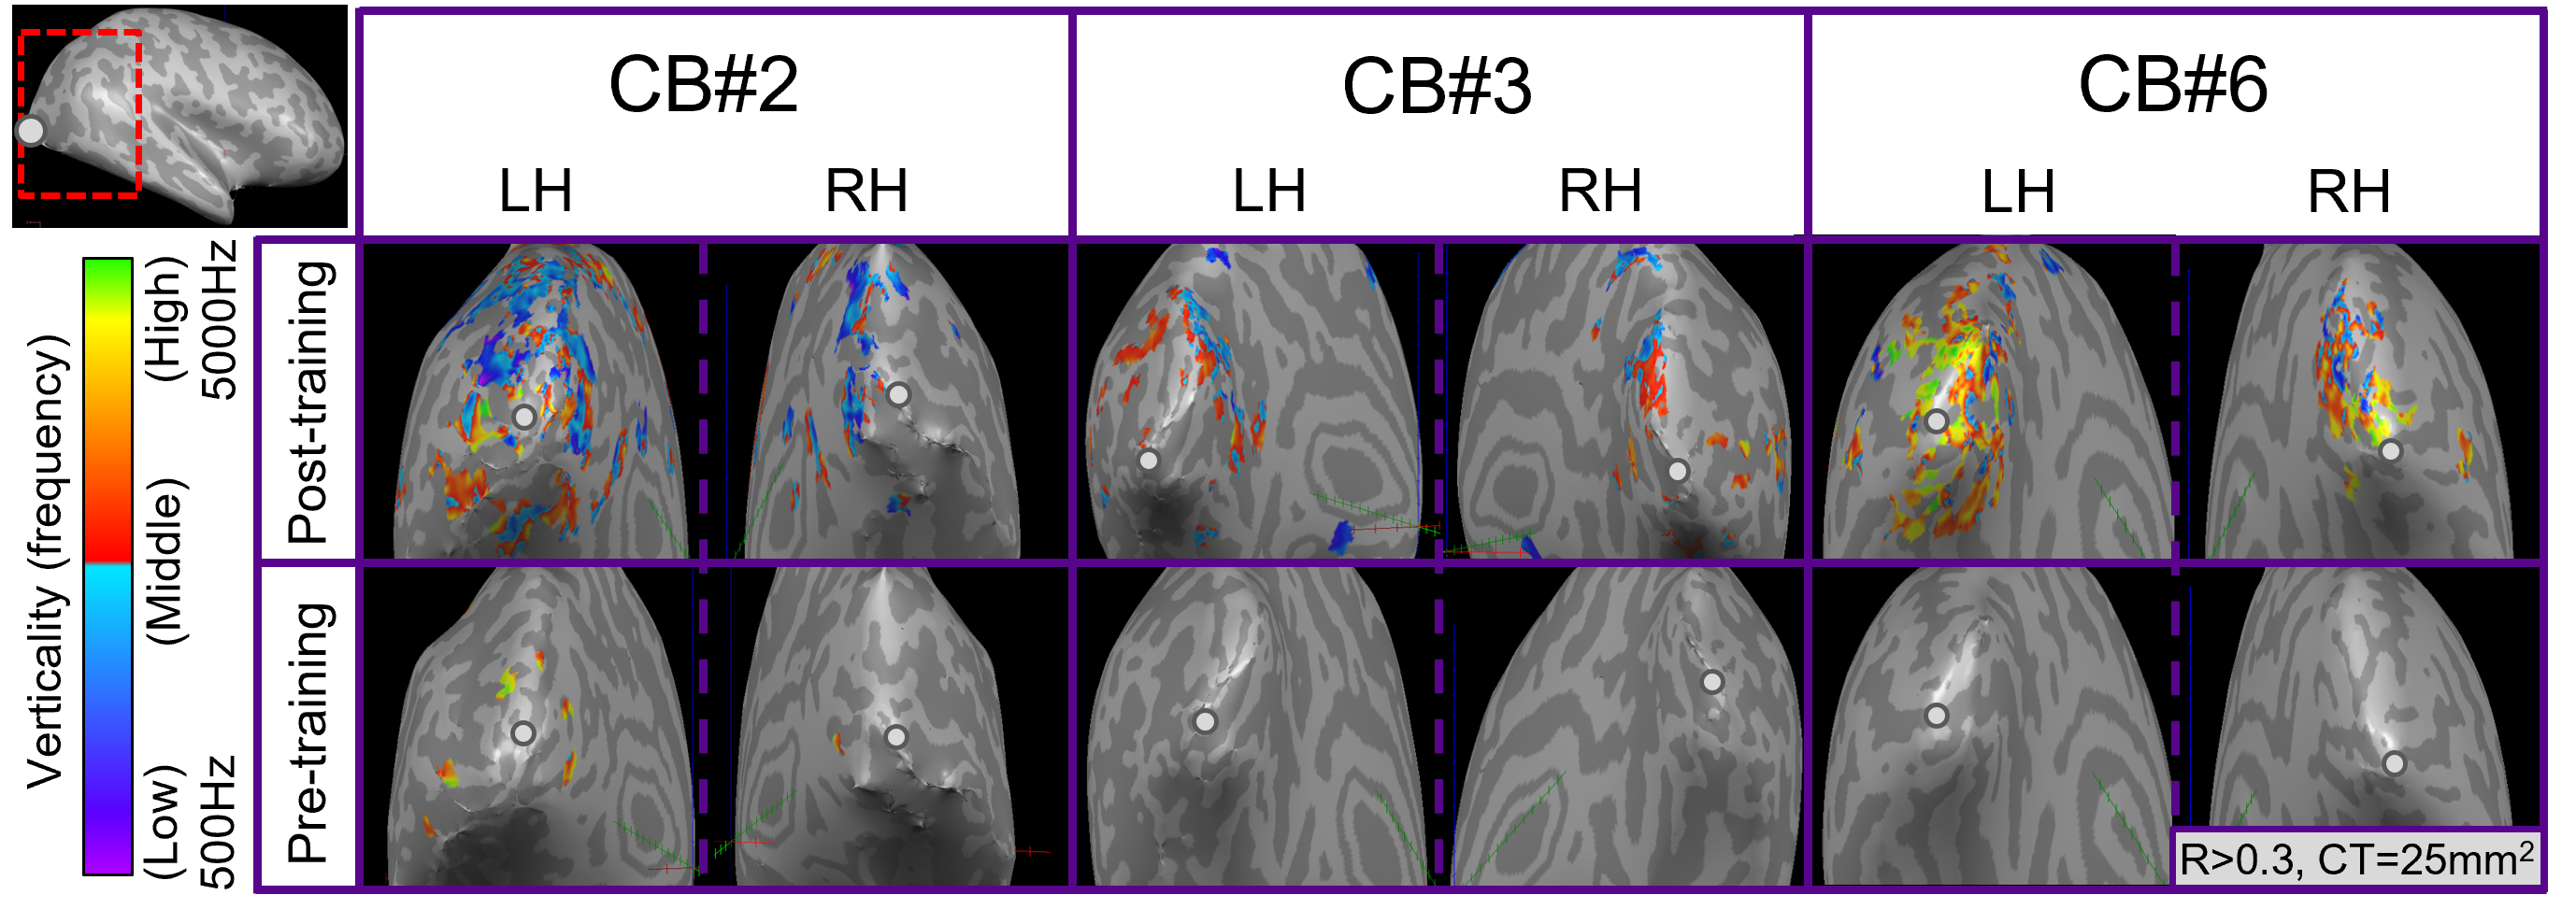
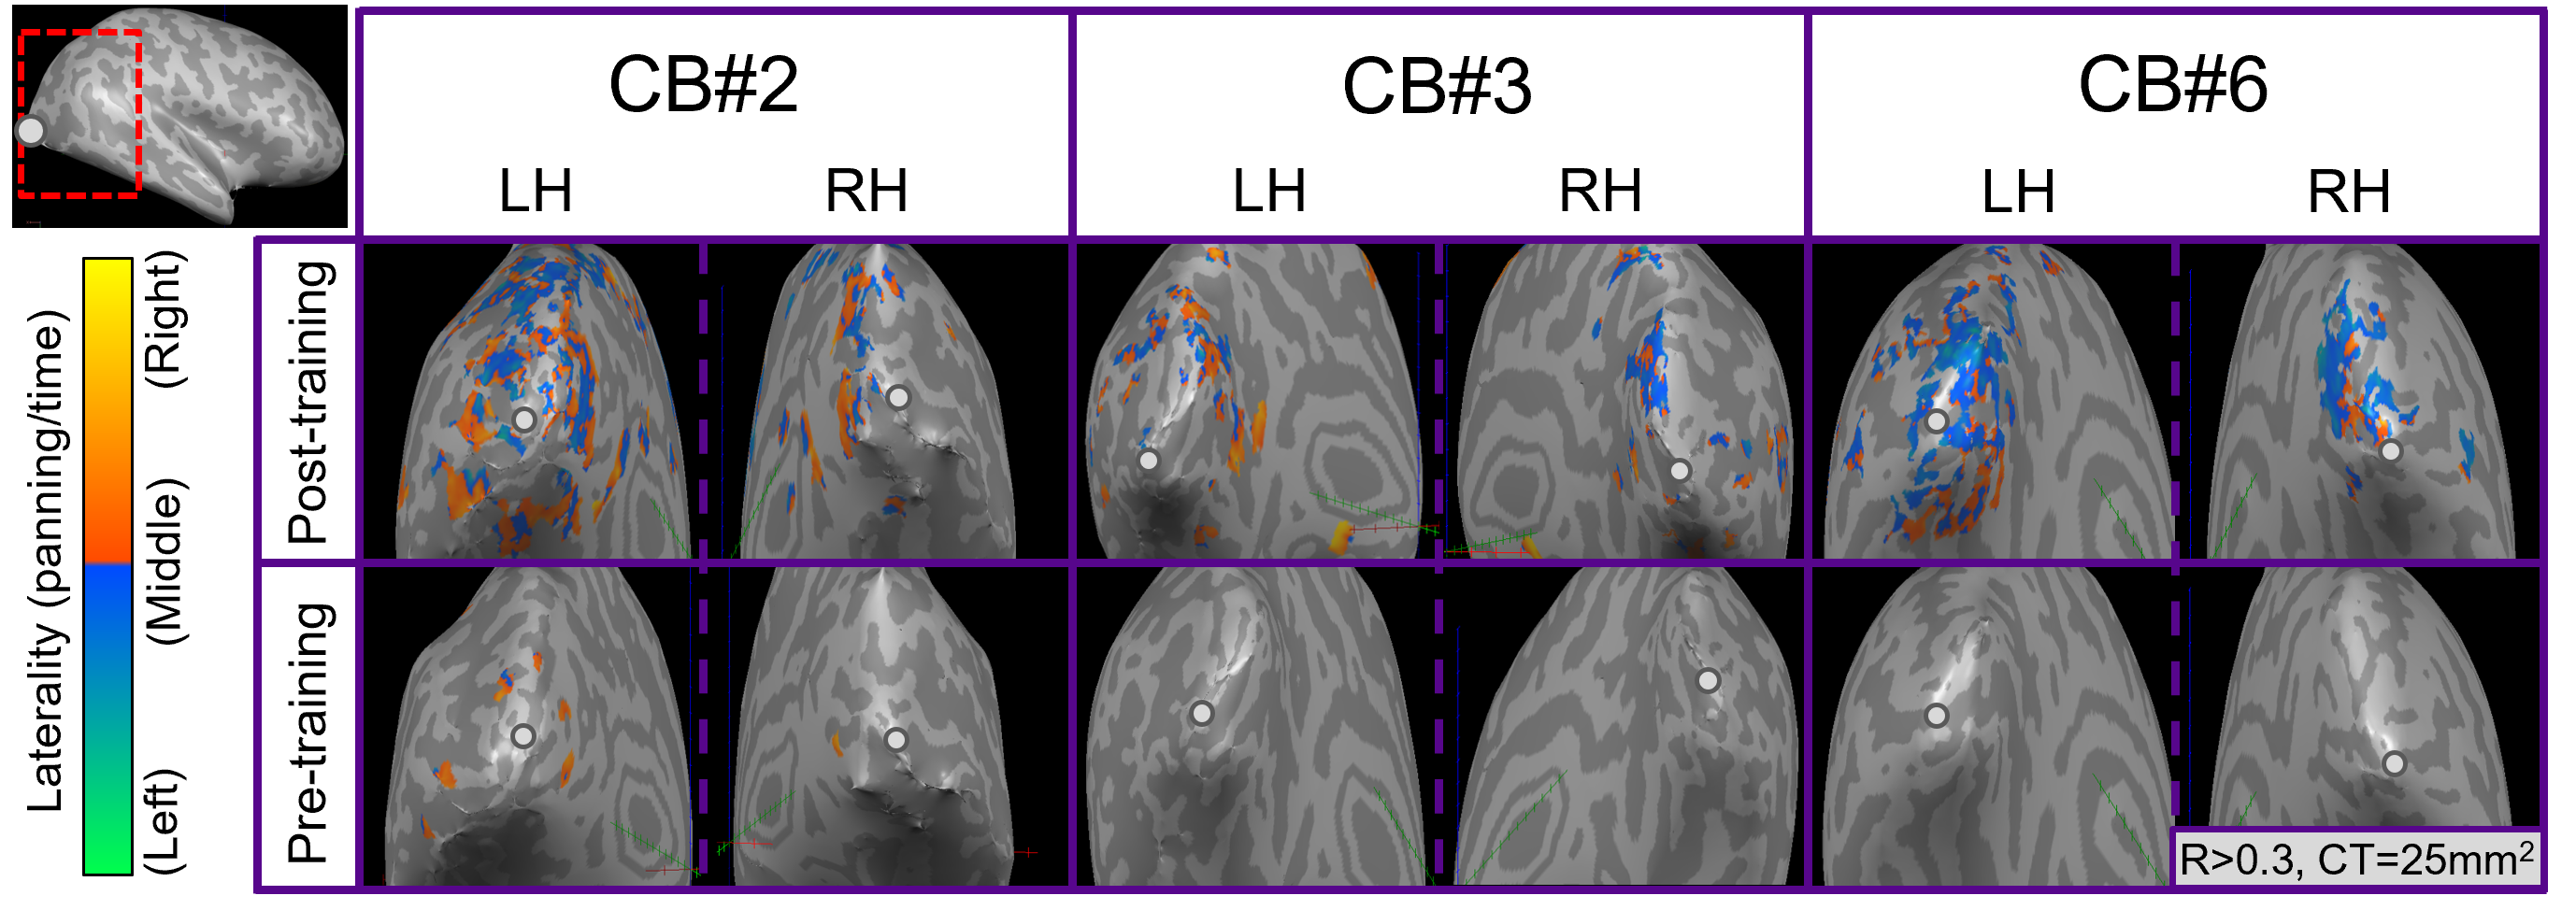
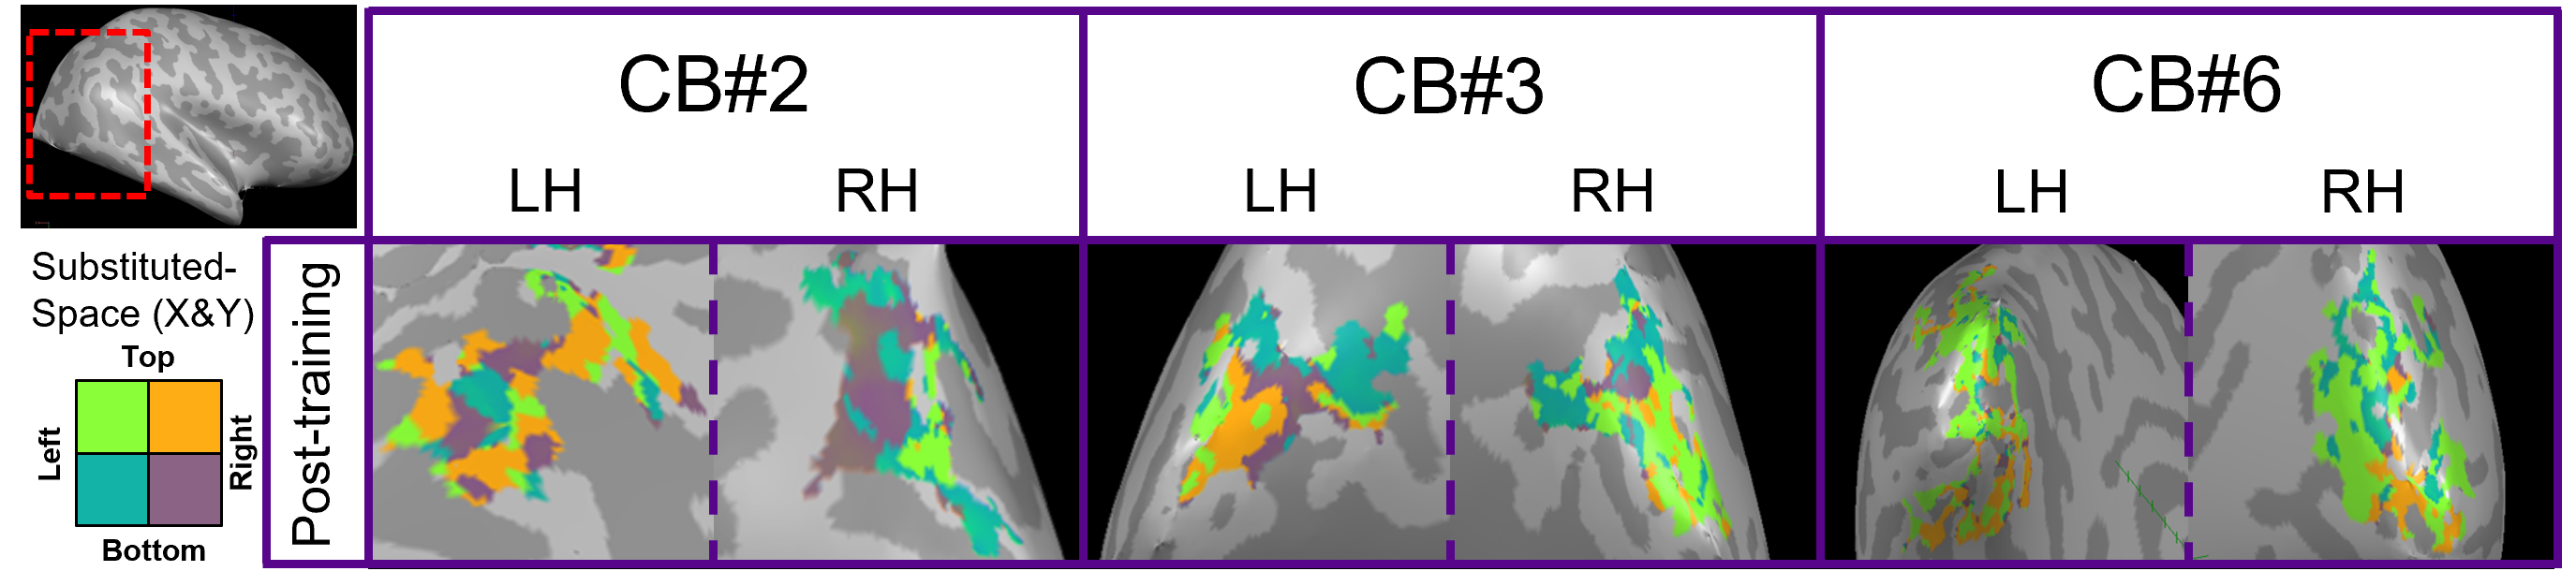
For post-training data, NORDIC processing significantly increased tSNR, t(6)=9.488, p=0.000078, d=1.76, Mdiff=33.01 (Figure 2A). NORDIC also significantly increased maximum cluster sizes at R>0.3 that showed tonotopic organization (Figure 2B, red-cyan borders) in the auditory cortices bilaterally, t(13)=2.654, p=0.019862, d=0.71, Mdiff=281.00mm2 (Figure 2B-E). NORDIC maintained similar tonotopic maps to standard pre-processing but expanded further (Figure 2B, red arrows).We evaluated ‘pre-training’ and ‘post-training’ datasets for topographic maps. This was defined as surface clusters showing responsivity to regions both above and below the horizontal midline of substituted-vision (Figure 3, red-cyan borders) as well as left and right of the vertical midline (Figure 4, blue-orange borders). Only the ‘post-training’ condition showed topographic maps in occipital-parietal regions bilaterally for 3/7 congenitally blind (R>0.3). Examinations of each hemisphere’s largest cluster showed that all 4 quadrants of substituted-vision were represented by spatially distinct regions (Figure 5).
Discussion
We show that NORDIC significantly increases tSNR and tonotopic cluster sizes at R>0.3 thresholds. Crucially, NORDIC maintains and expands tonotopic organizations observed during standard pre-processing, providing confidence in the validity of NORDIC-processed topographic maps. Future research should examine NORDIC’s effect on well-established topographic arrangements (e.g. retinotopy) for further confidence in NORDIC-pRF studies. For SSD studies, the heterogeneity of topographic maps may limit approaches to boost SNR (e.g. group averaging) and as such, NORDIC provides valuable utility in improving SNR for smaller/individual datasets.For 3/7 congenitally blind, topographic maps of substituted-space were rapidly generated post-training, indicating they may rely on pre-existing topographic organizations or ad-hoc functional networks, rather than requiring neural re-wiring or extensive structural changes over the longer-term. The congenitally blind show evidence of ‘retinotopic’ organization within the visual cortex during resting states14, so future work could explore topographic-similarities with substituted-vision.
Conclusion
NORDIC pre-processing increases tSNR and expands pRF-derived tonotopic map sizes while maintaining the tonotopic organization found in standard pre-processing. Brief SSD training produces large occipital-parietal topographic maps of substituted-vision in 3/7 congenitally blind subjects, indicating rapid cross-modal organization during new sense learning.Acknowledgements
This work was supported in part by the National Institutes of Health R01-EY028125 and (Bethesda, Maryland); United States Department of Defense W81XWH2110615; and an unrestricted grant from Research to Prevent Blindness to NYU Langone Health Department of Ophthalmology (New York, New York).References
1. Meijer, P. B., An experimental system for auditory image representations. IEEE transactions on biomedical engineering, 1992. 39(2): p. 112-121.
2. Murphy M.C., et al., Top-down influence on the visual cortex of the blind during sensory substitution. NeuroImage, 2016. 125: p. 932-940.
3. Amedi A., et al., Shape conveyed by visual-to-auditory sensory substitution activates the lateral occipital complex. Nature neuroscience, 2007. 10(6): p. 687-689.
4. Striem-Amit E., et al., Reading with sounds: sensory substitution selectively activates the visual word form area in the blind. Neuron, 2012. 76(3): p. 640-652.
5. Striem-Amit E., Amedi A., Visual cortex extrastriate body-selective area activation in congenitally blind people “seeing” by using sounds. Current Biology, 2014. 24(6): p. 687-692.
6. Puckett A.M., et al., Bayesian population receptive field modeling in human somatosensory cortex. Neuroimage, 2020. 208: 116465.
7. Thomas J.M., et al., Population receptive field estimates of human auditory cortex. Neuroimage, 2015. 105:428-439.
8. Dumoulin S.O., Wandell B.A., Population receptive field estimates in human visual cortex. Neuroimage, 2008. 39(2): p. 647-660.
9. Norman L.J., Thaler L., Retinotopic-like maps of spatial sound in primary ‘visual’cortex of blind human echolocators. Proceedings of the Royal Society B, 2019. 286(1912): p. 20191910.
10. Ptito M., et al., TMS of the occipital cortex induces tactile sensations in the fingers of blind Braille readers. Experimental brain research, 2008. 184(2): p. 193-200.
11. Kupers R., et al., Transcranial magnetic stimulation of the visual cortex induces somatotopically organized qualia in blind subjects. Proceedings of the National Academy of Sciences, 2006. 103(35): p. 13256-13260.
12. Hofstetter S., et al., Topographic maps and neural tuning for sensory substitution dimensions learned in adulthood in a congenital blind subject. NeuroImage, 2021. 235: p. 118029.
13. Vizioli L., et al., Lowering the thermal noise barrier in functional brain mapping with magnetic resonance imaging. Nature communications, 2021. 12(1): p. 1-5.
14. Striem-Amit E., et al., Functional connectivity of visual cortex in the blind follows retinotopic organization principles. Brain, 2015. 138(6):1679-1695.
Figures