2043
Assessment of microstructural changes associated with dyskinesia in hemiparkinsonian rodents1Neuroimaging Division, Barrow Neurological Institute, Phoenix, AZ, United States, 2Translational Neuroscience, Barrow Neurological Institute, Phoenix, AZ, United States, 3Department of Psychology, Binghamton University, Binghamton, NY, United States
Synopsis
The objective of this pilot study was to assess white matter (WM) microstructural integrity in pre-clinical models of Parkinson’s disease using fractional anisotropy (FA) from diffusion tensor imaging (DTI). We assessed changes in FA in parkinsonian rats with levodopa-induced dyskinesia both over time and compared with control (sham) rats.
Introduction
Parkinson’s disease (PD) is a neurodegenerative disease that leads to significant disability and morbidity1. Levodopa (L-DOPA) is one of the primary pharmacological treatments for PD and functions to alleviate the classic motor symptoms. Unfortunately, long-term efficacy of L-DOPA is limited, and up to 90% of patients develop L-DOPA-induced dyskinesias (LID) within ten years2. Moreover, the dyskinetic state is also associated with numerous neuropsychiatric complications, likely the result of changes in corticolimbic connectivity. While the mechanisms underlying the development of LID, and associated symptoms, remain poorly understood, there is increasing recognition that dopaminergic and serotonergic signaling dysfunction may play a role3. MRI can be used to assess WM microstructural alterations using DTI-based FA, which has been used extensively to understand WM changes in patients with PD4. Additionally, bilaterally increased FA has previously been reported in the 6-hydroxydopamine (6-OHDA) rat model of parkinsonism5, while PD patients with LID demonstrated higher FA in the uncinate fasciculus than PD patients without LID6. In this pilot study, we assessed longitudinal WM changes using FA between Sham, 6-OHDA with LID, and 6-OHDA without LID rats over a period of 8 weeks.Methods
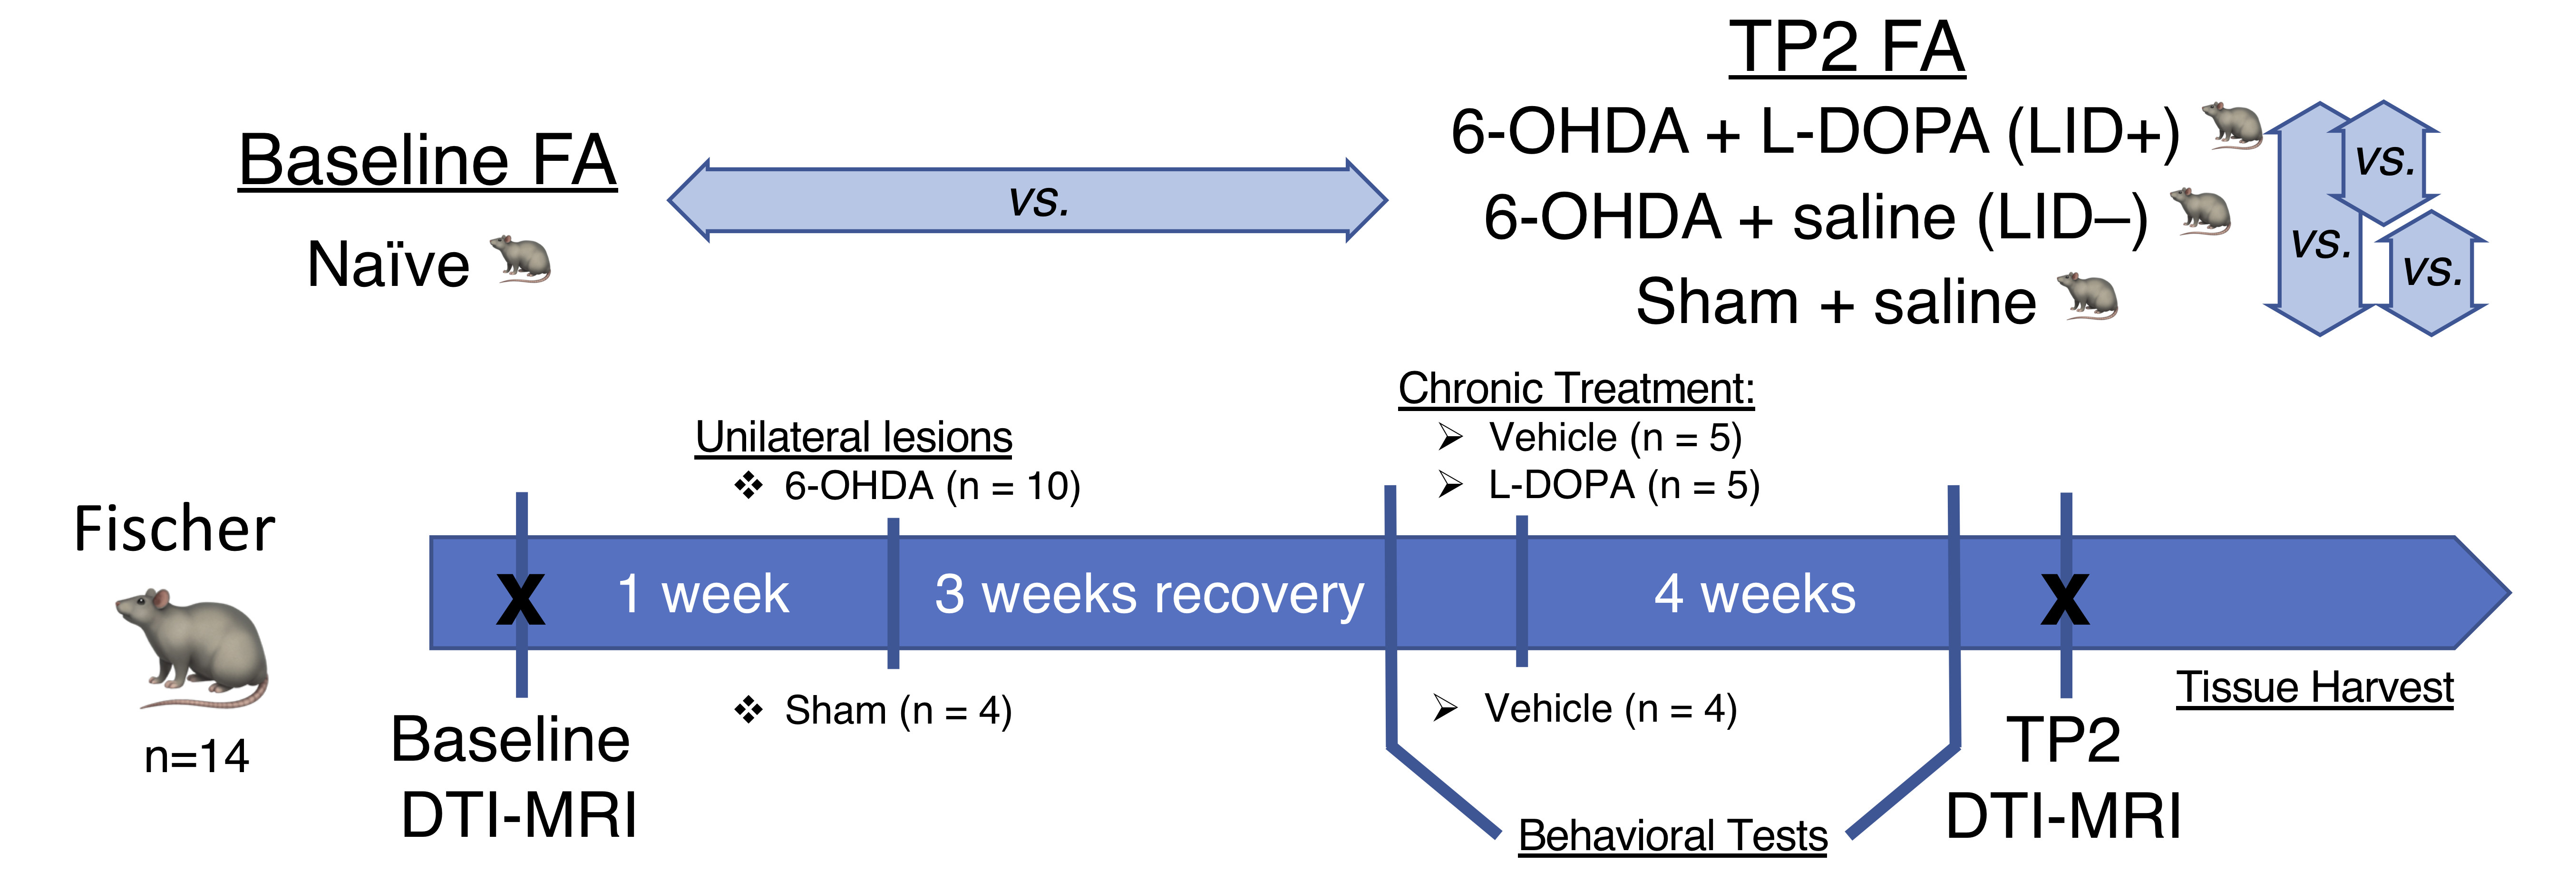
Fourteen Fischer rats were included in this study (see Figure 1). All animals were scanned at baseline (naïve); subsequently, rats (n=10) were rendered hemi-parkinsonian using unilateral injection of 6-OHDA (10 µg/injection) into the medial forebrain bundle (MFB) and substantia nigra (SN). Sham rats (n=4) received an injection of vehicle (0.2 mg/ml ascorbic acid in 0.9% saline). After 6 weeks, 6-OHDA rats received daily injections for 2 weeks of either saline (0.9% NaCl) or an LID-inducing L-DOPA regimen (10mg/kg, plus 12 mg/kg benserazide), while Sham rats received saline (0.9% NaCl) injections. Eight weeks after the baseline scan (TP2), all animals were scanned again, with the following groups: Lesion + L-DOPA (LID+) (n=5), Lesion + Saline (LID-) (n=5), and Sham + Saline (n=4). MRI was performed at 7T (Bruker Biospec 70/30) under anesthesia using isoflurane (1.50-1.75%). DTI was performed with 30 directions at b = 670 s/mm2, plus 5 B0 images. Other scan parameters include TE: 24.9 ms, TR: 11.25 s, and spatial resolution of 0.2x0.2x0.5 mm3.The diffusion images were denoised and corrected for eddy currents using MRtrix3 (https://www.mrtrix.org/) and FSL (https://fsl.fmrib.ox.ac.uk/fsl/fslwiki). FA maps were created by a weighted linear fitting procedure and were coregistered to a standard space (SIGMA template)7 using ANTs (http://stnava.github.io/ANTs/), followed by voxel-based analysis. Two-way mixed ANOVA analysis (using R and R-studio) was used to analyze group and time main effects and their interaction (with FDR-correction). Post-hoc analyses for time and group were also investigated with Bonferroni correction.Results
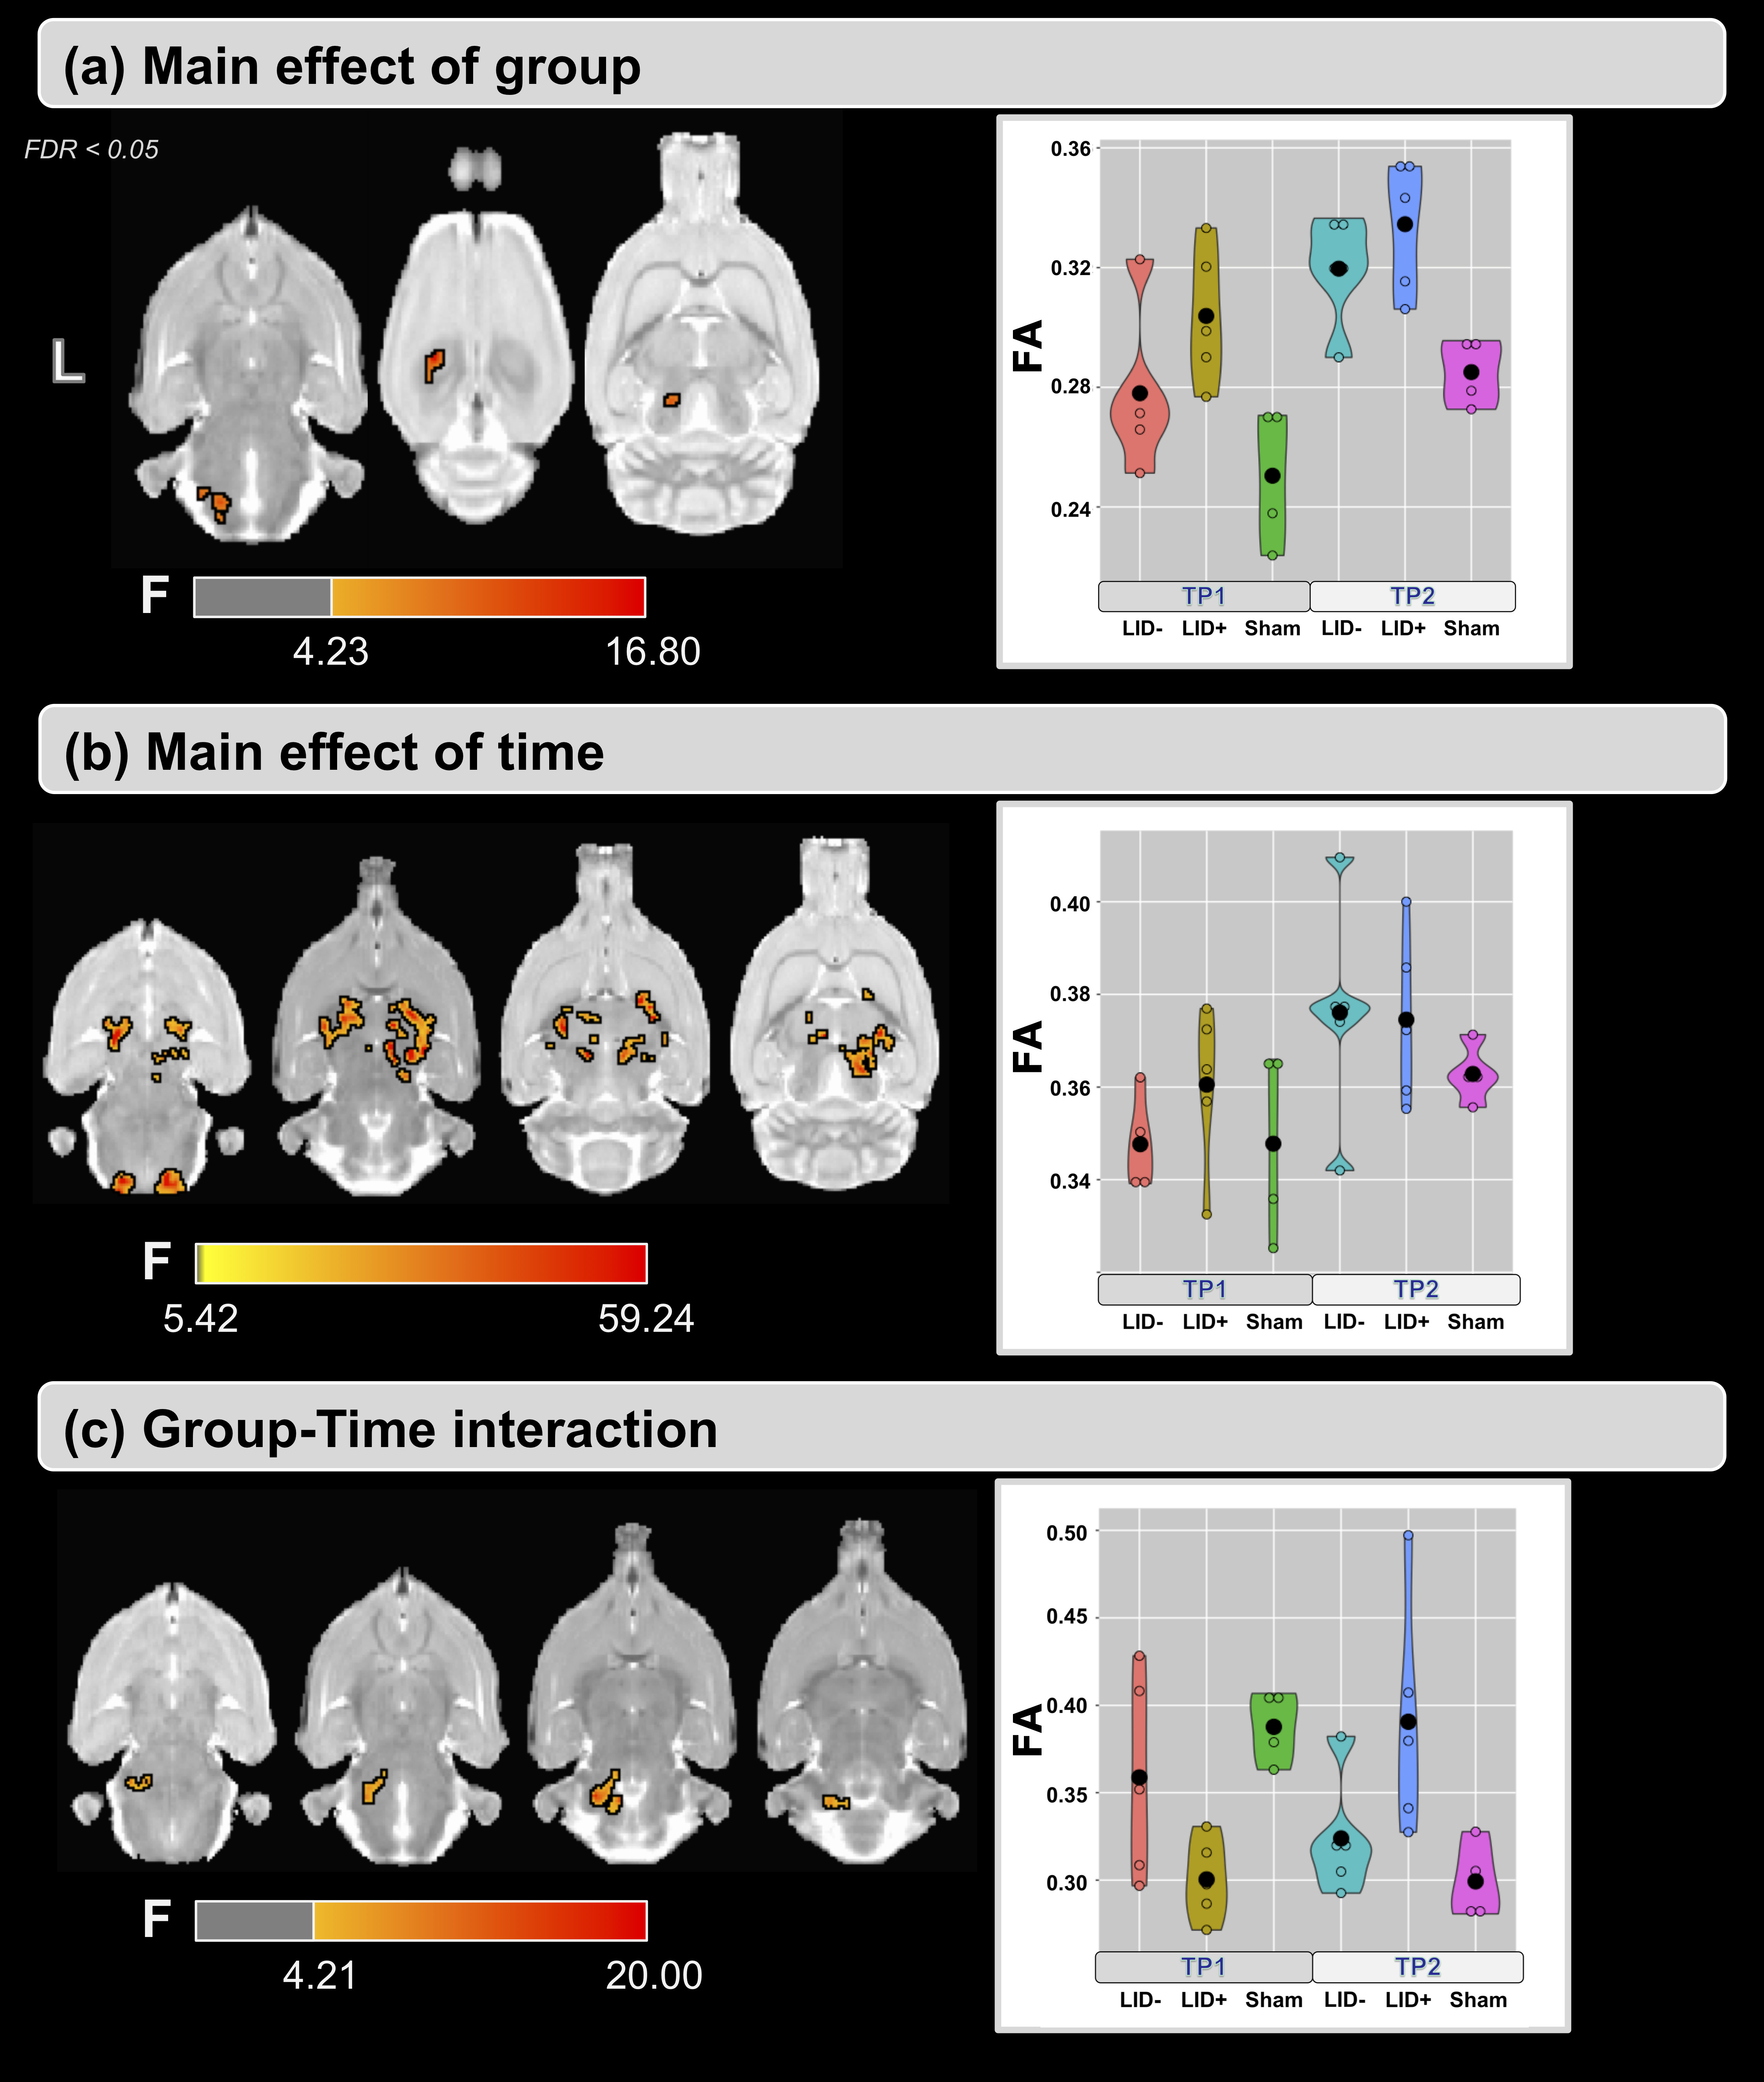
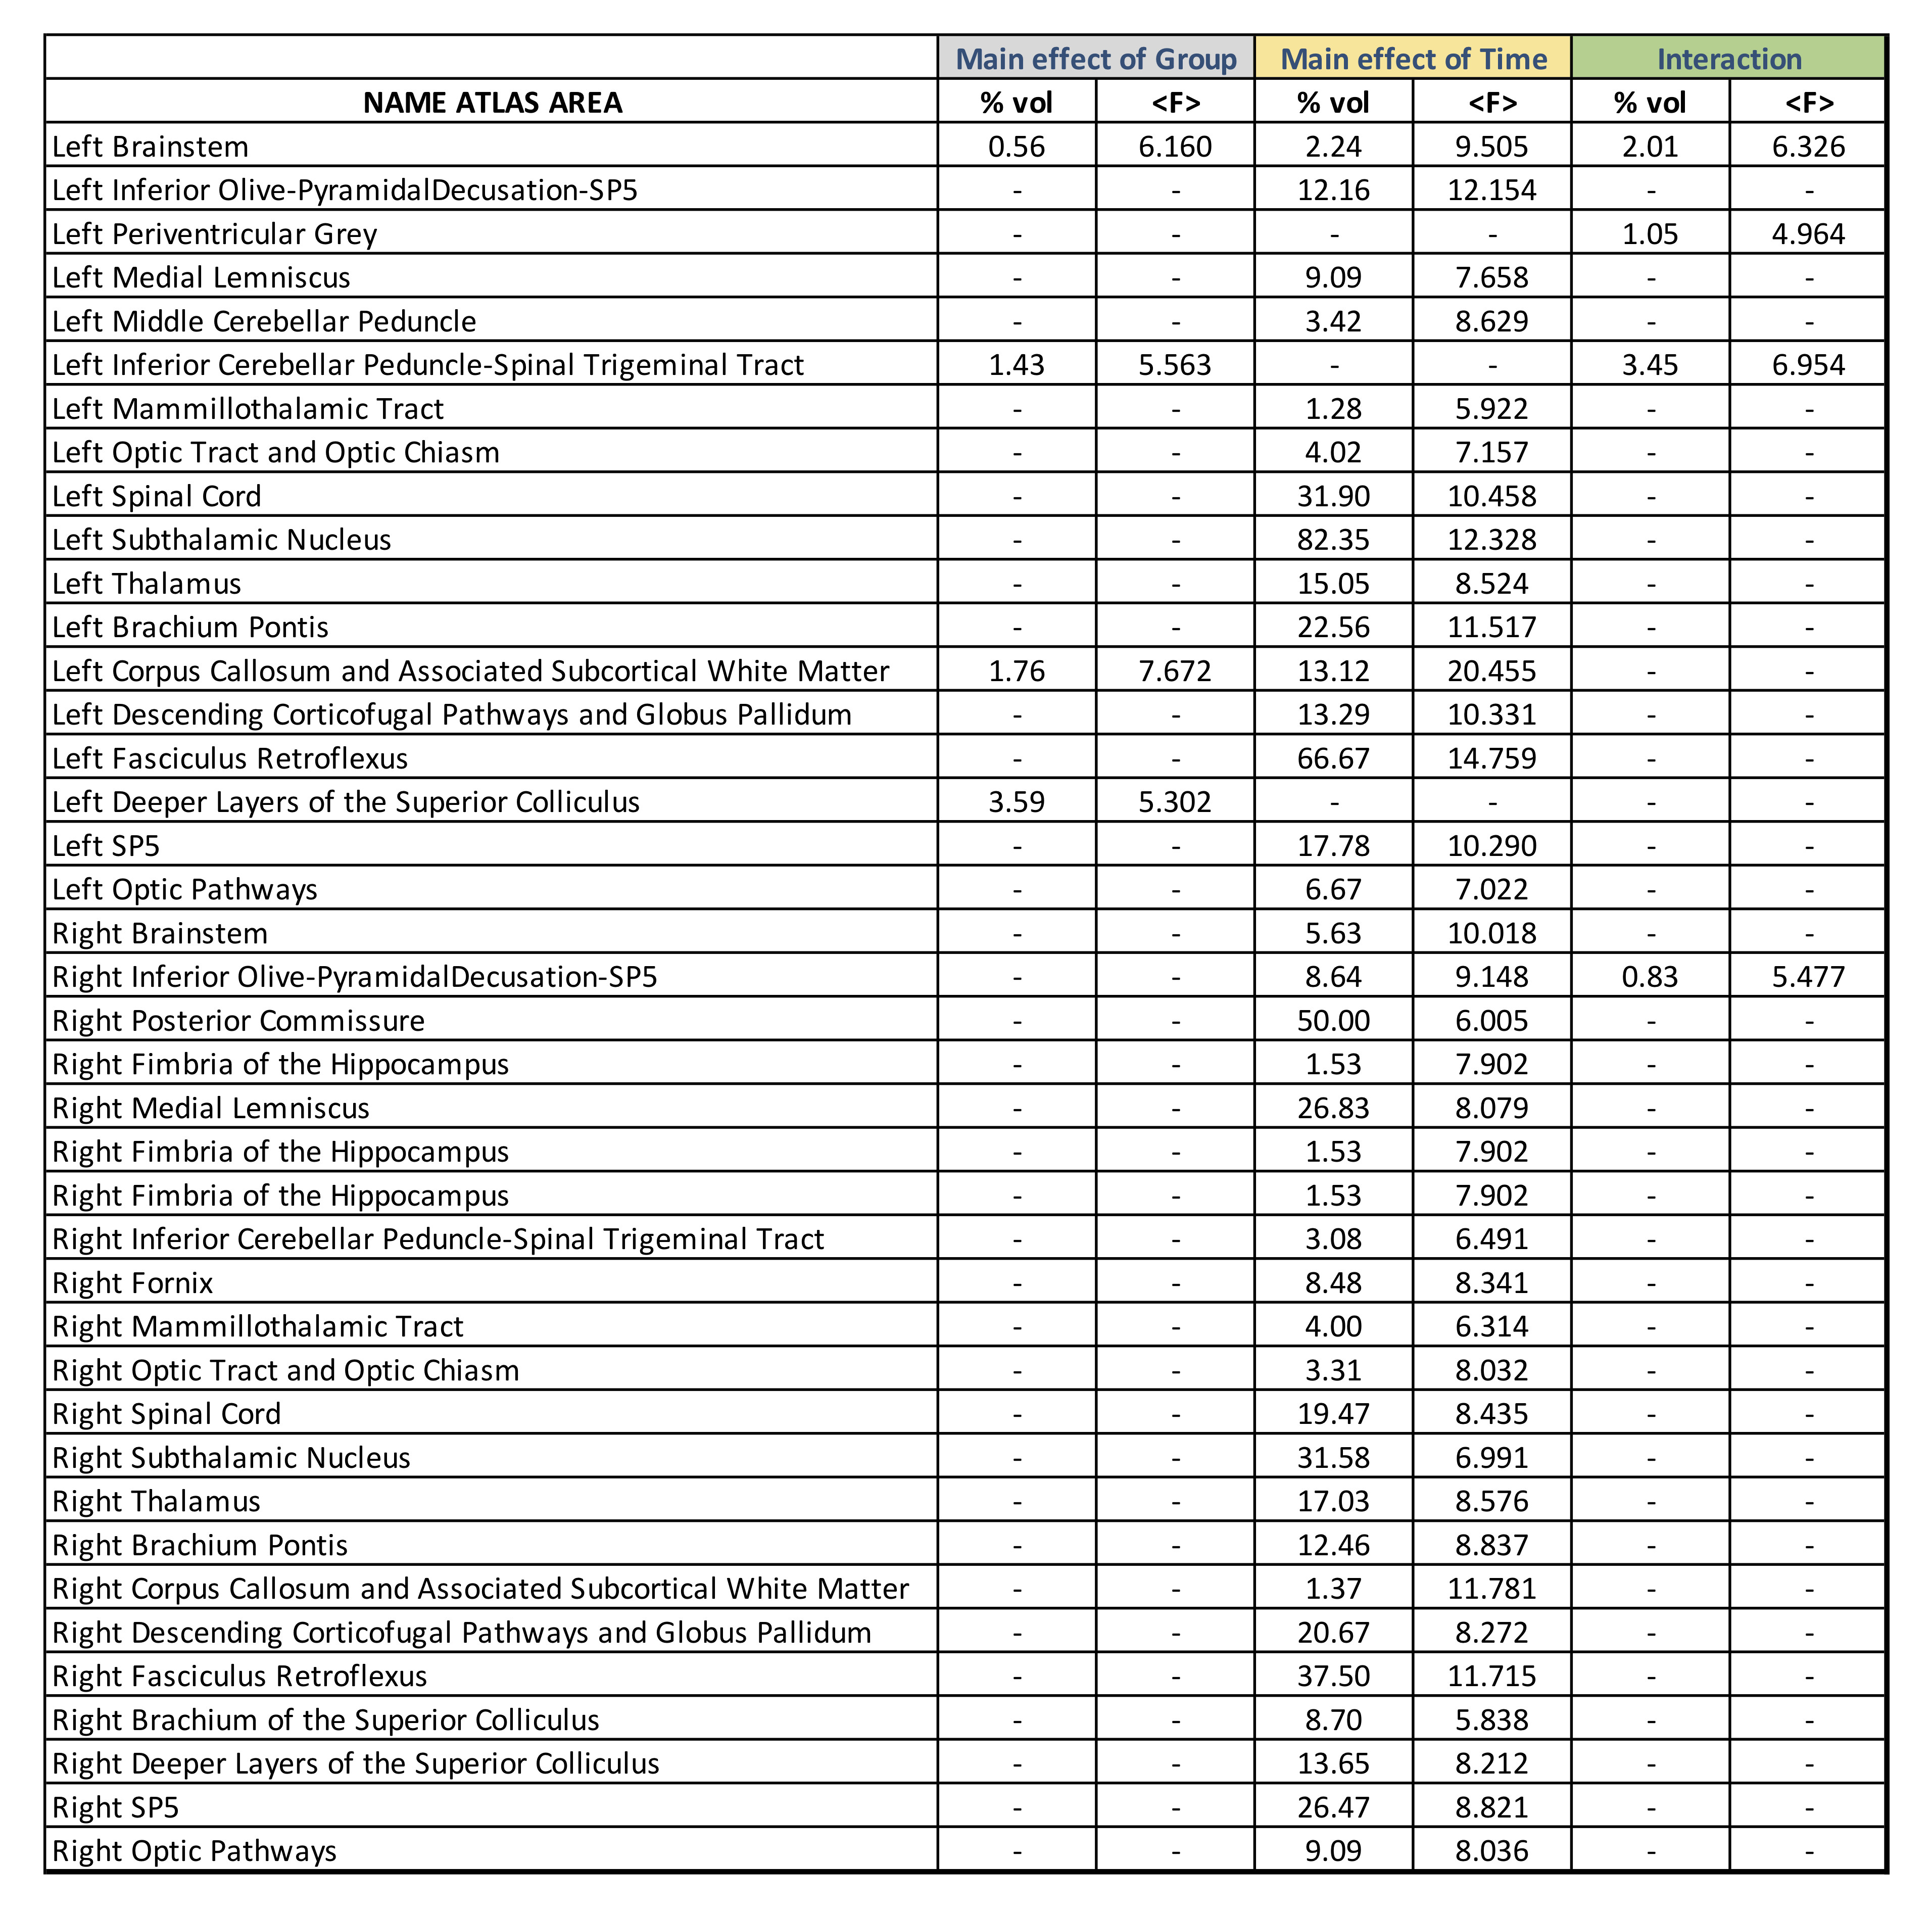
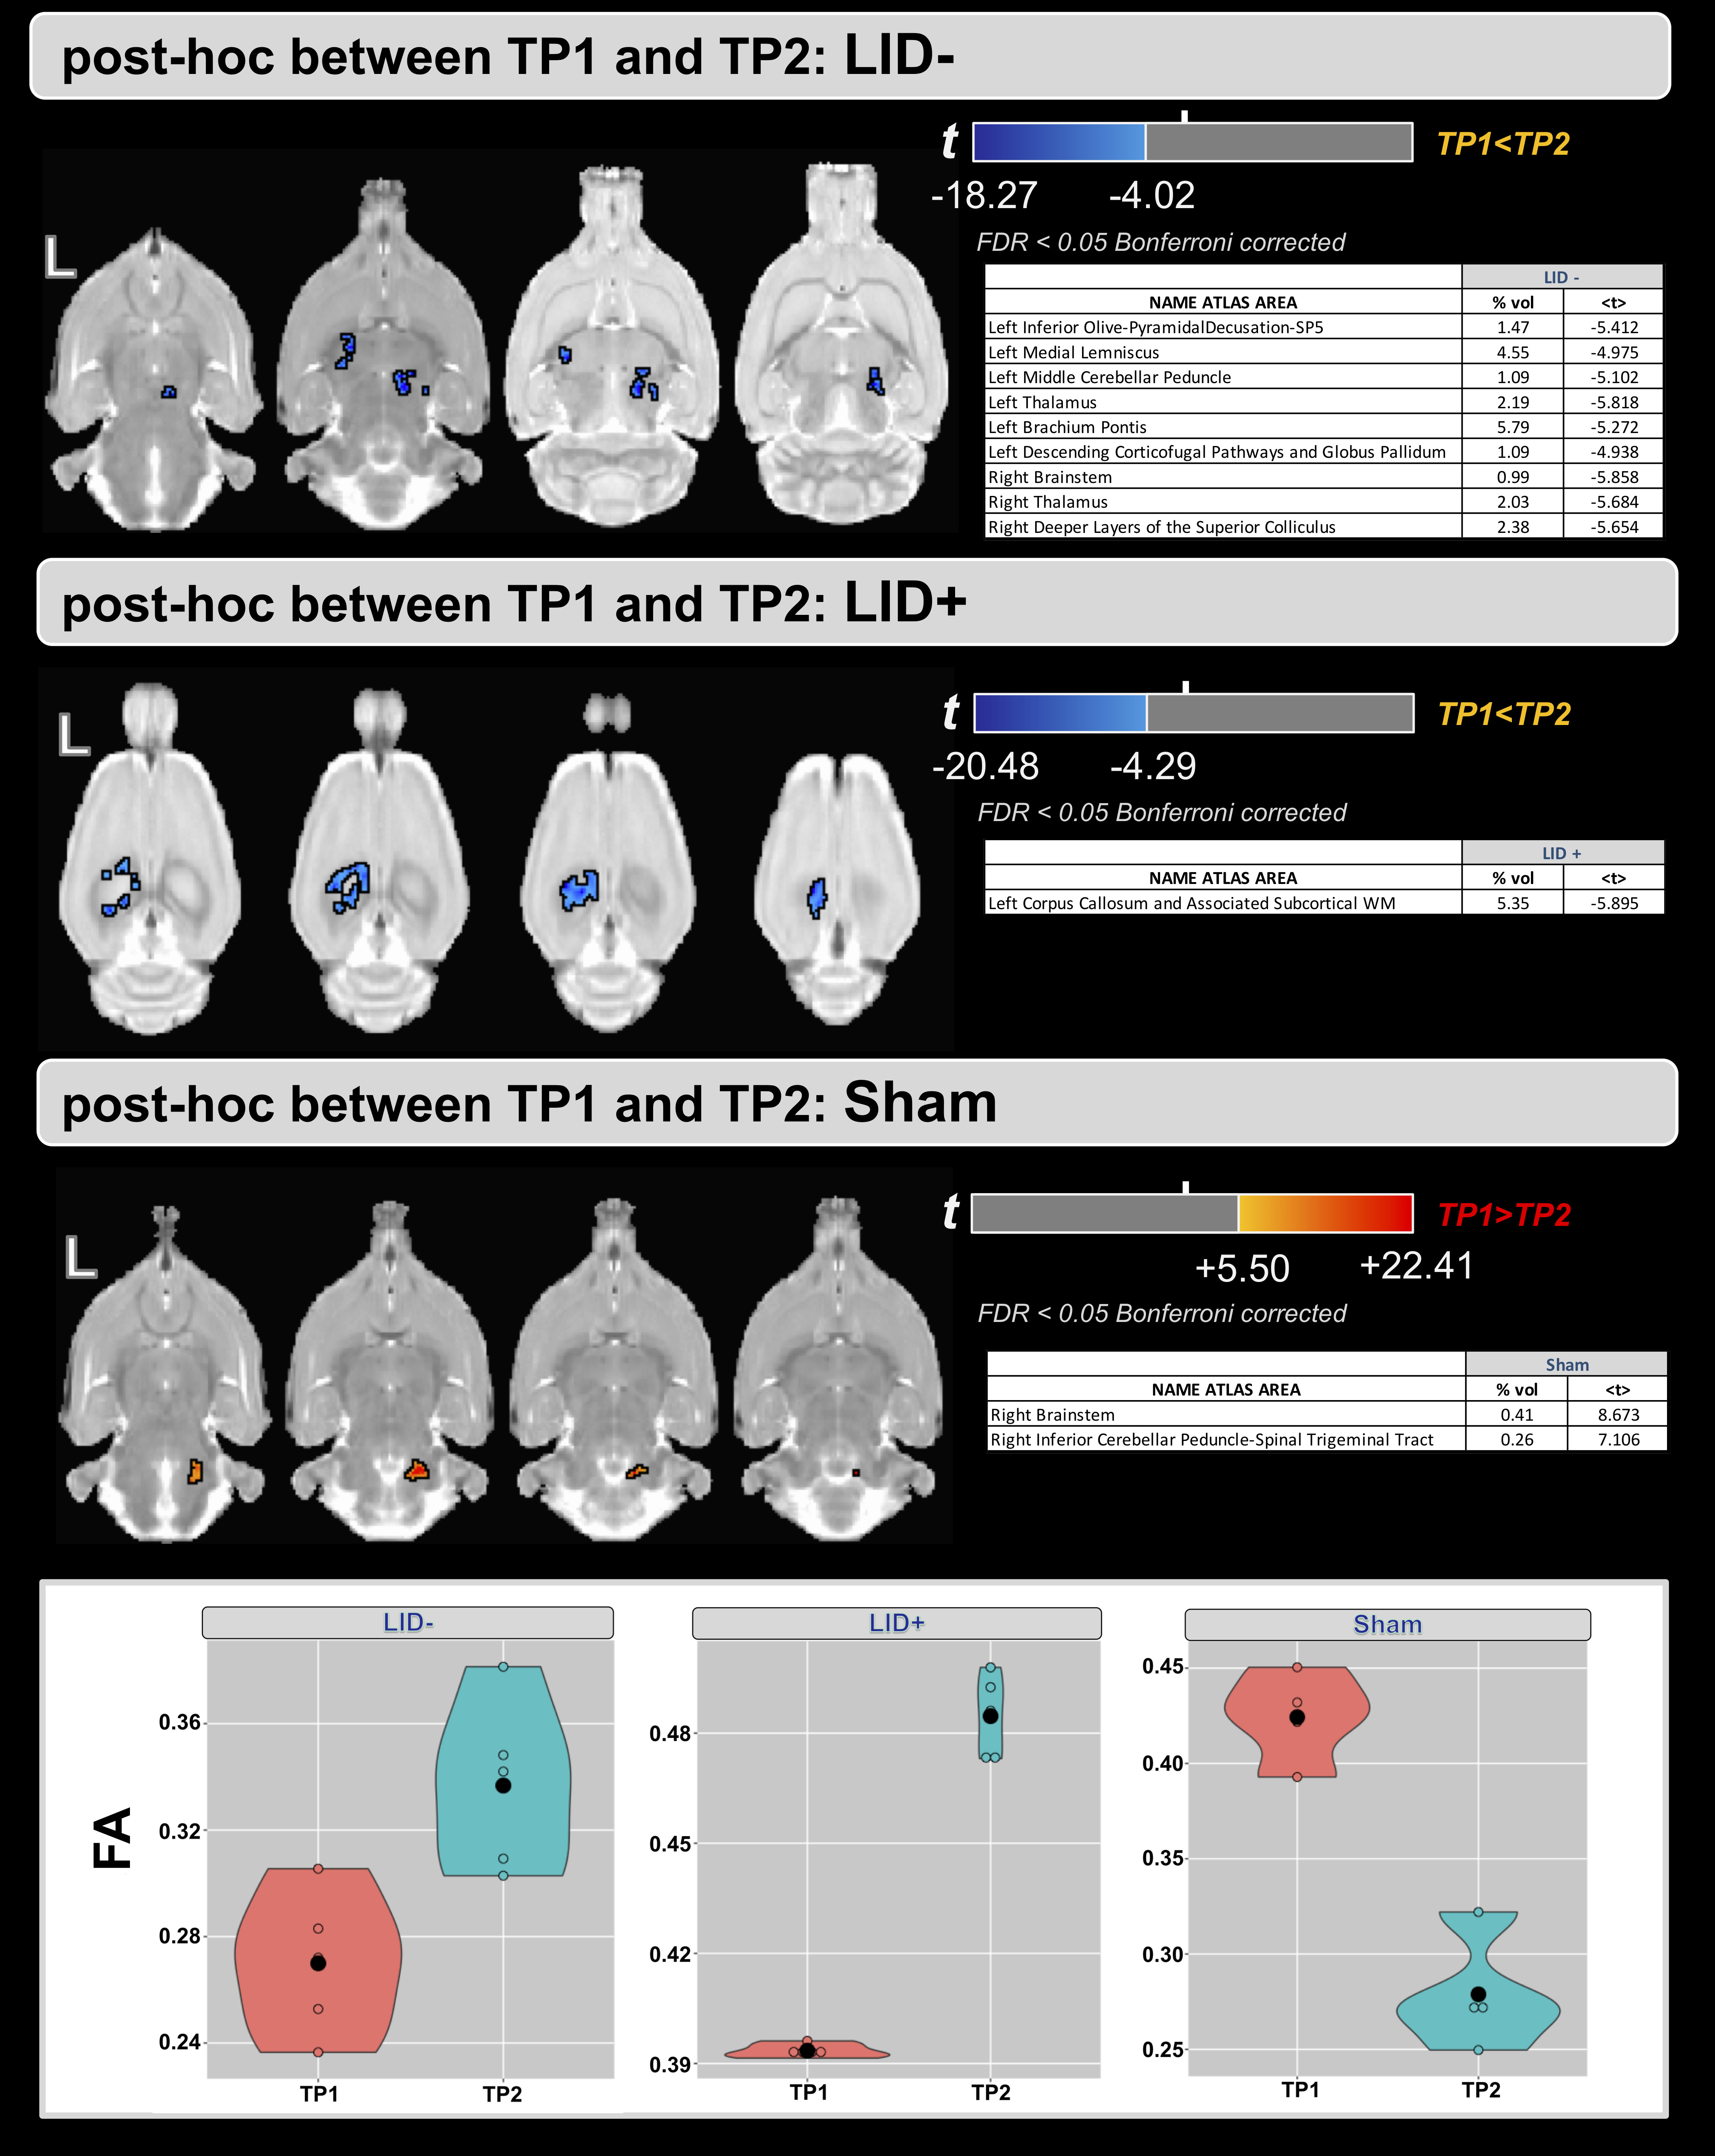
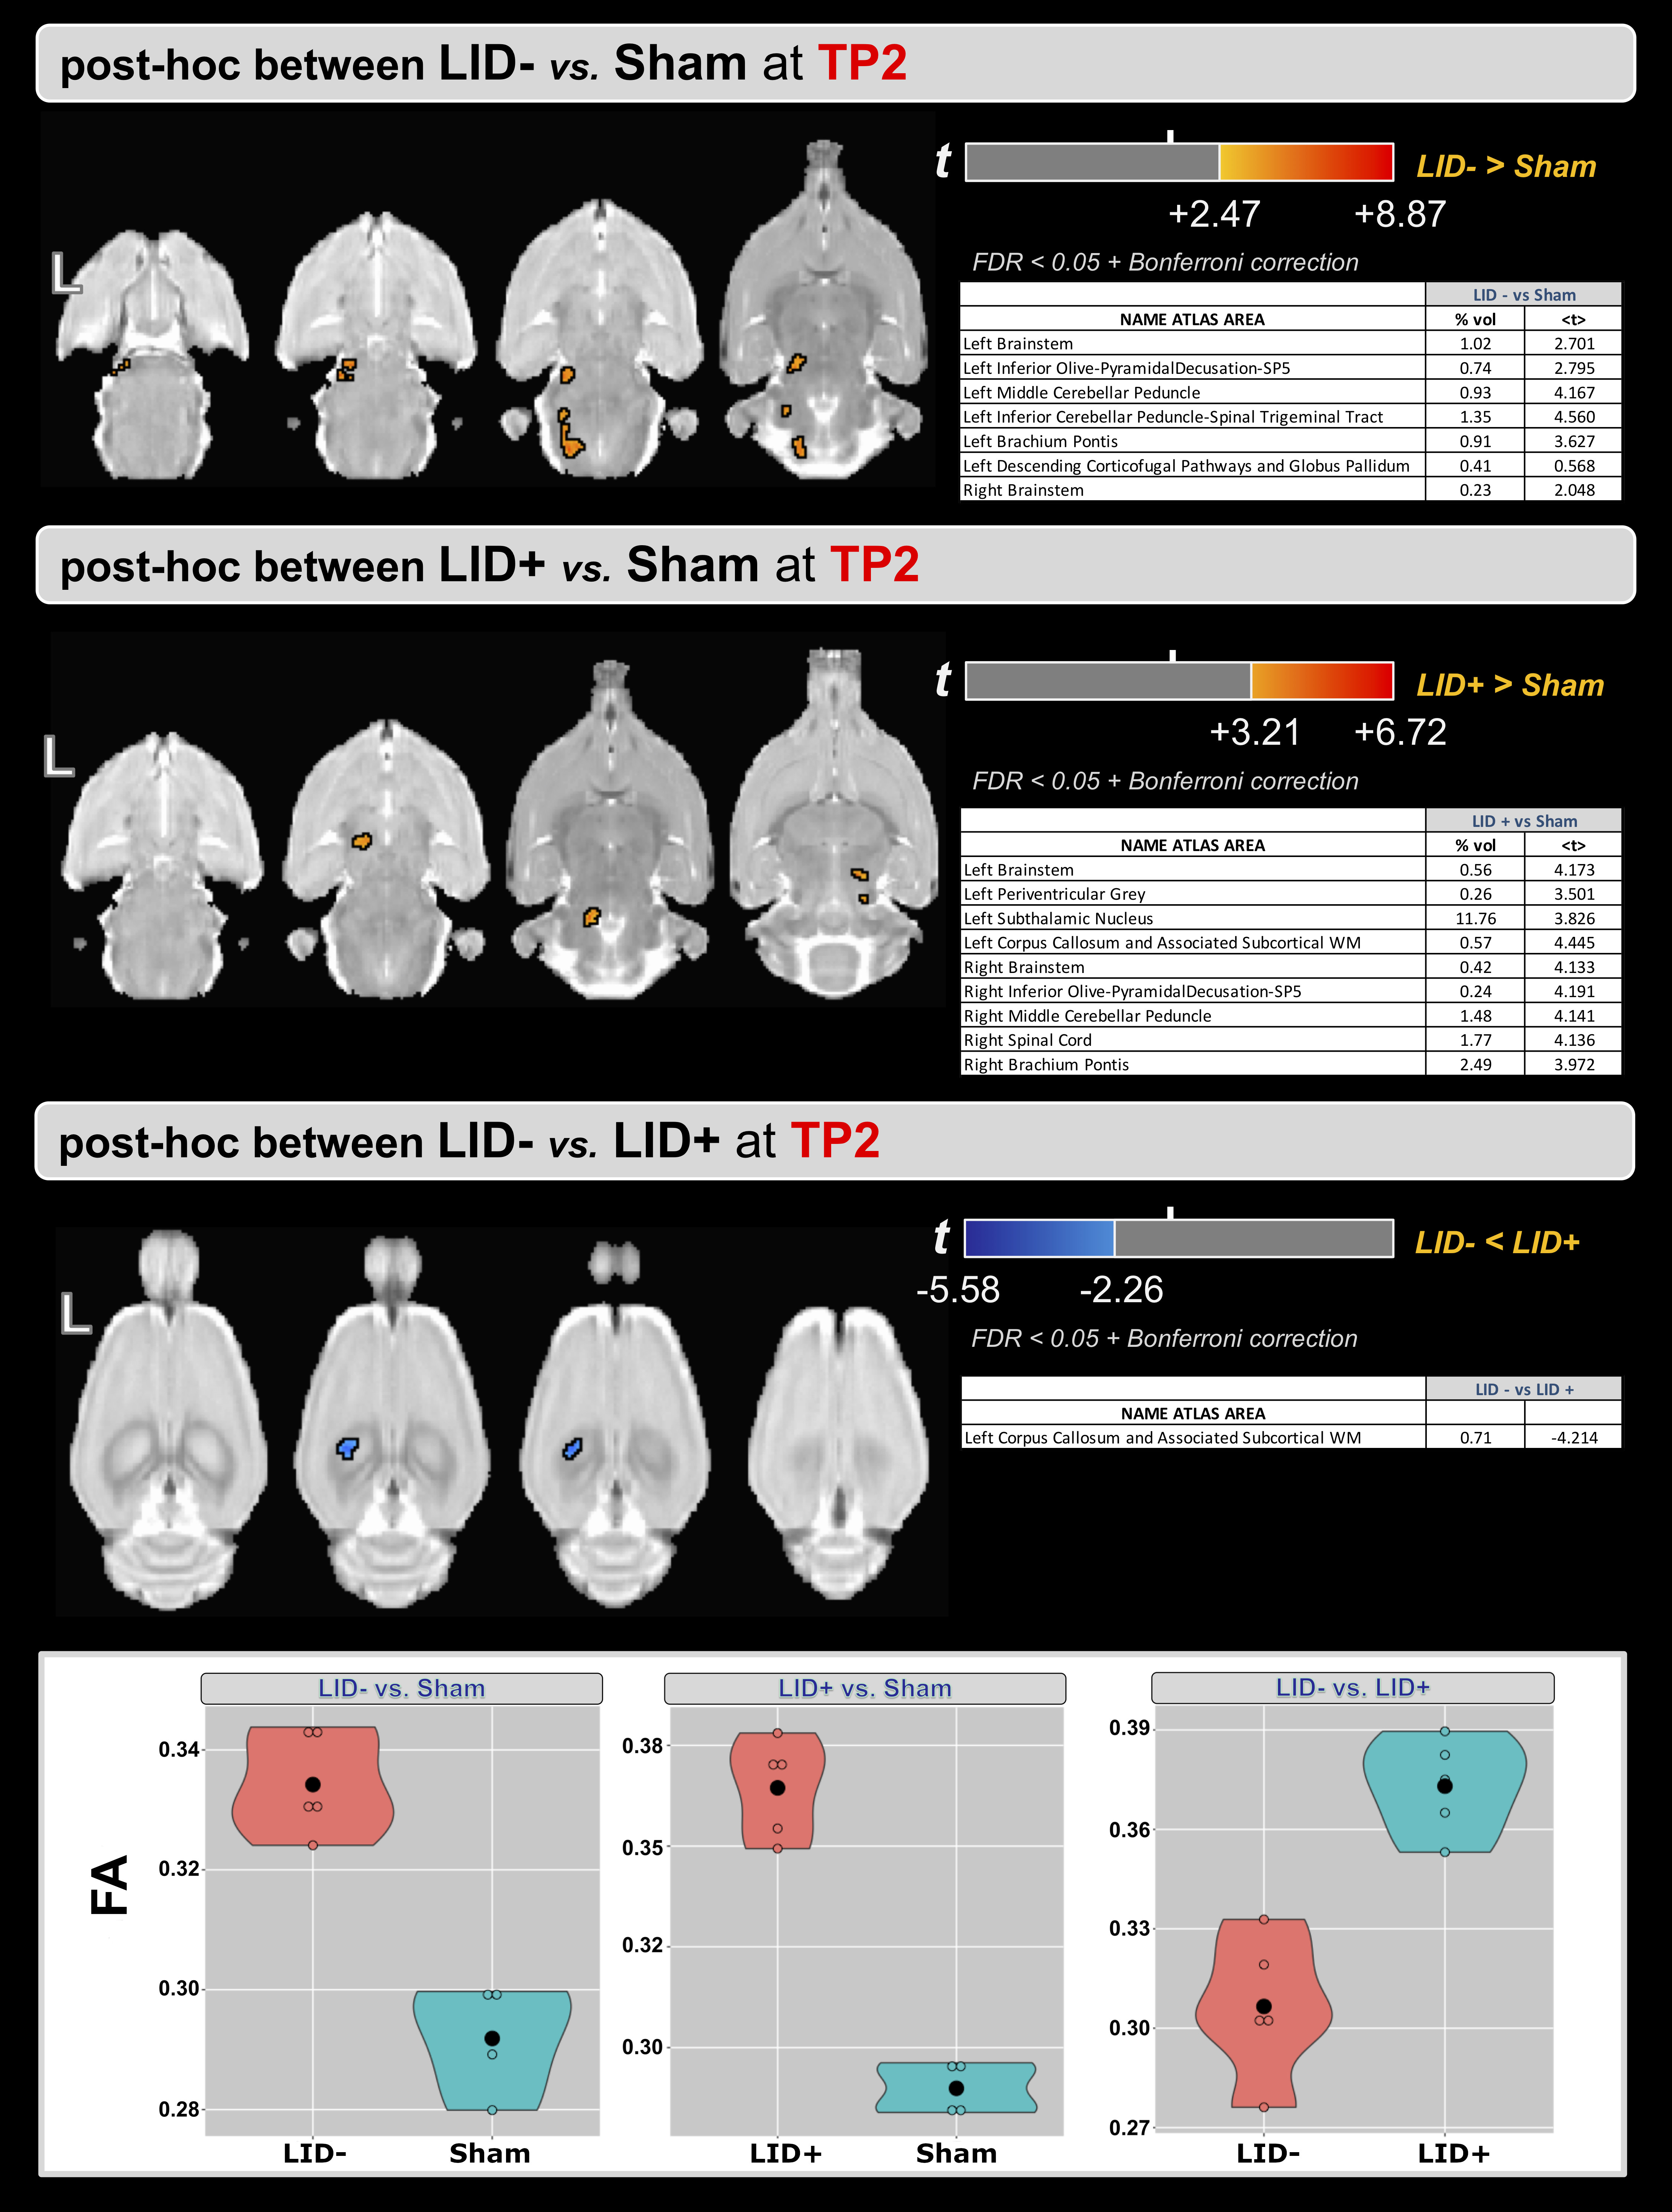
Figure 2-a shows the voxel-based ANOVA results for the main effect of group. For both time points, higher values of FA were found in the LID+ group compared with sham and LID- groups. The regions are provided in Figure 3 and include the left inferior cerebellar peduncle-spinal trigeminal tract, corpus callosum, and superior colliculus. For the main effect of time (Figure 2-b), higher values of FA were found at TP2 in several WM areas (see Figure 3). Finally, figure 2-c shows the group×time interaction, with regions provided in Figure 3. Post-hoc analyses for time and group are shown in Figures 4 and 5, respectively. For LID+ and LID-, higher FA values were found at TP2 compared with baseline (Figure 4). Lower FA values were observed over time in the sham group. At TP2, group differences showed higher FA values in LID+ and LID- groups than sham, as well as higher FA values in LID+ than LID- (Figure 5).Discussion
In this pilot study, we analyzed WM changes between 6-OHDA, with and without LID, and sham rats, as well as compared to baseline (naïve). Using FA from DTI, differences were observed for the main effects of group, time, and their interaction. For both lesion groups, post-hoc analysis for time showed significant increases in FA in the thalamus (bilateral) of the LID- group and in the corpus callosum of the LID+ group. However, the sham group showed unexpected changes over time, which may reflect the limited sample size. Work is ongoing to acquire data in additional rats. At TP2, the 6-OHDA groups had higher FA values than sham group, where LID- showed predominantly left lateralized effects and LID+ showed bilateral changes that included the subthalamic nucleus. Interestingly, LID+ had higher FA values than LID- in the left corpus callosum, which may be due to microstructural alterations associated with LID.Conclusions
In this pilot study, we observed microstructural changes in WM associated with 6-OHDA lesions and LID, with comparison to pre-lesion epochs and sham rats. Work is ongoing to increase our sample sizes and to assess behavioral correlates of altered WM microstructure.Acknowledgements
Barrow Neurological FoundationReferences
1. Ascherio A, Schwarzschild MA. The epidemiology of Parkinson's disease: risk factors and prevention. Lancet Neurol. Nov 2016;15(12):1257-1272. doi:10.1016/S1474-4422(16)30230-7
2. Manson A, Stirpe P, Schrag A. Levodopa-induced-dyskinesias clinical features, incidence, risk factors, management and impact on quality of life. J Parkinsons Dis. 2012;2(3):189-98. doi:10.3233/JPD-2012-120103
3. Sellnow RC, Newman JH, Chambers N, et al. Regulation of dopamine neurotransmission from serotonergic neurons by ectopic expression of the dopamine D2 autoreceptor blocks levodopa-induced dyskinesia. Acta Neuropathol Commun. 01 15 2019;7(1):8. doi:10.1186/s40478-018-0653-7
4. Bergamino M, Keeling EG, Mishra VR, Stokes AM, Walsh RR. Assessing White Matter Pathology in Early-Stage Parkinson Disease Using Diffusion MRI: A Systematic Review. Front Neurol. 2020;11:314. doi:10.3389/fneur.2020.00314
5. Perlbarg V, Lambert J, Butler B, et al. Alterations of the nigrostriatal pathway in a 6-OHDA rat model of Parkinson's disease evaluated with multimodal MRI. PLoS One. 2018;13(9):e0202597. doi:10.1371/journal.pone.0202597
6. Ogawa T, Hatano T, Kamagata K, et al. White matter alterations in Parkinson's disease with levodopa-induced dyskinesia. Parkinsonism Relat Disord. Sep 2021;90:8-14. doi:10.1016/j.parkreldis.2021.07.021
7. Barrière DA, Magalhães R, Novais A, et al. The SIGMA rat brain templates and atlases for multimodal MRI data analysis and visualization. Nat Commun. 12 13 2019;10(1):5699. doi:10.1038/s41467-019-13575-7
Figures