2038
Quantification of The Comb Sign in Crohn’s Disease Using Time of Flight Magnetic Resonance Angiography1School of Medicine, University of Nottingham, Nottingham, United Kingdom, 2National Institute of Health Research, Nottingham Biomedical Research Centre (BRC) at Nottingham University Hospitals NHS Trust and University of Nottingham, Nottingham, United Kingdom, 3School of Physics and Astronomy, University of Nottingham, Nottingham, United Kingdom
Synopsis
Crohn’s disease (CD) is an inflammatory bowel disease affecting 115k people in the UK. The ‘Comb Sign’ describes increased vascularity and arborization of vessels in the mesentery, due to intestinal inflammation. Radiologists observe this sign on cross-sectional imaging as an indication for CD, but it has never been quantified. We used time of flight MR angiography to visualize the vessels in the abdomen without using contrast agents. Images were analyzed using in-house developed software that traces vessels and counts branching points. Scans from 15 healthy volunteers(HV) and 6 CD patients showed patients had more vessel branching points compared to HV.
Introduction
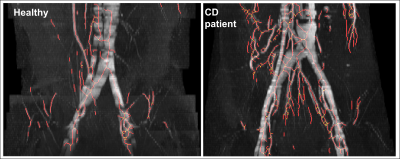
Crohn’s disease (CD) is a chronic, relapsing and remitting inflammatory disease of the gastrointestinal (GI) tract affecting 115k people in the UK1. The traditional management of CD involves a stepwise escalation of treatment, which can lead to a delay in those at high risk of disease progression. The correlation between symptoms and endoscopic disease activity lacks accuracy, resulting in a risk of under treatment 2. Objective evidence of inflammation is required when considering changes to treatment. Therefore, the detection of inflammation on cross-sectional imaging is suggested as an alternative to invasive endoscopy 3. The comb sign refers to hypervascularity and increase in terminal branching of the mesenteric vessels. This effect appears to resemble the shape of the teeth of a comb on contrast-enhanced CT 4 and is indicative of active inflammation. Although it is subjectively commented upon by radiologists, no automated quantitative measures were developed to adequately quantify the comb sign. Previous studies attempted to quantify the comb sign using visual identification of the number of vessels in a selected ROI by radiologists on CT enterography (CTE) 5,6.Aim: To develop an objective method to quantify the comb sign on time of flight (TOF) Magnetic resonance angiography (MRA) scans using an automated software, without the use of a contrast agent or relaying on visual assessment by radiologists.
Methods
A MATLAB algorithm was developed to track the vessels on a 3D maximum intensity projection (MIP) of a TOF MRA data set and calculate the number of branching points in the vessels (figure 1). This is done by rotating the TOF MIP image 360 degrees in 20⁰ increments totaling 18 MIP images for each scan. Another in-house algorithm was used to automatically segment the abdomen on the 2-point Dixon MRI Images, enabling the analysis of the intra-abdominal vessels while excluding vessels in subcutaneous fat. If vessels from the kidneys and liver were included in the ROI they were manually segmented out. As a result, the algorithm produces an arborization index - which is the total number of branching points seen on all MIP Images of the TOF scan divided by 18 (number of MIPs for each scan). 2-point Dixon and 2D TOF (flip angle=60, slice thickness=3 mm) scans were acquired in the transverse plane between the top of the hip joint and L4 vertebra using a 3T Ingenia Wide bore scanner (Philips, Best, The Netherlands). The primary outcome was a comparison of the arborization index between CD and healthy volunteers (HV) group. A planned sub-analysis was undertaken across CD and HV matched for BMI to investigate the effect of visceral fat on the arborization index. Repeated measures were also undertaken to evaluate the variability of the quantification method. No contrast agents were used for the TOF MRA scans. Biological variations within each group and test-retest repeatability were assessed using the coefficient of variation (CV). Statistical analysis with unpaired, two-tailed t-tests were conducted and differences were considered significant when the p-value is ≤ 0.05. All absolute values are presented as mean ± standard deviation (SD).Results
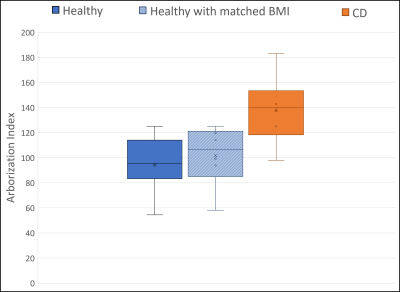
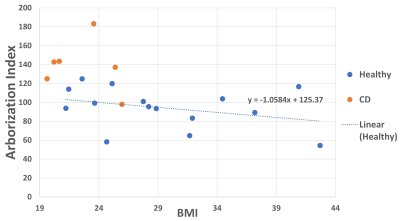
The healthy volunteers were selected to have a widespread BMI to investigate the effect of visceral fat on vascularity (BMI ranging from 21 to 42 kg/m2 with an average of 29±7 kg/m2). Out of the 15 healthy volunteers, 6 with an average BMI of 23±2 kg/m2 were selected to match the CD patients who had an average BMI of 23±3 kg/m2 for further comparison between the two groups. CD patients showed a significantly higher vessels arborization in the abdomen when compared with HV (mean arborization in HV= 94±21 and CD=138±28; p-value =0.009). CD patients also showed higher arborization values in a sub-analysis when compared with a group of 6 HV with matched BMIs (mean arborization in matched HVs= 101±24 compared to the previously mentioned mean value of 138±28 for CD; p=0.036) (Figure 2). Figure 3 shows the arborization index for both groups plotted against BMI. The arborization index for HV has a gradient of -1.06 with an error rate of 0.82. The CV was 23% for healthy volunteers and 20% for CD patients indicating biological variation. Test-retest variability calculated from multiple TOF scans of the same subjects gave a mean CV of 6±5% for both groups combined.Discussion
Our preliminary data suggest that the arborization index may be a useful measure of hypervascularity and hence intestinal inflammation in Inflammatory Bowel Disease. The visibility of the vessels on the TOF images depends on the rate of flow through the vessels which may affect the results, and it is likely that practical abdominal MRI scans will be unable to detect the most distal small vessels. Further validation to standard disease activity measures is needed across larger cohorts to better investigate the utility of this potential biomarker as a non-invasive measure of disease activity. This is a small pilot study, but a larger group of CD patients are currently being recruited.Conclusion
We have produced an automated and objective method of assessing the arborization of vessels in the abdomen using widely available MRI scans without the need for a contrast agent. We have used this to detect the expected increase in arborization in CD patients.Acknowledgements
This work is funded by the NIHR Biomedical Research Centre and The Haydn Green Institute for innovation and entrepreneurship. All scans were conducted at Sir Peter Mansfield Imaging Centre.References
1. Mayberry JF, Lobo A, Ford AC, Thomas A. NICE clinical guideline (CG152): the management of Crohn’s disease in adults, children and young people. Aliment Pharmacol Ther. 2012;37(2):195-203.
2. Gracie, DJ, Williams, CJM, Sood, R et al. Poor correlation between clinical disease activity and mucosal inflammation, and the role of psychological comorbidity, in inflammatory bowel disease. American Journal of Gastroenterology .2016; 111(4), 541–551.
3. Horsthuis K, Bipat S, Stokkers PC, Stoker J. Magnetic resonance imaging for evaluation of disease activity in Crohn's disease: a systematic review. Eur Radiol. 2009;19(6), 1450–1460.
4. Madureira A. J. The comb sign. Radiology. 2004; 230(3):783–784.
5. Wu YW, Tao XF, Tang YH, Hao NX, Miao F. Quantitative measures of comb sign in Crohn's disease: correlation with disease activity and laboratory indications. Abdom Imaging. 2012;37(3):350-358.
6. Chen M, Remer EM, Liu X, Lopez R, Shen B. Identification of the distinguishing features of Crohn’s disease and ischemic colitis using computed tomographic enterography. Gastroenterology Report. 2016;5(3):219-225.
Figures


