2036
1H-MRS of bile in the gallbladder in subjects without and with hepatic steatosis1Section on Experimental Radiology, Department of Diagnostic and Interventional Radiology, University Hospital Tübingen, Tübingen, Germany, 22. Institute for Diabetes Research and Metabolic Diseases of the Helmholtz Centre Munich at the University of Tübingen, University of Tübingen, Tübingen, Germany, 33. German Center for Diabetes Research (DZD), Tübingen, Germany, 44. Department of Internal Medicine, Division of Endocrinology, Diabetology and Nephrology, University Hospital Tübingen, Tübingen, Germany
Synopsis
1H-MRS of bile was performed in 54 healthy subjects at increased risk for metabolic diseases. Additionally, intrahepatic lipids (IHL) were quantified. Concentration of main peaks of bile was calculated in relation to non-suppressed water signal. Large interindividual differences in concentration of the bile-peaks with significantly lower concentrations in subjects with increased IHL were detected. Males show a tendency towards higher concentrations in all bile-peaks as well as in IHL (n.s.). It remains speculative, whether or not these MRS-derived results might play a role in the pathogenesis of insulin resistance – further analyses with assignable metabolic and laboratory data are recommended.
Introduction
Bile acids (BAs) are produced in the liver and – interdigestively – stored in the gallbladder, which is a pear-shaped hollow organ located below the right lobe of the liver. Their main function is to facilitate digestion of dietary fats and oils after they are secreted into the intestine after meals. Recently it has been reported that insulin resistance is positively correlated with the levels of plasma BAs and that patients with type 2 diabetes mellitus (T2DM) are characterized by increased concentrations of taurine-conjugated BA species [1]. 1H-MRS of the gallbladder allows detection of several peaks in bile, including components of BAs and phospholipids (PLs) [2,3]. Different concentrations between healthy subjects and patients with cholangitis have been shown [4,5]. However, little is known about interindividual differences of the composition in healthy subjects. Aim of this study was to evaluate the composition of the metabolites in healthy volunteers and to correlate it with intrahepatic lipid content (IHL) and anthropometric data.Methods
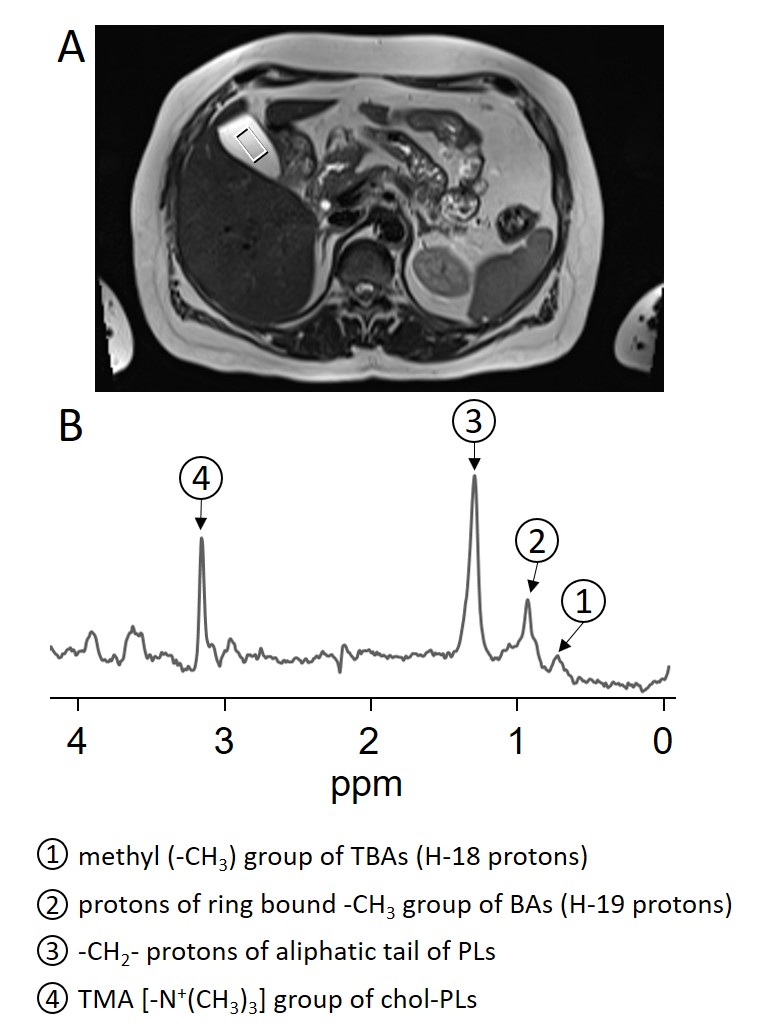
Fifty-five consecutive healthy subjects (44f/11m, age 50.0±14.9) at increased risk for metabolic diseases were examined on a 3 T whole-body imager (Magnetom Vida, Siemens Healthineers, Erlangen, Germany) in the early morning after overnight fasting. After morphologic T2-weighted imaging, a single voxel STEAM technique (TE=20ms, TM=10 ms, TR=4s, 20 acquisitions, 2 pre-scans, BW 1200 Hz, VOI:10x10x20mm³) was applied from the gallbladder as shown in Figure 1. Spectra were recorded in expiration with instructed rhythmic breathing. Integrals of 4 main peaks assigned to (1) methyl (‐CH3) group of total BAs (H‐18 protons) at 0.67 ppm, (2) protons of ring bound ‐CH3 group of BA’s (H‐19 protons) at 0.88 ppm, (3) ‐CH2‐ protons of aliphatic tail of phospholipids (PLs) at 1.27 ppm and (4) trimethylammonium (TMA) [-N+(CH3)3] group of chol-PLs (see Figure 1B) and water signal at 4.77 ppm (not shown) were quantified in the time domain using a nonlinear least-squares algorithm (AMARES [6]) in the Java-based magnetic resonance user interface (jMRUI) software package [7]. Ratios of the mentioned peaks 1-4 to water resonance were calculated and expressed in %. Additionally, intrahepatic lipids (IHL) were quantified in posterior part of segment 7 as described earlier [8].Results
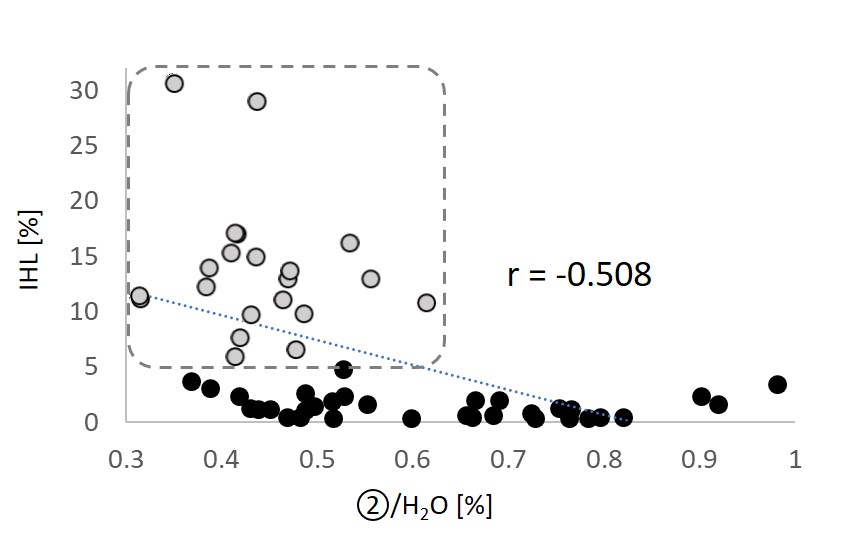
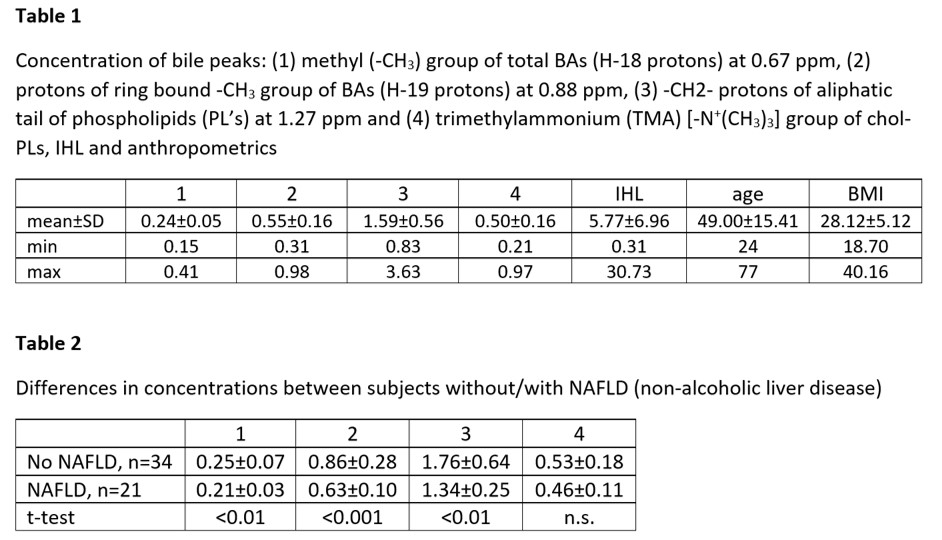
Concentrations of main bile signals, IHL and anthropometric data are given in Table 1. There is a large variability in concentration of all peaks in relation to water (up to 4.6-fold for TMA-group of chol-PLs (peak 4). Males show a tendency towards higher concentrations for all bile-peaks as well as for IHL, which are not significant (data not shown). Twenty-one subjects (38%) were assigned to suffer from non-alcoholic fatty liver disease (NAFLD, IHL > 5.56%, according to [9]). All of them are characterized by significantly lower concentrations of peaks 1-3 as given in Table 2 and exemplarily shown in Figure 2 for protons of ring bound ‐CH3 group of BAs (H‐19 protons), i.e. peak 2. However, although a strong negative correlation shows up (r=-0.508) there are several subjects without fatty liver revealing identical low concentrations.Discussion
Our prospective observations show spectra of good quality in acceptable measurement time (TA approx. 1:30 min) with sufficient signal-to-noise ratio for the main signals. It has to be mentioned, that more than 10 signals can be identified in-vivo [2-4] with generally lower concentrations, which are – in part – assigned to taurine- and/or glycine-conjugated BAs. Besides interindividual variations, a significantly lower concentration in relation to water has been derived in subjects with NAFLD. However, the regulatory metabolic pathways regarding the synthesis of BAs in liver cells leading to the observed differences is not yet understood and it remains speculative, whether or not these MRS-derived results might play a role in the pathogenesis of insulin resistance. Further analyses in combination with assignable metabolic and laboratory data are recommended.Conclusion
In-vivo 1H-MRS of bile in the gallbladder is feasible and might represent a novel component for characterization of subjects at increased risk for metabolic diseases. As stated in Ahmad et al. [1]: “of all the novel glucoregulatory molecules discovered in the past 20 years, bile acids (BAs) are notable for the fact that they were hiding in plain sight.”Acknowledgements
Supported in part by a grant (01GI0925) from the German Federal Ministry of Education and Research (BMBF) to the German Center for Diabetes Research (DZD e.V.)References
1. Ahmad TR, Haeusler RA. Bile acids in glucose metabolism and insulin signalling - mechanisms and research needs. Nat Rev Endocrinol. 2019;15(12):701-712
2. Vermathen P, Diserens G, Kröll D, Nett P, Stirnimann G, Wiest R. Determination of bile acids from human gallbladder by 1H-MRS-Protocol optimization and estimation of reproducibility. NMR Biomed. 2021;34(2):e4432
3. Mohajeri S, Ijare OB, Bezabeh T et al. In vivo 1H MRS of human gallbladder bile at 3 T in one and two dimensions: detection and quantification of major biliary lipids. NMR Biomed. 2014;27(10):1192-1202
4. Mohajeri S, Bezabeh T, Ijare OB et al. In vivo 1H MRS of human gallbladder bile in understanding the pathophysiology of primary sclerosing cholangitis (PSC): Immune-mediated disease versus bile acid-induced injury. NMR Biomed 2019;32(5):e4065
5. Gajdošík M, Chmelík M, Halilbasic E et al. In Vivo 1H MR Spectroscopy of Biliary Components of Human Gallbladder at 7T. J Magn Reson Imaging. 2021 Jan;53(1):98-107
6. Vanhamme L, van den Boogaart A, Van Huffel S. Improved method for accurate and efficient quantification of MRS data with use of prior knowledge. J Magn Reson. 1997;129(1):35-43.
7. Naressi A, Couturier C, Devos JM, et al. Java-based graphical user interface for the MRUI quantitation package. Magn Reson Mater Phys Biol Med. 2001;12(2-3):141-152.
8. Machann J, Thamer C, Schnoedt B et al. Hepatic lipid accumulation in healthy subjects: A comparative study using spectral fat-selective MRI and volume-localized 1H-MR spectroscopy. Magn Reson Med 2006;55(4):913-917
9. Szczepaniak LS, Nurenberg P, Leonard D et al. Magnetic resonance spectroscopy to measure hepatic triglyceride content: prevalence of hepatic steatosis in the general population. Am J Physiol Endocrinol Metab. 2005;288(2):E462-46
Figures