2032
Acceleration of chemical shift encoding-based water-fat imaging for pancreatic proton density fat fraction mapping in a single breath-hold1Technical University of Munich, München, Germany, 2Philips GmbH Market Dach, Hamburg, Germany, 3Philips Healthcare, Best, Netherlands, 4Institute for Nutritional Medicine, School of Medicine, Technical University of Munich, München, Germany
Synopsis
With rising prevalence of obesity and metabolic syndrome comes an increasing demand of noninvasive detection of nonalcoholic fatty pancreas disease. Chemical shift encoding-based water-fat separation based on a multi-echo gradient echo acquisition enables pancreatic fat fraction (PDFF) mapping. The pancreas is a small organ and requires high spatial resolution which results in prolonged breath-hold duration for PDFF mapping. The present work aims to accelerate high-resolution single-breath-hold pancreas PDFF mapping using a methodology combining sparse sampled acquisitions with compressed sensing and deep learning reconstructions.
Introduction
Nonalcoholic fatty pancreas disease (NAFPD), describing a fatty infiltration of the pancreas has been associated with obesity and metabolic syndrome and shows correlations with type 2 diabetes mellitus, severe forms of acute pancreatitis, pancreatic cancer and pancreatic fistula complications after pancreatic surgery [1]. With an increasing prevalence of obesity and metabolic syndrome in the general population and therefore rising prevalence of NAFPD, noninvasive quantification of fat content in the pancreas becomes more important. A precise and accurate quantification of pancreatic proton density fat fraction (PDFF) can be provided by chemical shift encoding-based water-fat separation on a single breath-hold multi-echo gradient echo acquisition [2]. Given the small size of the pancreas, a high resolution PDFF mapping scan is needed to reduce partial voluming effects. To avoid motion artefacts especially for subjects with difficulty holding their breath, a reduced breath-hold duration is needed. Compressed sensing (CS) has been previously extensively used for accelerating liver PDFF mapping [3] in acquisitions using sparse sampling. The present work aims to establish a general approach for accelerating high-resolution pancreatic PDFF mapping. Therefore PDFF consistency, repeatability and image quality were compared by: a) using two different acceleration factors and b) reconstructing with compressed sensing only and with a deep learning (DL) integrated compressed sensing approach.Methods
For this analysis, 50 obese subjects (25 male, 25 female;mean age 46.5 years, range 21-66 years) were recruited participating in a lifestyle intervention (LION) study[4]. The images used for the analysis included 11 datasets after the persons completed an 8-week calorie restriction, the remaining 39 datasets were scanned at baseline before the diet. Exclusion criteria were standard contraindications to MRI and absence of serious pre-existing conditions (i.e. diabetes). Subjects underwent an MRI of the abdomen on a 3T scanner (Ingenia Elition X, Philips Healthcare). All subjects first underwent a two stack T2-weighted turbo-spin-echo sequence in two breath-holds, which was later used as orientation for pancreas segmentation. Subsequently two variants of six-echo gradientecho sequences using bipolar gradients for performing chemical shift encodingbased water-fat separation were performed: TR = 8.6ms, TE1 = 1.19ms, ∆TE = 1.2ms, flipangle = 3◦, bandwidth = 1034Hz/pixel, 152 × 199 × 40mm3acquisition matrix size, FOV = 400 × 300 × 120mm3, voxelsize = 2 × 2 × 3mm3. The data was acquired using pseudo random and density weighted k-space sampling with higher sampling density towards the k-space center with two different acceleration factors R=6 (breath-hold duration=16.92s) and R=10 (breath-hold duration=10.27s). The data was reconstructed using the vendor’s compressed SENSE algorithm(C-SENSE) at R=6(C-SENSE6) and at R=10(CSENSE10). To improve the performance of image reconstruction using DL, the C-SENSE technique was combined with an Adaptive-CS-Network as presented by (C-SENSE AI) [5] and was applied to the R=10 data (C-SENSE AI10). PDFF maps were computed after correcting known confounding effects applying the online fat quantification algorithm of the vendor(mDixon Quant) using the complex multi-echo data of the 3 methods (C-SENSE6, C-SENSE10 and CSENSE AI10).Circular regions of interest (ROI) with a diameter of 20 mm were manually drawn in the head (ROI1), body (ROI2) and tail(ROI3) of the pancreas, avoiding larger vessels and ducts. Furthermore, the whole organ was segmented avoiding larger vessels (Fig.1). Segmentation was performed manually with ITKsnap(version=3.8.0) on C-SENSE6 and C-SENSE10 water images. The C-SENSE10 Segmentation was also used for analysing C-SENSE AI10 images(Fig.1). An ROI was also placed in liver segment 7 and included in an intra-subject standard deviation (SD) analysis. Segmentation was repeated in 10 subjects for intra-reader repeatability analysis. A test-retest repeatability analysis was performed on 9 subjects by repeating the scans.
Results
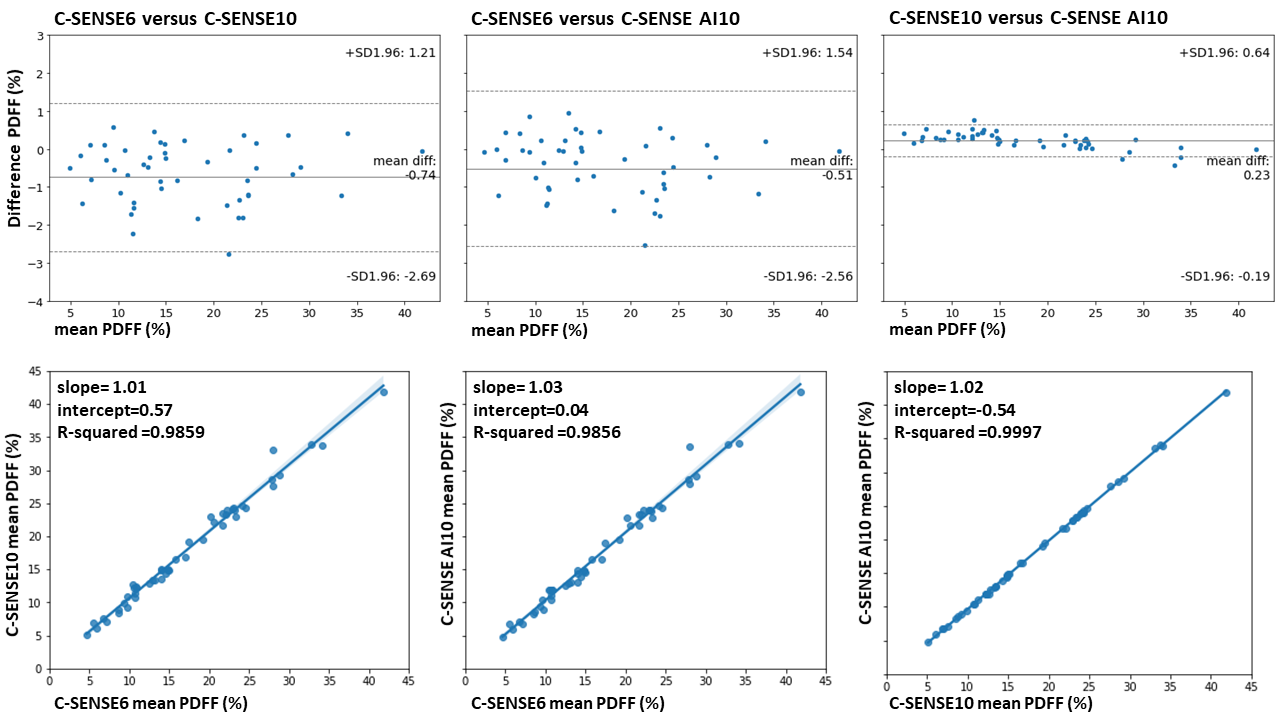
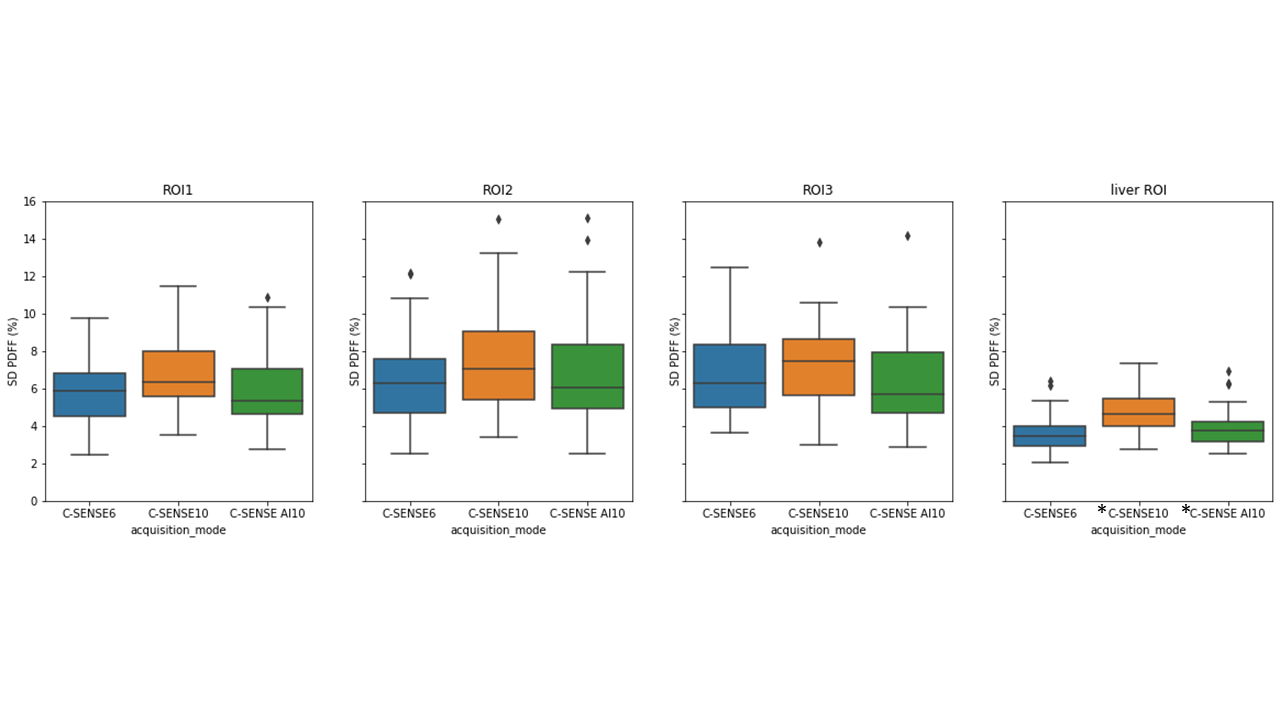
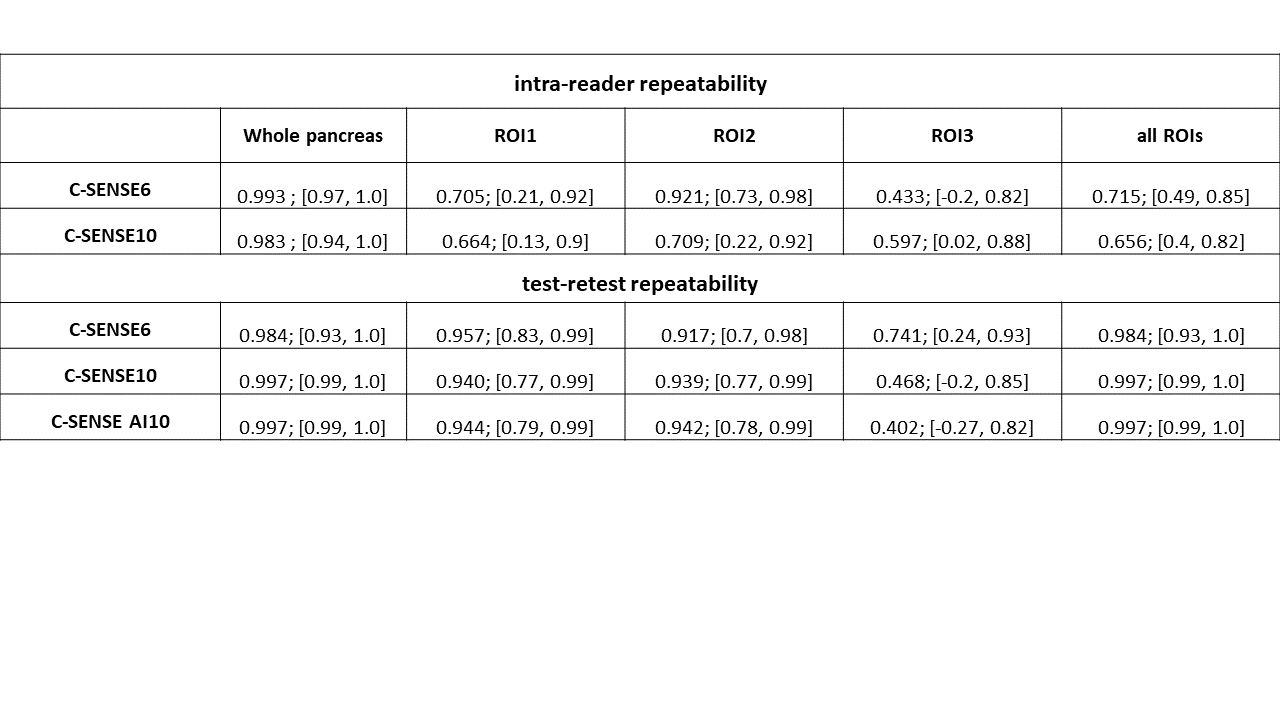
Fig.2 shows representative pancreas PDFF maps for the 3 methods. Mean pancreatic PDFF was 17.1% with 8.3% SD. Bland Altman and regression plots comparing all three acquisition modes are presented in Fig.3. The methods significantly correlate with one another with a pearson coefficient (r)>0.99 and p-value (p)<0.01 for C-SENSE6 vs C-SENSE10, C-SENSE6 vs C-SENSE AI10 and C-SENSE10 vs C-SENSE AI10 whole pancreas segmentation. Intra-subject standard deviations (SD) for pancreas and liver ROIs are shown in Fig.4. ROI PDFF SD significantly increases for C-SENSE10 compared to C-SENSE6 in liver ROI and significantly decreases for C-SENSE10 AI10 compared to C-SENSE10 in liver ROI. No significant difference between mean intra-subject PDFF SD can be measured in any pancreas ROI. Intra-reader and test-retest repeatability are demonstrated in Table 1, proving a very high repeatability for the whole pancreas and a lower repeatability for ROIs in all aspects.Conclusion
C-SENSE with increased acceleration factor can be applied for pancreas imaging without impacting PDFF quality while reducing the breathhold duration from 16.9s to 10.3s.Acknowledgements
This study was supported by the German Federal Ministry of Education and Research (BMBF,grantnumber : 01EA1709) within the framework of the Junior Research Group for Personalized Nutrition & eHealth (PeNut) of the enable Nutrition Cluster. The authors also acknowledge research support from Philips HealthcareReferences
[1] MM Smits, EJ van Geenen. “The clinical significance of pancreatic steatosis”. In: Nat Rev Gastroenterol Hepatol 8.3 (2011), pp. 169–177.[2] Li J et al. “Noninvasive quantification of pancreatic fat in healthy male population using chemical shift magnetic resonance imaging: effect of aging on pancreatic fat content”. In: Pancreas 40.2 (2011), pp. 295–299.
[3] Lohöfer FK et al. “Acceleration of chemical shift encoding-based water fat MRI for liver proton density fat fraction and T2* mapping using compressed sensing”. In: PLoS One 14.11 (2019), pp. 295–299.
[4] Holzapfel C, Reik A. “Randomized Controlled Lifestyle Intervention (LION) Study for Weight Loss and Maintenance in Adults With Obesity-Design and Methods”. In: Front Nutr. 7 (2020), p. 586985.
[5] Pezzotti N et al. “An adaptive intelligence algorithm for undersampled knee MRI reconstruction”. In: IEEE Access 8 (2020), pp. 204825–204838.
Figures
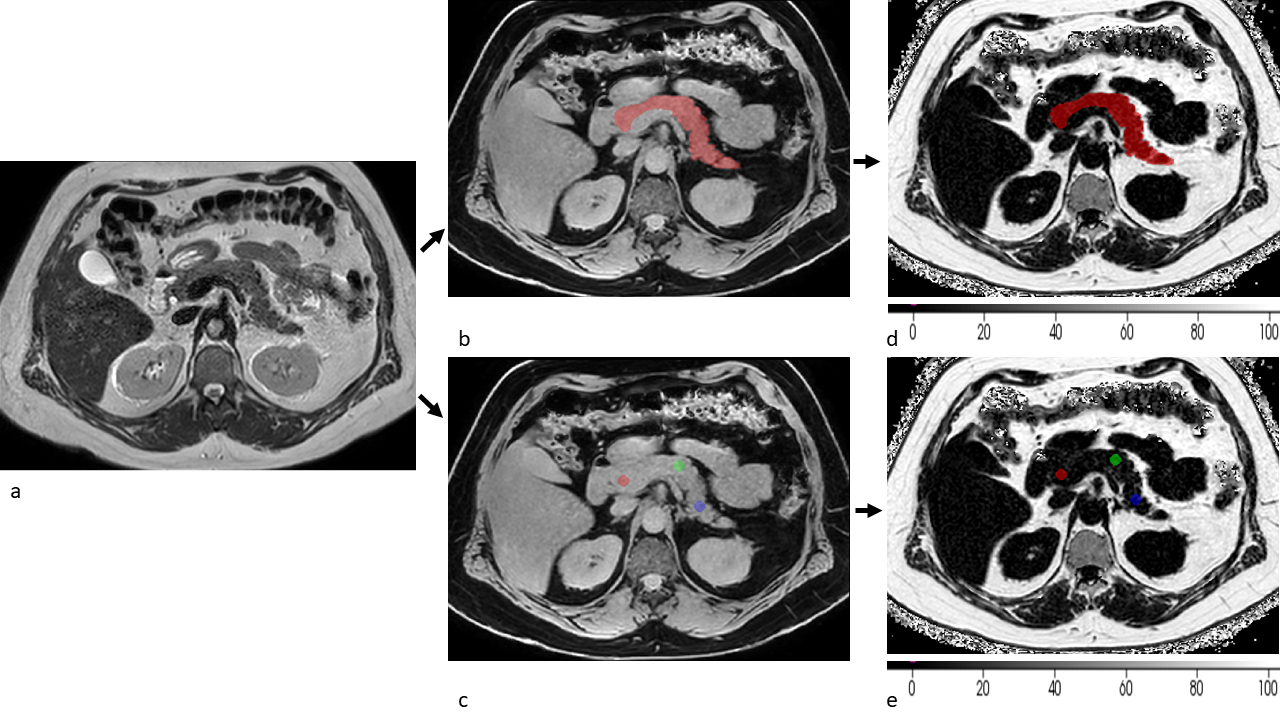
Figure 1: Segmentation procedure: (a) a T2 weighted image is used for improved vessel and border (duodenum, stomach) detection. Segmentation is performed on C-SENSE6 and C-SENSE10 water images by circumcising the organ in all axial slices, and placing (b) one ROI over the whole pancreas and (c) ROIs in the head, body and tail. Resulting masks were then used on C-SENSE6, C-SENSE10 and C-SENSE AI10 PDFF maps to extract the pancreatic PDFF (d,e with colormap PDFF (%)). The same mask was used for C-SENSE10 and C-SENSE AI10 PDFF extraction.
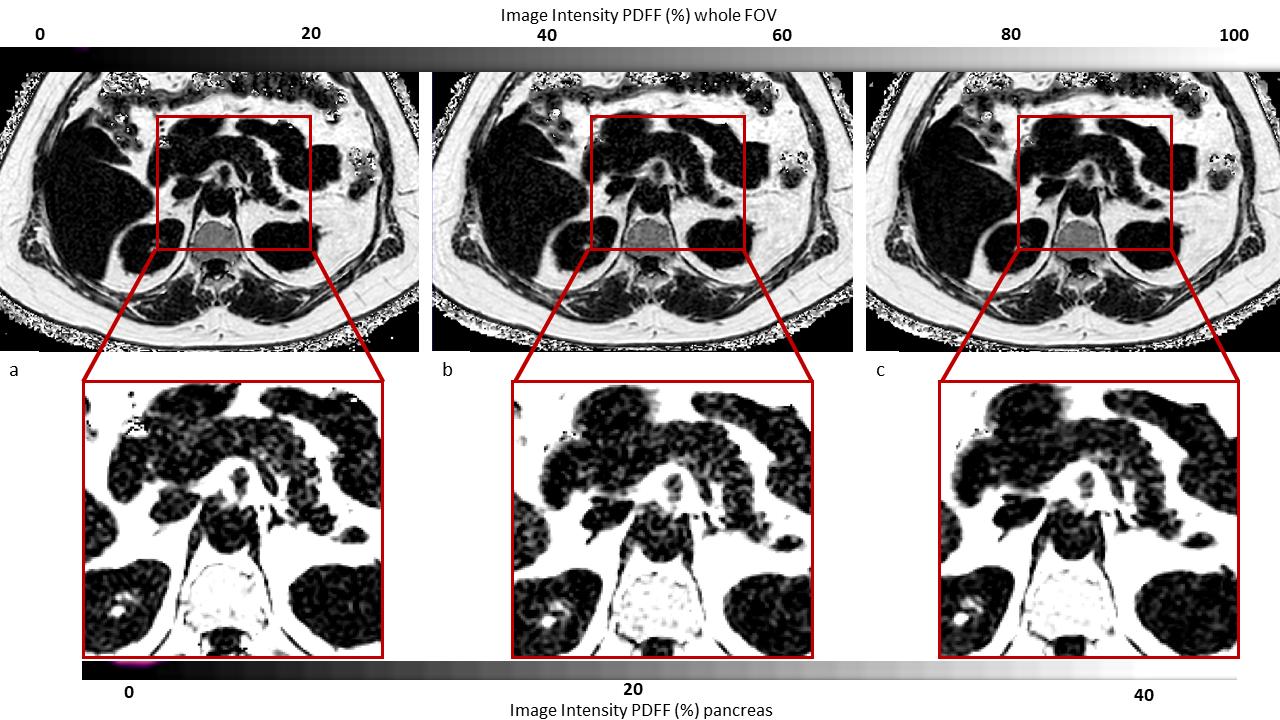
Figure 2: Axial PDFF maps of C-SENSE6 (a), C-SENSE10 (b) and C-SENSE AI10 (c) at whole field of view (first row) and pancreas close up (second row) with colormap showing PDFF values (%). Whole pancreas PDFF was for the shown subject 10.9% with C-SENSE6, 11.9% with C-SENSE10 and 12.3% for C-SENSE AI10.