2031
Aberrant Dynamic Functional Network Connectivity in Adult Patients With Autism Spectrum Disorder1Henan Provincial People’s Hospital, Zhengzhou, China, 2MR Collaboration, Siemens Healthineers Ltd., Beijing, China
Synopsis
Conventional static functional connectivity analysis does not capture transient and atypical changes in functional connectivity between neural networks in the autism spectrum disorder (ASD) patients. In this study, we evaluated rsfMRI data of 108 adult ASD patients by dynamic functional network connectivity (dFNC) analysis using sliding time window correlation and K-means clustering methods. Our results showed that higher dwell time and altered functional connectivity between multiple nodes in FNC state 2 correlated with clinical ASD scores. Therefore, our study demonstrates that aberrant and transient functional connectivity changes between neural networks in ASD patients can be evaluated by dFNC analysis.
Introduction
Autism spectrum disorder (ASD) is a neurodevelopmental disorder characterized by difficulties in social communication, repetitive behaviors, and limited interests [1]. The symptoms of ASD adversely affect daily living activities and the quality of life. Traditional static brain functional connectivity analysis in pediatric ASD patients do not account for the dynamic changes in brain functions as the children grow older [2]. Moreover, differences in selective attention abilities and executive motor functions have been observed between pediatric and adult ASD patients [3]. Besides, static functional connectivity analysis does not capture dynamic and variable brain functional connectivity in ASD patients [4]. Therefore, in this study, we analyzed resting state fMRI data of adult ASD patients using dynamic functional network connectivity (dFNC) analysis to identify dynamic alterations in functional connectivity between neural networks in adult ASD patients. We also evaluated the relationship between altered functional connectivity and clinicopathological characteristics of ASD patients.Methods
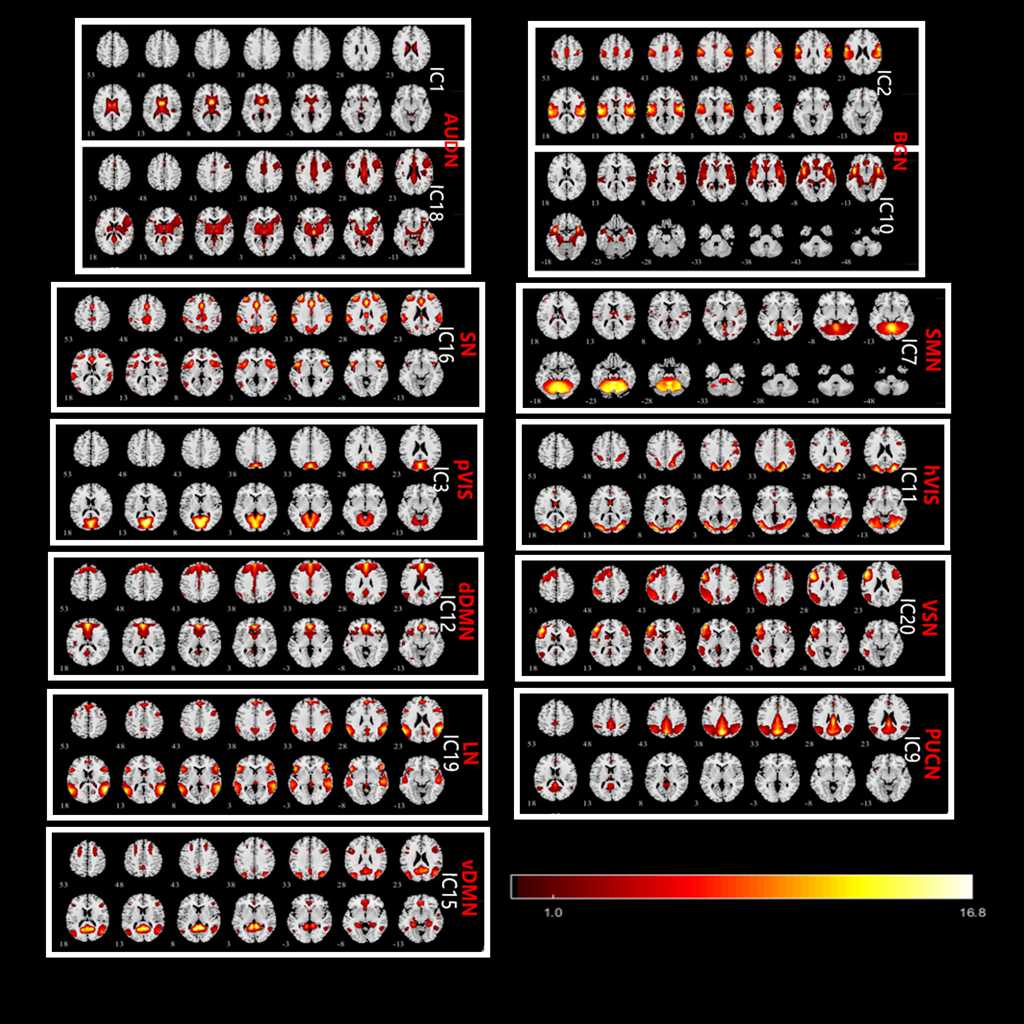
Data Acquisition We acquired neuroimaging data for 108 adult male ASD patients and 90 age-matched healthy male subjects from the open acess ABIDE database (from 6 different study sites; http://fcon_1000.projects.nitrc.org/indi/abide/abide_I.html) and Henan Provincial People's Hospital (0/10, ASD/controls). The rs-fMRI data (Henan Provincial People's Hospital) was acquired on a MAGNETOM Prisma 3T MRI scanner (Siemens Healthcare, Erlangen, Germany) using a single-shot gradient-recalled echo planar imaging sequence with the following parameters: TR/TE = 2000 ms/35 ms, Flip Angle = 90°, FOV = 207 mm × 207 mm, number of slices = 75, slice thickness = 2.2 mm, matrix = 94 × 94, measurements = 240, total acquisition time = 8 mins. Data Processing and Analysis We only analyzed the first 150 volumes of data for each enrolled subject to eliminate any scan time variations for acquiring rs-fMRI data at different sites. We preprocessed the rs-fMRI data using the RESTPlus software V1.22 (http://www.restfmri.net). This included slice timing, motion correction, registration and nomalizing to the MNI template with 3x3x3 mm3 resolution, and smoothing with an 8-mm full-width half maximum isotropic Gaussian kernel. The group ICA package of the GIFT software (http://mialab.mrn.org/software/gift/) was used to convert all preproceesed data into 13 independent components (ICs), which were further categorized into 11 resting state networks (RSNs) using the Standford functional ROIs as a template, namely, auditory network (AUDN), basal ganglia network (BGN), language network (LN), sensorimotor network (SMN), precuneus network (PUCN), salience network (SN), visuospatial network (VSN), dorsal default mode network (dDMN), high visual network (hVIS),primvisual network (pVIS), and ventral default mode network (vDMN) (Figure 1). We then performed dynamic functional network connectivity (FNC) analysis with the sliding window correlation approach (window length = 30 TRs, step size = 1 TR) using the GIFT package [5]. We then generated the FNC matrix for each study subject by evaluating the time course for each pair of the 11 RSNs by calculating the Pearson’s correlation coefficients. Then, we clustered all the FNC matrices using the K-means algorithm and evaluated the occurrence frequency and structure of the FNC states. The optimal cluster (states) number was set to K=5. Subsequently, we compared the connectivity strengths and dwell times (average time spent in each state before changing to another state) in all five states for all ASD patients and healthy control subjects. Statistical analysis The two-sample t-test (p<0.05 with FDR correction) was used to evaluate differences in connectivity strengths between the HC and ASD patient groups. The dwell time differences in each state between the HC and ASD patient groups were analyzed using the Mann-Whitney U-test (P<0.05 with Bonferroni correction). We also used Pearson’s correlation test to evaluate the relationships between mean dwell time and the four clinical autism diagnostic observation schedule (ADOS) scores (ADOS_TOTAL, ADOS_COMM, ADOS_SOCIAL, and ADOS_STEREO_BEHAV).Results
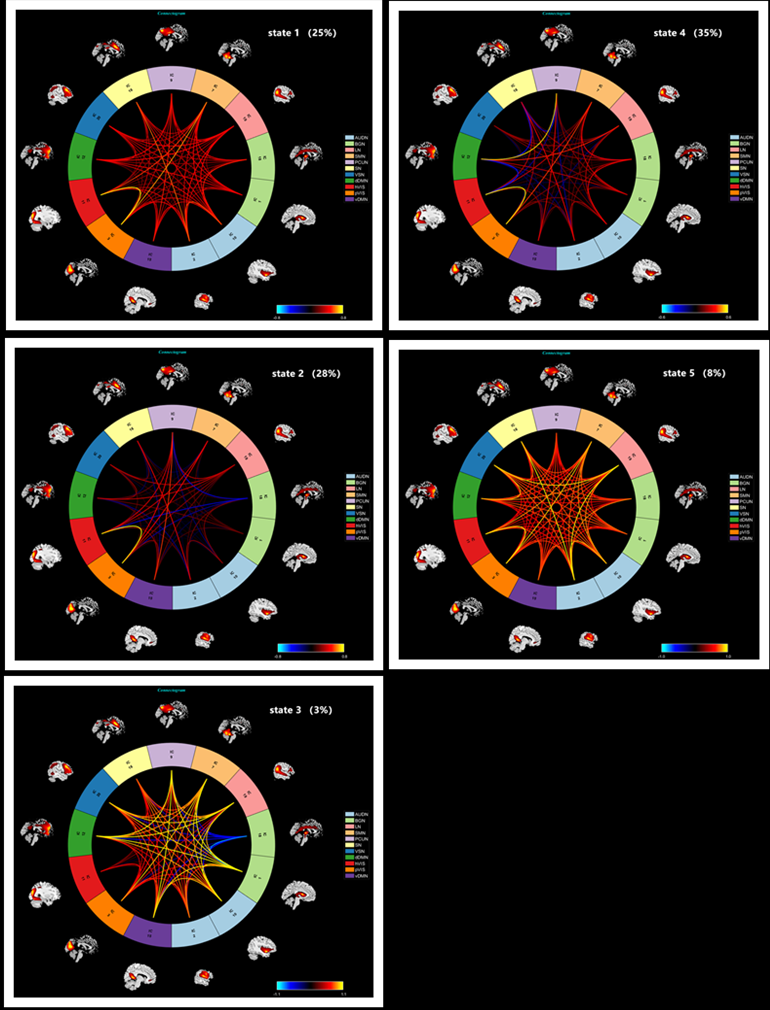
We identified five FNC states in the clustering analysis (Figure 2). The occurrence frequency for states 1 to 5 were 25%, 28%, 3%, 35%, and 8%, respectively. The dwell time in state 2 was significantly higher for the ASD group compared to the HC group (P=0.014). Moreover, the dwell time in the ASD group positively correlated with the ADOS_STEREO_BEHAV score (R= 0.216, P= 0.029). The connectiviy strength in state 2 was significantly different between ASD and HC groups, with increased connectivity between dDMN and SN, and reduced connectivity between SMN and PUCN as well as SMN and Hvis (P FDR <0.05).Discussion & Conclusion
Our study showed that mean dwell time in the individual brain functional states was significantly higher in adult ASD patients compared to the healthy controls. Furthermore, aberrant dwell time in the adult ASD patients correlated with the ADOS_STEREO_BEHAV score. The adult ASD patients also showed hypoconnectivity between SMN and PUCN as well as SMN and hVIS, and hypeconnectivity between dDMN and SN in dFNC state 2. These brain networks are related to cognition, which is significantly affected in adult ASD patients. In conclusion, our findings demonstrate the ability of the dynamic functional network connectivity (dFNC) analysis to identify dynamic and transient alterations in specific neural networks of adult ASD patients.Acknowledgements
No acknowledgement found.References
1. Philip RC, Dauvermann MR, Whalley HC, et al. A systematic review and meta-analysis of the fMRI investigation of autism spectrum disorders. Neuroscience and biobehavioral reviews. 2012; 36(2): 901-42. 2. Anagnostou E, Taylor M J. Review of neuroimaging in autism spectrum disorders: what have we learned and where we go from here. Molecular autism. 2011; 2(1): 4.
3. Justus SA, Powell PS, Duarte A. Intact context memory performance in adults with autism spectrum disorder. Sci Rep. 2021; 11(1): 20482.
4. Calhoun VD, Miller R, Pearlson G, et al. The chronnectome: time-varying connectivity networks as the next frontier in fMRI data discovery. Neuron. 2014; 84(2): 262-274.
5. Du Y, Pearlson GD, Yu Q, et al. Interaction among subsystems within default mode network diminished in schizophrenia patients: A dynamic connectivity approach. Schizophr Res. 2016; 170(1): 55-65.
Figures