2029
Quantitative MRI in Major Depressive Disorder at 7T1Spinoza Centre for Neuroimaging, Amsterdam, Netherlands, 2Department of Biomedical Engineering, Amsterdam UMC, Amsterdam, Netherlands, 3Department of Psychiatry, Amsterdam UMC, Amsterdam, Netherlands, 4Institute of Education and Child Studies, University of Leiden, Leiden, Netherlands
Synopsis
Large scale efforts are being employed to link Major Depressive Disorder (MDD) to cortical alterations in gray and white matter, though often, limited resolution prevents conclusions regarding the source. Here we used quantitative 7T MRI to explore the myeloarchitecture of the cortex in people suffering from MDD in order to unravel potential mechanisms underlying the psychopathology of MDD. We find altered T1-profiles in the rostral ACC, lateral PFC and OFC in MDD compared to healthy controls, indicating changes in cortical myeloarchitecture. Overall, cortical T1 values were higher in MDD, suggesting lower cortical myelination.
Introduction
Major depressive disorder (MDD) is one of the most prevalent and debilitating psychiatric disorders, affecting hundreds of millions of people worldwide. Earlier magnetic resonance imaging studies have associated MDD with thinner cortex in the (para)limbic circuitry, including orbitofrontal cortex (OFC), medial prefrontal cortex (mPFC) and rostral anterior cingulate cortex (rACC)1. Quantitative imaging can potentially resolve the myelin distribution over the cortical layers and possible demyelination beyond what can be covered by volumetric analysis alone. Here, we specifically aimed to study the myeloarchitecture of the cerebral cortex using ultrahigh field MRI (7T) and quantitative multiparametric mapping (T1 and T2*). T1-variations in gray matter are for a large part explained by myelin concentration2,3,4,5, while T2*-values are associated with iron content, brain tissue damage, or resting state neuronal activity6. Distribution of relaxation time values across the layers of the cortex could provide insights in the way structural integrity is affected by MDD.Methods
Images of 73 individuals (14 healthy controls; 59 patients diagnosed with MDD) were acquired using a Philips Achieva 7T MRI scanner with a 32-channel head array coil. We used a submillimeter MP2RAGEME (multi-echo magnetization-prepared rapid gradient echo)7 sequence with the following parameters: TE1= 3 ms, TE2,1–4 = 3, 11.5, 19, 28.5 ms, flip angles = 4°/4°, TRGRE1,2 = [6.2 ms, 31 ms], FOV = 205×205×164 mm; nominal voxelsize = 0.7 mm isotropic. Fat-navigator based motion correction was used to improve edge definition8. T1-maps were computed using a look-up table9 and T2*-maps were computed by least-squares fitting of the exponential signal decay over the multi-echo images of the second inversion. The T1-weighted anatomical image was processed following a pipeline designed to optimize laminar accuracy. Delineation of cortical areas was based on the Desikan-Killiany atlas, following the MDD-ENIGMA consortium1. To limit the multiple comparisons problem, we selected three ROIs that showed the highest effect sizes in the ENIGMA-study1 (rACC, mOFC, and lPFC), which were sampled to the subjects’ volumetric space and applied to the T1-/T2*-data that was sampled to 10 cortical depths using Nighres’ profile sampling module, resulting in 10 values for each region for each subject. Statistical testing consisted of t-tests implemented in JASP to elucidate effects across groups.Results
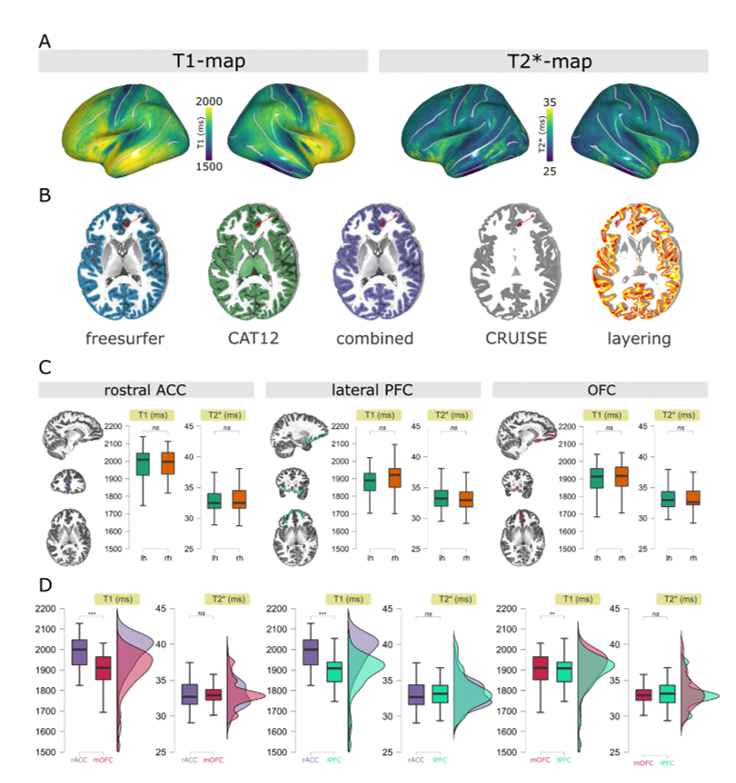
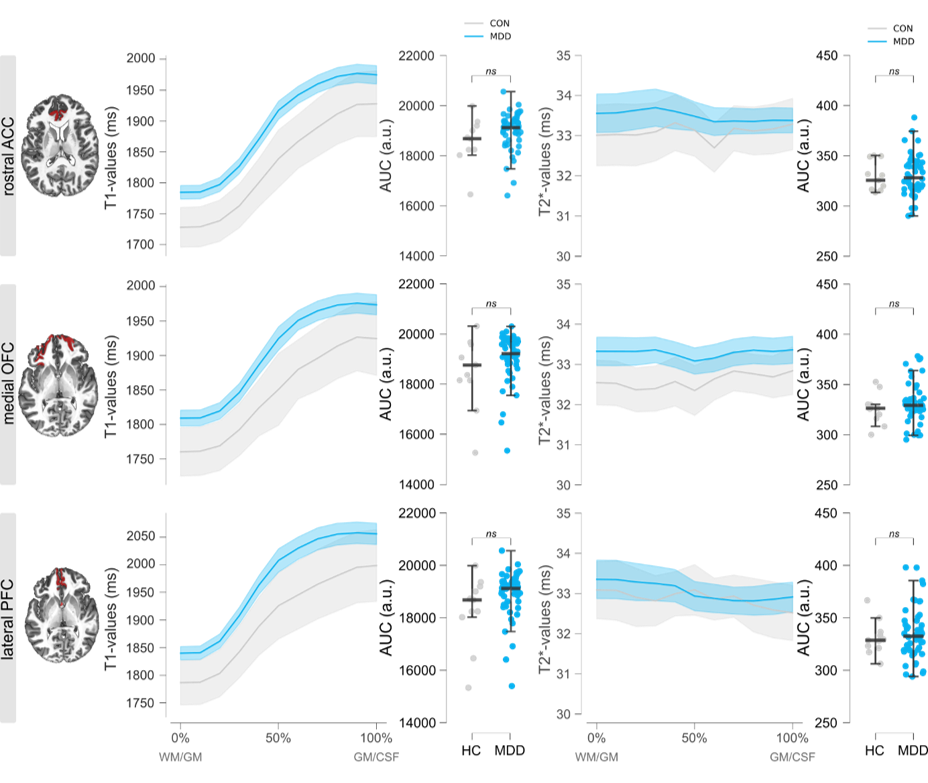
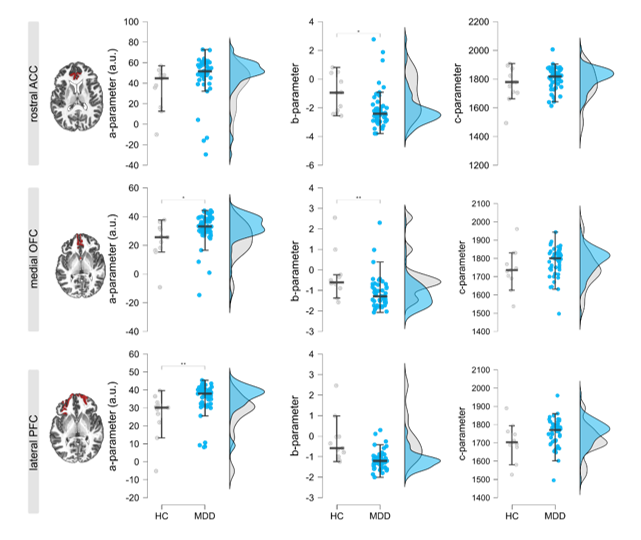
Average T1/T2*-maps sampled to the surface are shown in Figure 1A, showing the classical pattern of reduced T1/T2*-values in the sensorimotor cortex4,6. Figure 1B highlights the endeavors taken to improve segmentation as much as possible. Note that basing results solely on a FreeSurfer segmentation comes at the risk of underestimating T1-profiles towards to pial surface (red arrow). Given that the atlas labels of the ROIs are based on FreeSurfer’s segmentation, we dilated the ROIs and multiplied them with our optimized segmentation to maximally sample the cortex. Obtained T1/T2*-values are in line with the literature and are consistent across hemispheres (any effects did not survive Bonferroni correction). Figure 2 shows the profiles of T1-/T2*-values across cortical depth in people suffering from MDD compared to healthy controls (line plots), as well as the area under the curve (AUC; distribution plots), obtained by fitting a 2nd-order polynomial to the profiles. For all ROIs, the T1-profiles of the MDD-group lie above those of the HC-group, especially at ~50% cortical depth, indicative of altered T1-distributions in this group. No statistical effects were found for T2*-parameters and these were therefore excluded from the additional parameter fit analysis. The polynomial fit analysis in T1-profiles revealed differences across groups: the A-parameter of the MDD group was greater than the healthy control group in the medial OFC (t60 = -2.485, p =.016) and lateral PFC (t60 = -2.909, p = 0.005). The B-parameter of the MDD group was decreased in the rostral ACC (t60 = 2.493, p = .015) and medial OFC (t60 = 3.018, p = .004). Only the A-parameter effect in the lateral PFC and the B-parameter effect in the medial OFC survived the Bonferroni correction for multiple comparisons with a threshold of p < .007.Discussion
Here, we used high resolution, motion corrected, quantitative MRI at 7T to probe detailed properties of the cortex in regions crucially implicated in MDD, e.g. the rostral ACC, medial OFC, and lateral PFC. We find alterations in characteristics of T1-, but not T2*-profiles, in patients with MDD, with reduced T1-values across the cortical ribbon, suggestive of decreased myelin content. Parameters obtained from polynomial fits can be informative for the general shape of cortical profiles, but their functional implications are yet to be determined and should be complemented by other measures of shape such as the non-linearity index reflecting the amount of deviation from a linear regression fit3. Lastly, these results should be interpreted with caution due to the limited size of the healthy control group, but underscore the promise of quantitative 7T MRI for psychiatric applications. To overcome some of the effects this might have, future research will focus on analyses within the MDD group, to relate these parameters to disease severity and other metrics.Conclusion
We show here the feasibility of quantitative MRI with a psychiatric application. T1-values across the cortical ribbon were altered in MDD compared to healthy controls, possibly benefiting insights in functional characterization of aberrant circuitry that underpin psychopathology.Acknowledgements
This work was supported by a Amsterdam Neuroscience Alliance Grant 2018.References
1Schmaal, et al., (2017) Mol Psychiatry. 22: 900-909
2Ferguson, et al., (2018) Neuroinformatics. 6: 181-196
3Sprooten, et al., (2019) NeuroImage. 185: 27-34
4Cohen-Adad, et al., (2012) NeuroImage. 60: 1006-1014
5McColgan, et al., (2021) Hum Brain Mapp; 42: 4996-5009
6Cho, et al. (2010) J Psychiatr Res. 44: 881-886
7Caan, et al., (2018) Hum Brain Mapp; 40: 1786-1798
8Bazin, et al., (2020) NeuroImage. 222: 117227
9Marquez, et al. (2010) NeuroImage. 49: 1271-1281
Figures