2028
Diagnosis of Schizophrenia, Bipolar, and Attention Deficit Hyperactivity Disorders using Graph-Theory Features of Resting-State fMRI
Faezeh Ghasemi1,2, Hosna Tavakoli3,4, Saeed Masoudnia 4, Narges Hoseini Tabatabaei5, Reza Rostami6, and Mohammad-Reza Nazem-Zadeh4,7
1Medical Physics and Engineering, Shahid Beheshti University of Medical Sciences, Tehran, Iran (Islamic Republic of), 2Research Center for Biomedical Technologies and Robotics, Tehran University of Medical Sciences, Tehran, Iran (Islamic Republic of), 3cognitive neuroscience, Institute for Cognitive Science Studies, Tehran, Iran (Islamic Republic of), 4Research Center for Molecular and Cellular Imaging, Tehran University of Medical Sciences, Tehran, Iran (Islamic Republic of), 5Medical School, Tehran University of Medical Sciences, Tehran, Iran (Islamic Republic of), 6Department of Psychology, University of Tehran, Tehran, Iran (Islamic Republic of), 7Medical Physics and Biomedical Engineering, Tehran University of Medical Sciences, Tehran, Iran (Islamic Republic of)
1Medical Physics and Engineering, Shahid Beheshti University of Medical Sciences, Tehran, Iran (Islamic Republic of), 2Research Center for Biomedical Technologies and Robotics, Tehran University of Medical Sciences, Tehran, Iran (Islamic Republic of), 3cognitive neuroscience, Institute for Cognitive Science Studies, Tehran, Iran (Islamic Republic of), 4Research Center for Molecular and Cellular Imaging, Tehran University of Medical Sciences, Tehran, Iran (Islamic Republic of), 5Medical School, Tehran University of Medical Sciences, Tehran, Iran (Islamic Republic of), 6Department of Psychology, University of Tehran, Tehran, Iran (Islamic Republic of), 7Medical Physics and Biomedical Engineering, Tehran University of Medical Sciences, Tehran, Iran (Islamic Republic of)
Synopsis
Accurate and specific diagnosis of mental disorders is very important for effective, customized, and personalized treatments, which would be made more possible based on individual neuroimaging data. In this study, we classified schizophrenia (SZ), bipolar disorder (BD), and attention deficit hyperactivity disorder (ADHD) cohorts, vs. healthy control (HC) cohort, using extracted graph features from Resting-State fMRI (rs-fMRI) images. The graph-based connectivity features of limbic, auditory, visual, and default mode networks were identified as the most separating features for the SZ, BD and, ADHD groups from the HC group among brain networks.
Introduction
One of the challenges in the neuropsychiatric disorders treatment is the specificity in their diagnosis [1]. Schizophrenia (SZ), bipolar disorder (BD), and attention deficit hyperactivity disorder (ADHD) are among mental disorders with some mimicking psychiatric and behavioral manifestations to some extent. Neuroimaging evidence can help clinicians make more accurate and specific diagnosis resulting [2].It is very helpful to know which brain networks can distinguish between these mental disorders. In this study, we performed automatic binary classification of SZ, BD and ADHD using ensemble RUSBoost tree [3] and extracting graph-theoretic features from rs-fMRI OpenfMRI dataset. Also, two feature selection algorithms (minimal-redundancy maximal relevance (MRMR) [4], Relief [5]) were investigated to achieve a high accuracy and the most discriminative brain networks.Method
The Open-fMRI dataset included 130 Healthy, 50 schizophrenia, 49 bipolar disorder, and 43 ADHD subjects [6]. T2*-weighted echoplanar imaging (EPI) sequence was used for functional MRI data with the following parameters: slice thickness=4 mm, 34 slices, TR=2 s, TE=30 ms, flip angle=90°, matrix 64 × 64, FOV=192 mm, oblique slice orientation [6]. The rs-fMRI data samples were first preprocessed to reduce noise and normalize the images. Then, we used the automated anatomical labeling to parcellate the brain into 116 region and construct a region connectivity matrix. We construct a weighted undirected graph and computed graph measures for each subject. Local graph measures used in this study are betweenness centrality, degree, local efficiency and participation coefficient. The most discriminant features were chosen using MRMR and Relief feature selection algorithm. Finally, an ensemble RUSBoost tree classifier was trained and tested on discriminant graph features (Figure 1).Results
Figure 2 shows the classification accuracy of the mental disorders using two feature selection algorithms: MRMR and Relief. The accuracy for diagnosing ADHD, SZ and BD vs. HC using Relief feature selection algorithm was reached 75%, 76.4%, and 71.7%, respectively. The brain networks that were effective in diagnosing mental disorders are given in Figure 3. The classification accuracy of disorders using the extracting graph features from brain networks is given in Figure 4.Discussion
We can conclude that SZ cases experienced different graph-based connectivity features in both the limbic and auditory networks compared to the control subjects. While BD and ADHD cases manifested different graph-based connectivity features in limbic and default mode networks; and in visual network; respectively. Systematic reviews and meta-analysis studies demonstrate dysconnectivity in the limbic network in SZ [7]. The core symptoms of SZ can be divided into negative and positive symptoms. Auditory hallucination (AH) is the most common positive symptom observed in patients with SZ. However, the neural substrate is still under investigation. Most rs-fMRI along with fMRI and structural MRI studies on AH has focused on auditory and language regions. There are studies that showed decreased connectivity between the auditory cortex and limbic regions [8]. Abnormal connectivity between the superior temporal gyrus, known as an important node of the auditory network, and other areas is common in AH [9-11]. Bipolar disorder is a mental disorder that a person involved experiences mood swings between mania or depression. Dysfunction in the brain networks have been a matter of issue to this disorder. By reviewing articles in the field, the results from this work are explained. Atypical connectivity in the affective network is replicated in rs-fMRI studies on BD [12]. There is evidence that BD exhibits hyper-connectivity within the affective network, especially in the anterior cingulate cortex extending to the superior frontal gyrus and medial prefrontal cortex. Affective network has a similar role and common nodes as the limbic network in the brain. Although there are some limitations in the case of ADHD due to lesser evidence on rs-fMRI in comparison to discussed disorders, common regions and networks are found in reviews. The studies relate large-scale brain networks, such as frontoparietal, dorsal attentional, motor, visual, and default networks to the ADHD functional and structural literature. [13]. Insights emerging from mapping the networks help to understand neuro neuropsychological and behavioral aspects of ADHD. For example, the possible role of the primary visual cortex in attentional dysfunction in the disorder [14, 15].Acknowledgements
This work was supported by Iran’s National Elites Foundation, Ahmadi-Roshan Grant, in 2021.References
1. Algunaid, R.F., et al., Schizophrenic patient identification using graph-theoretic features of resting-state fMRI data. Biomedical Signal Processing and Control, 2018. 43: p. 289-299. 2. Brown, M.R., et al., ADHD-200 Global Competition: diagnosing ADHD using personal characteristic data can outperform resting state fMRI measurements. Frontiers in systems neuroscience, 2012. 6: p. 69. 3. Seiffert, C., et al. RUSBoost: Improving classification performance when training data is skewed. in 2008 19th International Conference on Pattern Recognition. 2008. IEEE. 4. Peng, H., F. Long, and C. Ding, Feature selection based on mutual information criteria of max-dependency, max-relevance, and min-redundancy. IEEE Transactions on pattern analysis and machine intelligence, 2005. 27(8): p. 1226-1238. 5. Kira, K. and L.A. Rendell, A practical approach to feature selection, in Machine learning proceedings 1992. 1992, Elsevier. p. 249-256. 6. Poldrack, R.A., et al., A phenome-wide examination of neural and cognitive function. Scientific data, 2016. 3(1): p. 1-12. 7. Brandl, F., et al., Specific substantial dysconnectivity in schizophrenia: a transdiagnostic multimodal meta-analysis of resting-state functional and structural magnetic resonance imaging studies. Biological psychiatry, 2019. 85(7): p. 573-583. 8. Oertel-Knöchel, V., et al., Association between symptoms of psychosis and reduced functional connectivity of auditory cortex. Schizophrenia research, 2014. 160(1-3): p. 35-42. 9. Hoffman, R.E., et al., Elevated functional connectivity along a corticostriatal loop and the mechanism of auditory/verbal hallucinations in patients with schizophrenia. Biological psychiatry, 2011. 69(5): p. 407-414. 10. Sommer, I.E., et al., Resting state functional connectivity in patients with chronic hallucinations. 2012. 11. Diederen, K., et al., Aberrant resting-state connectivity in non-psychotic individuals with auditory hallucinations. Psychological medicine, 2013. 43(8): p. 1685-1696. 12. Wang, Y., et al., Large-scale network dysfunction in the acute state compared to the remitted state of bipolar disorder: A meta-analysis of resting-state functional connectivity. EBioMedicine, 2020. 54: p. 102742. 13. Castellanos, F.X. and E. Proal, Large-scale brain systems in ADHD: beyond the prefrontal–striatal model. Trends in cognitive sciences, 2012. 16(1): p. 17-26. 14. Shulman, G.L., et al., Interaction of stimulus-driven reorienting and expectation in ventral and dorsal frontoparietal and basal ganglia-cortical networks. Journal of Neuroscience, 2009. 29(14): p. 4392-4407. 15. Capotosto, P., et al., Frontoparietal cortex controls spatial attention through modulation of anticipatory alpha rhythms. Journal of Neuroscience, 2009. 29(18): p. 5863-5872.Figures
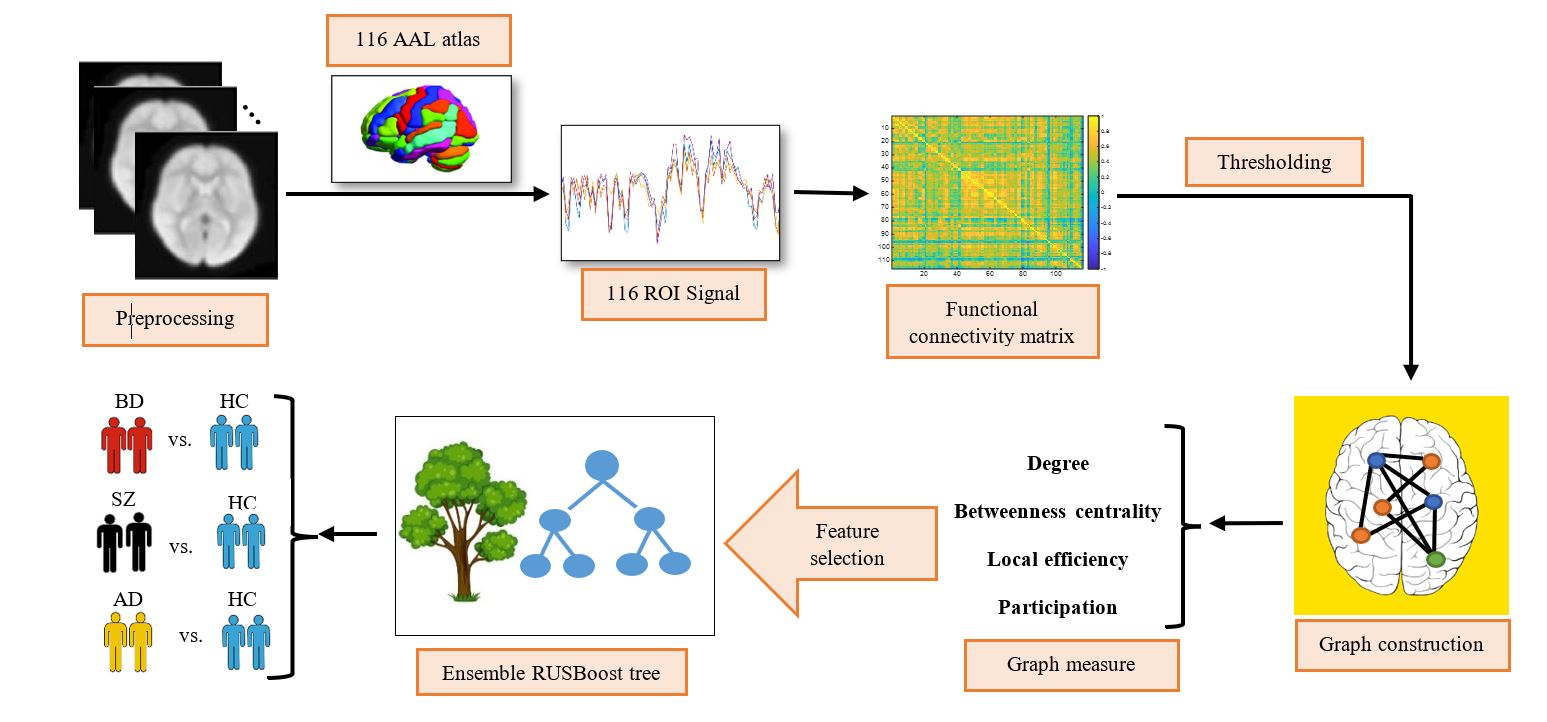
Figure 1- Block diagram of the
proposed system for estimating the probability of a mental disorder. The fMRI
images first were preprocessed and then parcellated into 116 regions and
constructed a region connectivity matrix. After constructing a weighted
undirected graph, we computed local graph measure for each subject. Finally, we
diagnosed ADHD, BD and SZ by using feature selection algorithm for select the
most separable feature and ensemble RUSBoost tree
for classification (HC: healthy controls, BD: bipolar disorders, SZ:
schizophrenia disorders, AD: ADHD disorders).
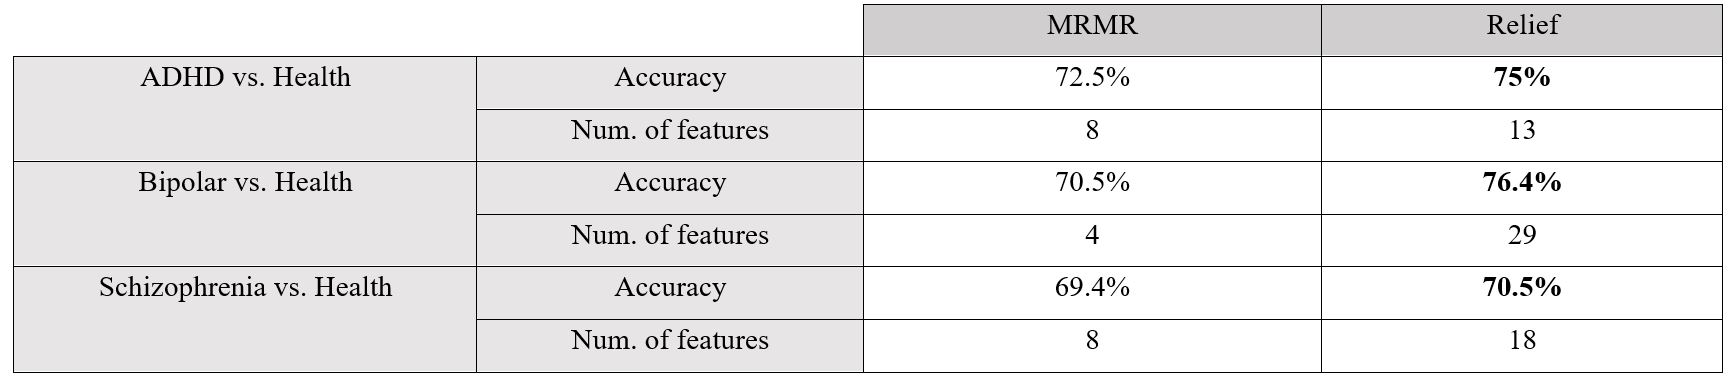
Figure 2- The classification accuracy
of mental disorders using two feature selection and ensemble RUSBoost tree
classifier. As you can see, the MRMR feature selection is better able
to detect disorders.
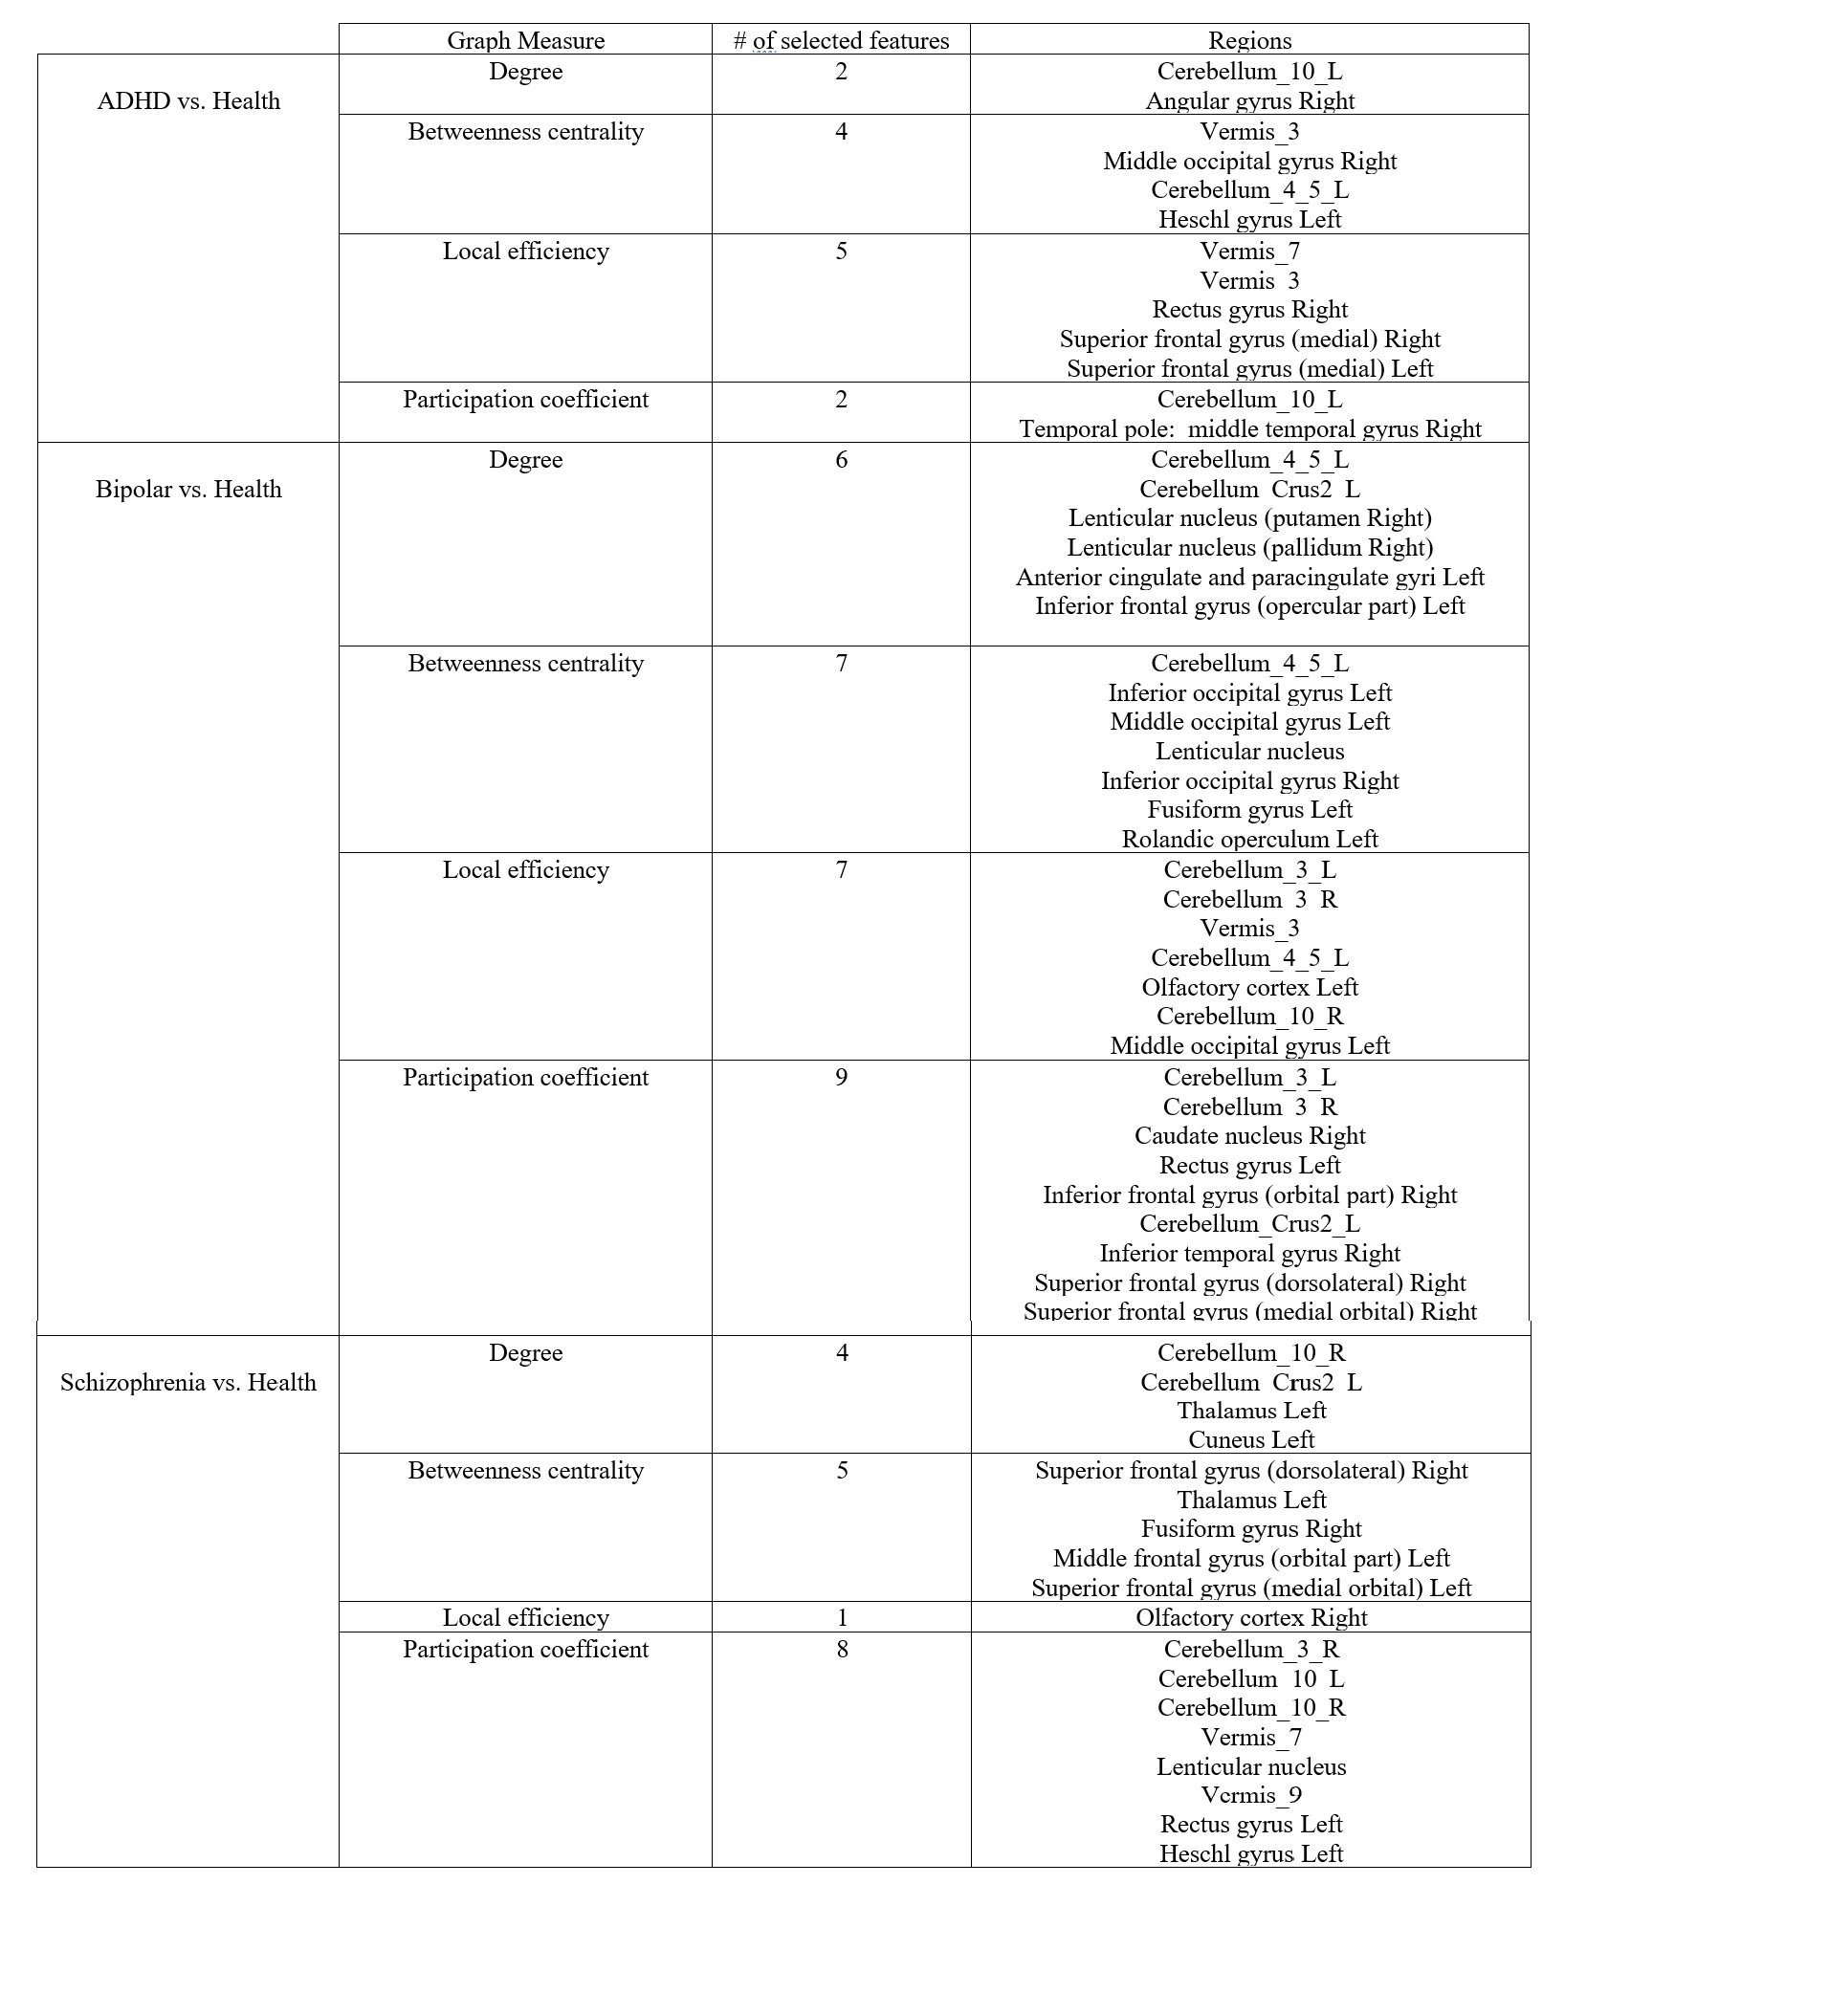
Figure 3- The selected brain
regions by the feature selection algorithm that leads to the high accuracy.
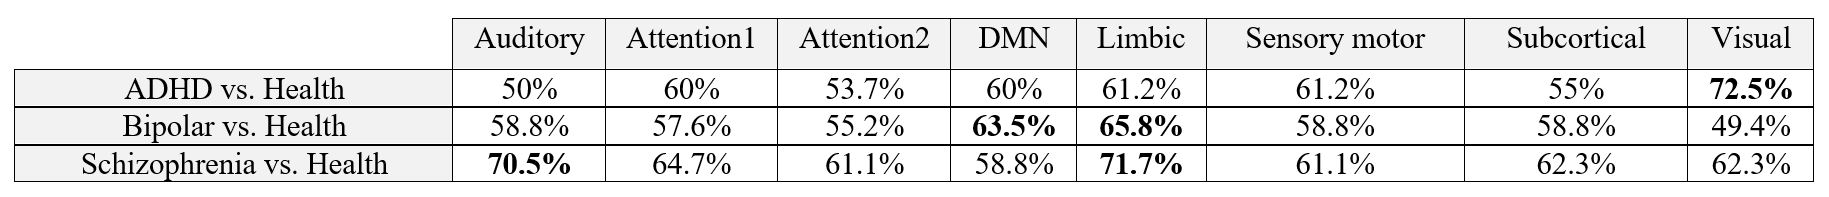
Figure 4- The classification accuracy
of mental disorders using extracted graph features from brain networks and
ensemble RUSBoost tree classifier.
DOI: https://doi.org/10.58530/2022/2028