2026
Neuromelanin MRI as biomarker for treatment resistance in first episode schizophrenia patients1Amsterdam UMC, Amsterdam, Netherlands, 2Columbia University Medical Center, New York, NY, United States
Synopsis
The current study assesses neuromelanin sensitive MRI (NM-MRI) as a potential biomarker for treatment resistance (TR) in first episode schizophrenia patients. NM-MRI is a novel MRI sequence, which indirectly measures dopamine synthesis. Research using positron emission tomography (PET) imaging suggest that TR patients show lower dopamine synthesis than responders. We acquired NM-MRI in 61 first episodes schizophrenia patients. Treatment response was determined during 6 months follow-up. TR patients showed significantly lower NM-MRI signal compared to responders. These findings are in line with previous PET studies and demonstrate the potential of NM-MRI as alternative and more accessible biomarker for TR.
Purpose
Treatment resistance (TR) in schizophrenia is a major clinical problem with 20-35% of psychotic patients showing non-response to standard antipsychotic treatment1. A biomarker that could predict TR is needed to reduce delays in effective treatment. A well-established finding in schizophrenia, using [18F]F-DOPA PET imaging, is increased striatal dopamine synthesis, but interestingly TR patients do not show this altered synthesis2. [18F]F-DOPA however is too costly and invasive to use for TR screening. A novel neuromelanin-sensitive MRI sequence (NM-MRI), which indirectly measures striatal dopamine synthesis3, has potential as biomarker for TR. NM-MRI signal is indeed increased in schizophrenia patients, but has not yet been evaluated in TR4. The current study assessed NM-MRI as a biomarker for TR and investigated if TR patients show lower NM-MRI signal than responders.Methods
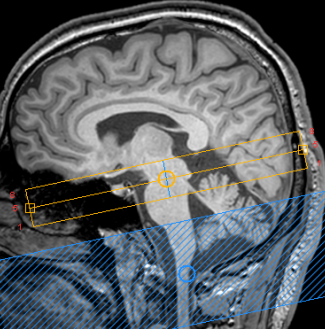
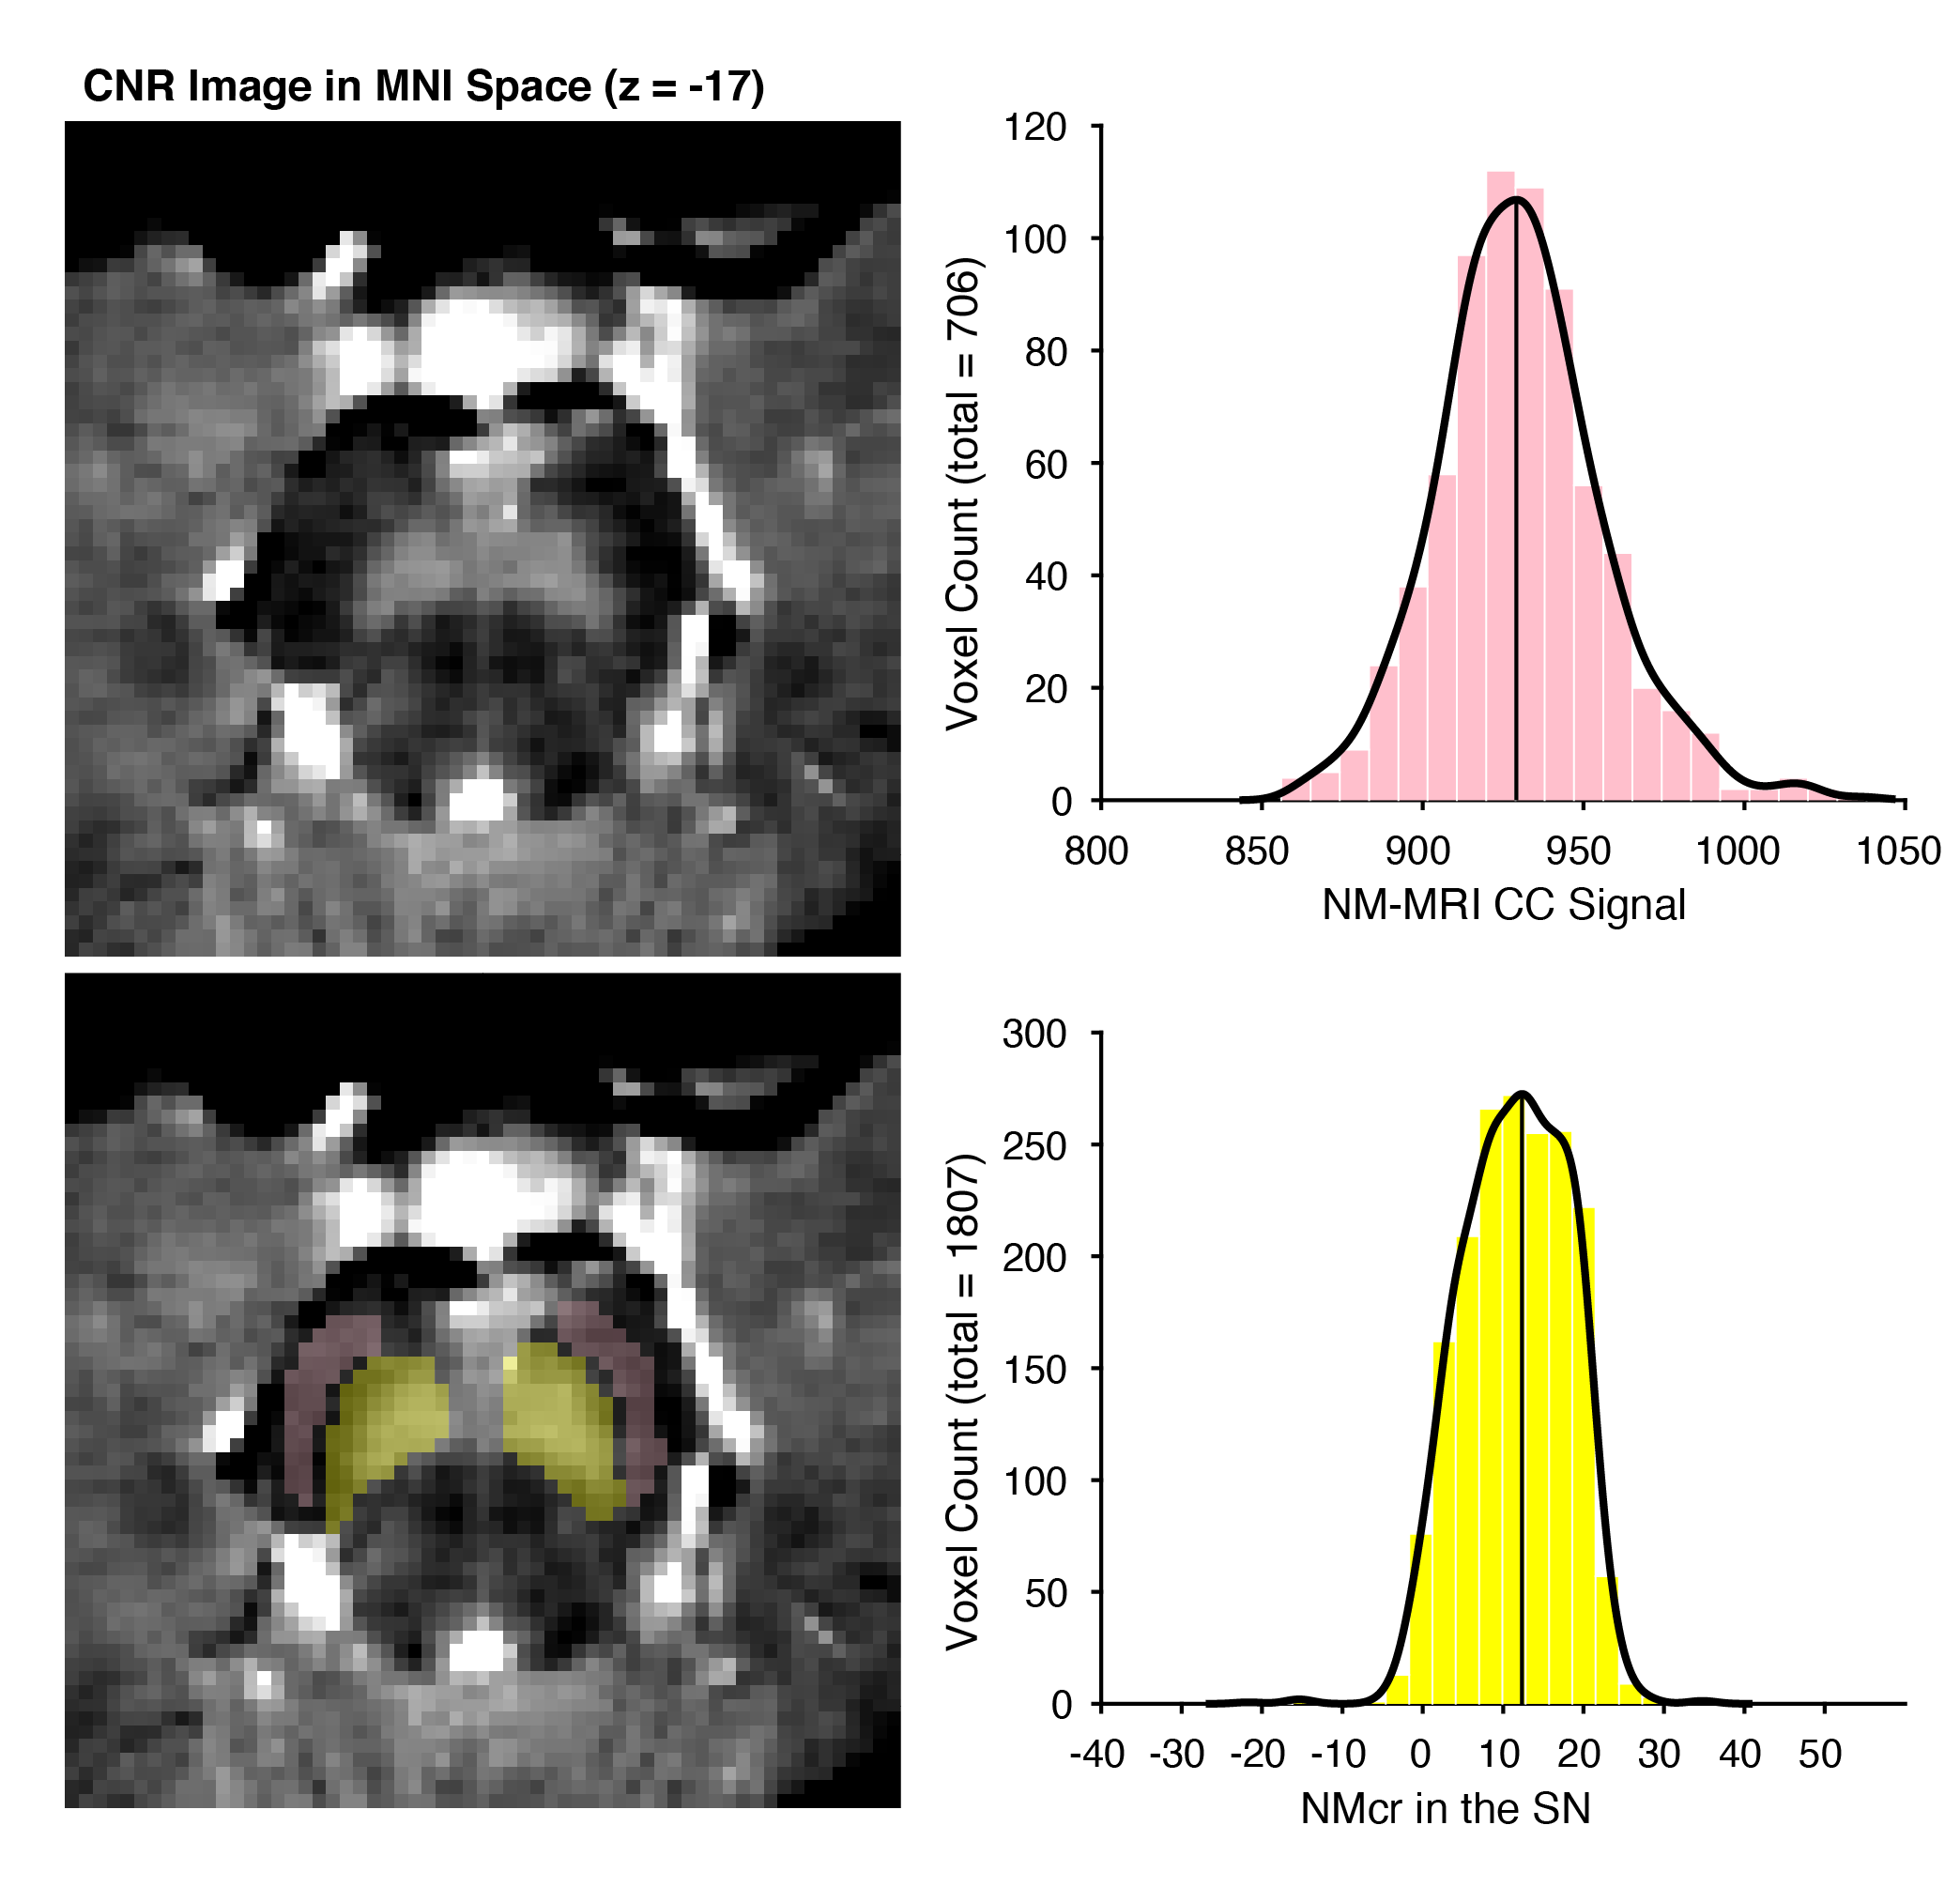
61 first episode schizophrenia patients underwent an MRI scan at baseline. Treatment response was determined during six months follow-up. A patient was classified as TR after showing no adequate response to a minimum of two sufficiently dosed conventional antipsychotics. MRI scans were conducted on an 3 Tesla Ingenia MRI scanner equipped with a 32-channel sense head coil. T1-weighted scans were acquired for processing of the NM-MRI image (TR/TE=4.1/9.0 msec; 189 slices; FOV=84×284×170 mm; voxel size= 0.9×0.9× 0.9 mm, FA = 8°). NM-MRI scan contained a T1-weighted gradient recalled echo sequence with resonance magnetization transfer preparation pulses (TE/TR=3.9/260 msec, FA=40°, 8 slices, slice thickness=2.5 mm, in‐plane resolution=0.39×0.39 mm2, FOV=162×199 mm, NSA=2;) and was placed perpendicular to the fourth ventricle floor with coverage from the posterior commissure to halfway through the pons (Figure 1). NM-MRI signal in the Substantia Nigra (SN) was measured as contrast ratio (NMcr), with the Crus Cerebri (CC) as reference region. The toolbox described by Wengler (2020)5 was used for processing of the NM-MRI scan. First the T1-weigthed scans were used to normalize the NM-MRI scans to MNI standard space using ANTS 2.3.1.6 The normalized NM-MRI scans were then spatially smoothed using 3D Gaussian kernels with full-width-at-half-maximum of 1 mm. Template masks from a previous study3 were used to obtain the signal intensity (S) of the SN and CC (Figure 2). NMcr was calculated at each voxel in the NM-MRI images as NMcr= (SSN – mode(SCC)/ mode(SCC)) * 100. A One-way ANCOVA was conducted to assess group differences between TR and responders on mean NMcr controlling for age. Age was added as covariate, since neuromelanin levels in the SN show an inverted U-shaped age effect7.Results
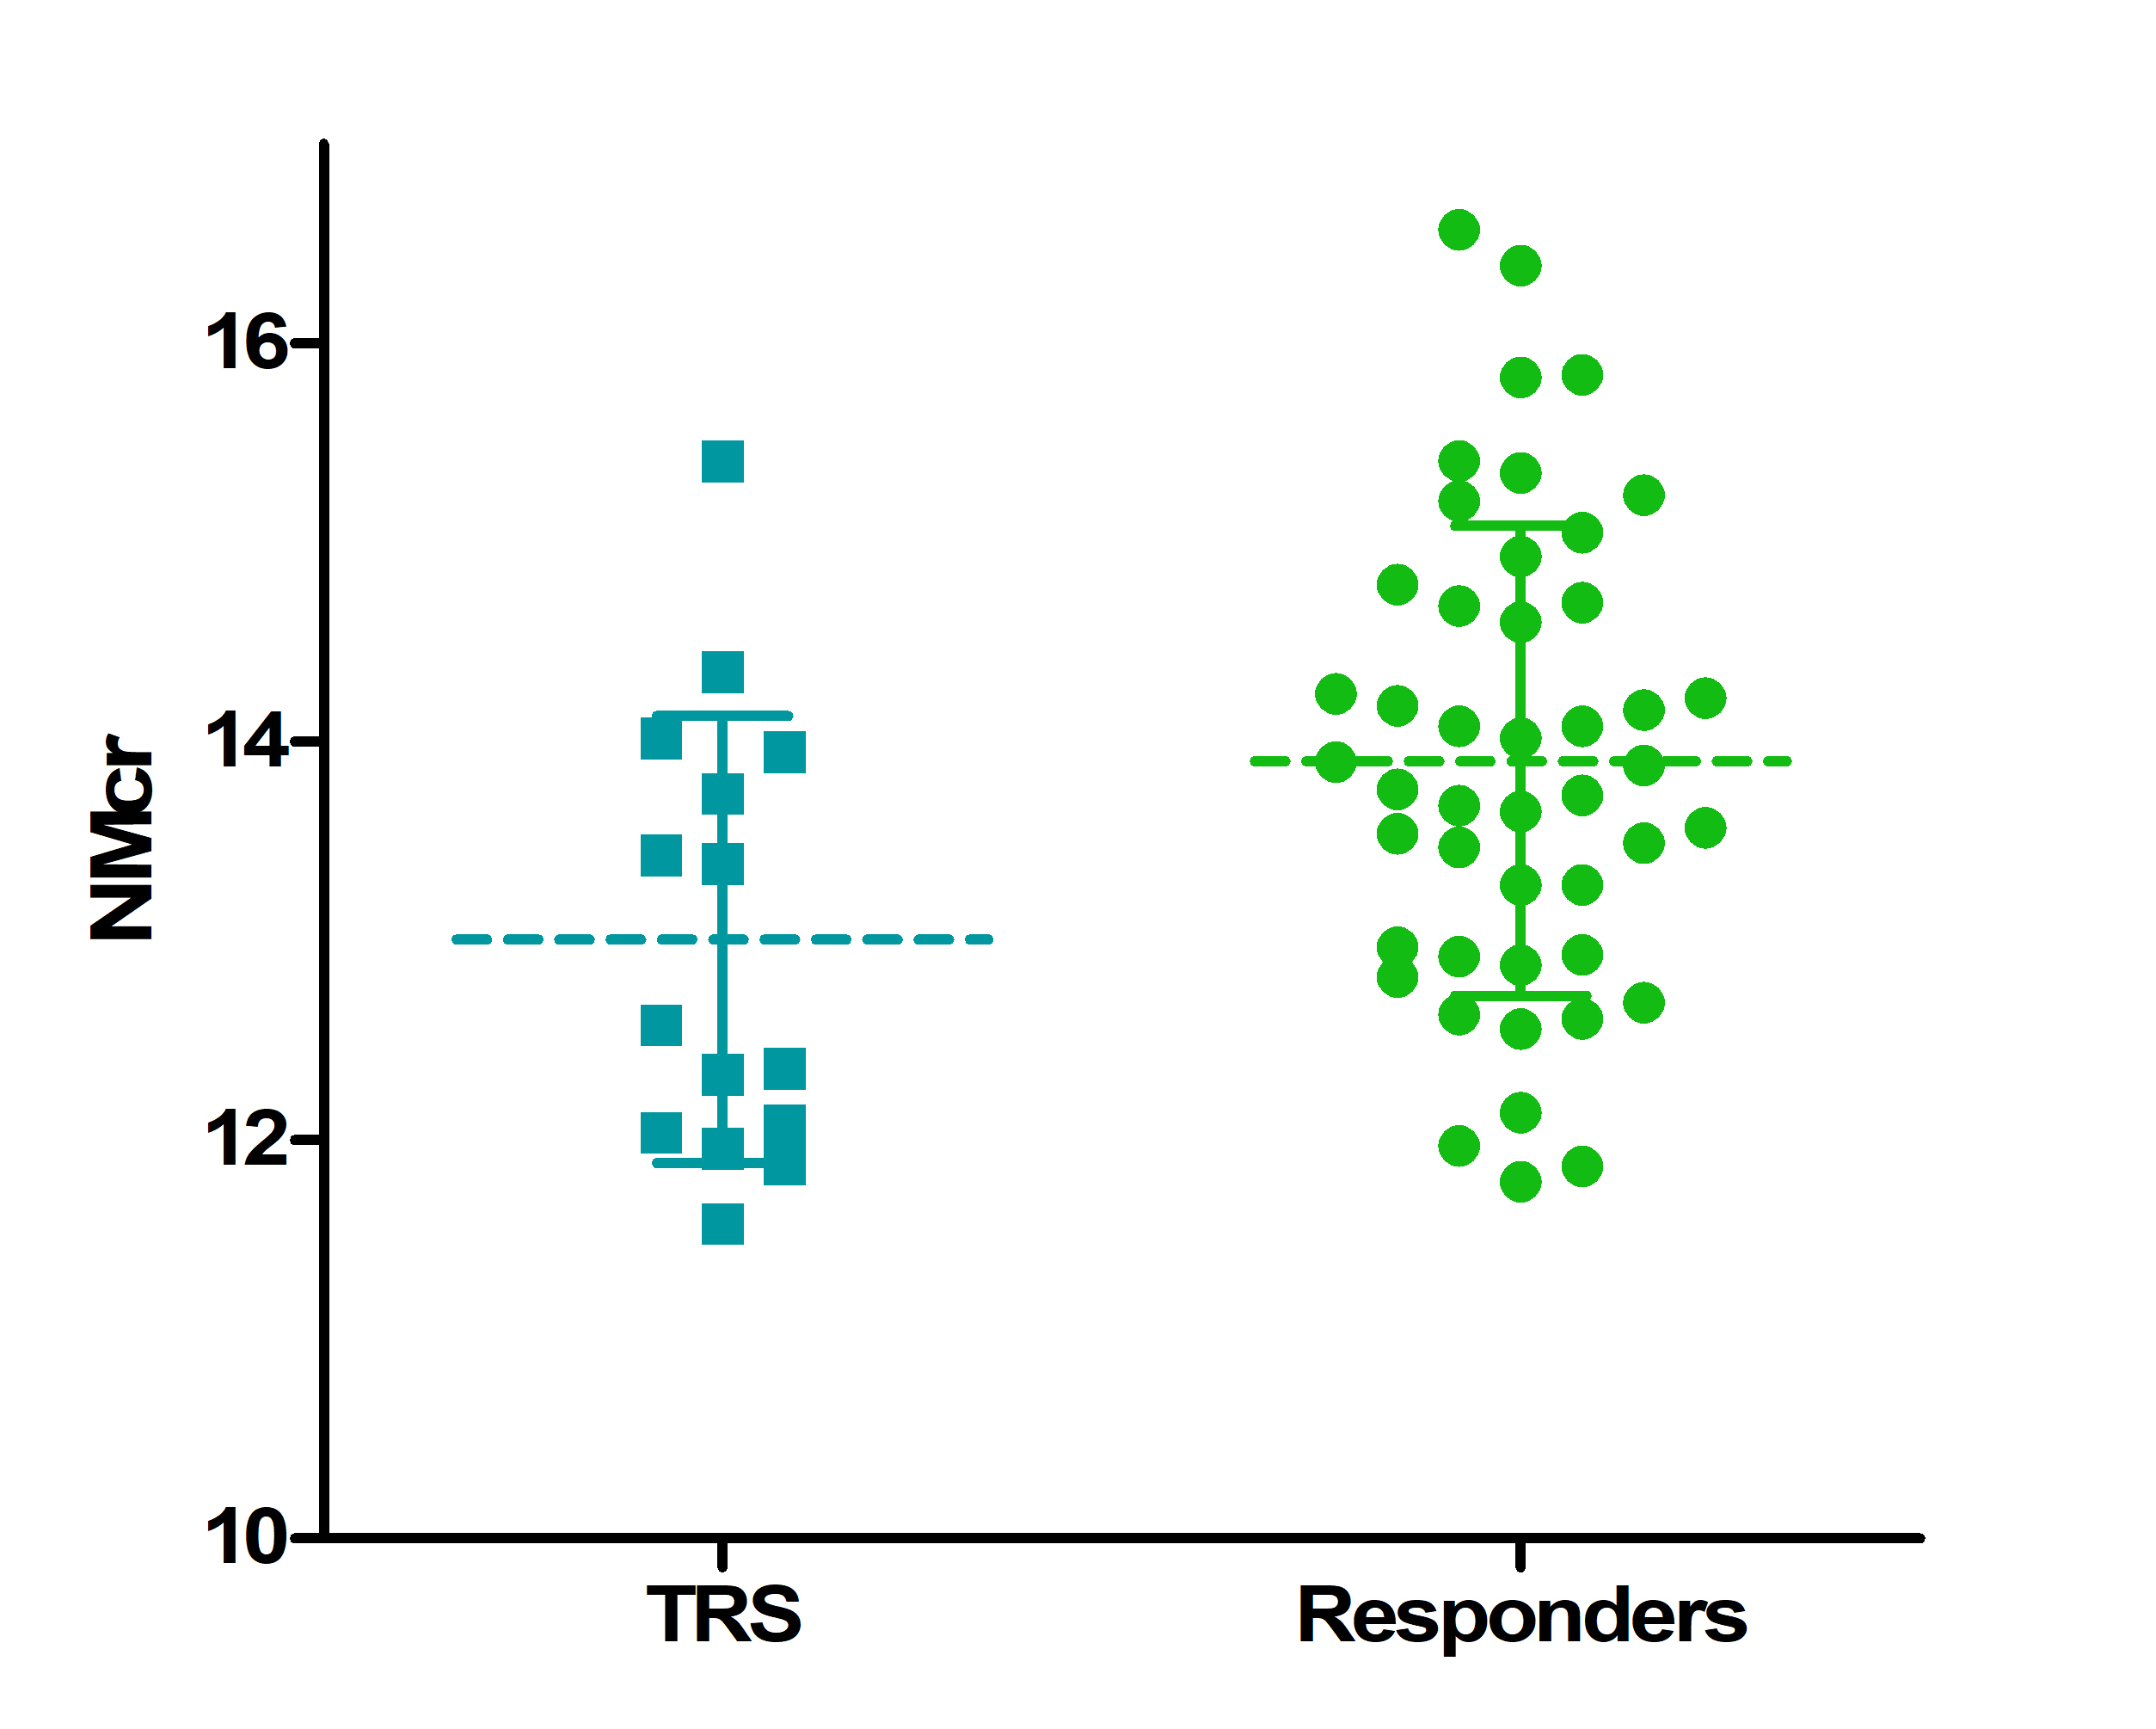
At six months of follow-up 15 patients were classified as TR and 46 patients as responders. The two groups did not significantly differ on gender, IQ, use of medication, and substance use. However, the mean age of TR patients was lower than responders, t(59)= -2.876, p = 0.007. The ANCOVA revealed a significant effect of group (TR versus responder) on mean NMcr after controlling for age, F(1,58) = 5.064, p = 0.028. Age was not a significant covariate, F(1,58) = 0.457, p = 0.502. In addition no correlation was found between age and NMcr, r =0.177, p =0.172.Discussion
Significantly lower NMcr levels were found in TR patients compared to responders. These findings are in line with the [18F]F-DOPA PET studies showing lower dopamine synthesis in TR compared to responders. This study demonstrates the promise of NM-MRI as biomarker for TR although the application of NM-MRI as a predictor for TR remains uncertain given the overlap in NMcr levels between TR and responders (Figure 3). A possible explanation for this might be that binary categorizing patients as either TR or responders is not appropriate as the response to antipsychotics could be a spectrum, including a group of partial responders. This will be further assessed. In addition, we will map the regional voxelwise variation within the current template mask. The template mask is purposefully over inclusive to ensure that all SN voxels are included in the mask and conversely some voxels outside the SN might be incorrectly included. This could influence the mean signal intensity to various degree in different subjects. No correlation was found between age and NMcr. Even though neuromelanin is known to increase with age, this increase is most steeply until the age of 207. Since the mean age of our two patients groups (21.3 and 24.3 years) is slightly higher, the effect of age on our results might be limited.Conclusion
This study demonstrated the potential of NM-MRI as a biomarker for TR in schizophrenia. Even though the results of this study show significant differences in NMcr between TR and responders, the predictive value of NM-MRI still requires further investigation.Acknowledgements
Acknowledgments / Funding Information: The study was funded by a Veni grant (91618075) from the Netherlands Organisation for Health Research and Development (ZonMw). The funders had no role in study design, data collection and analysis, decision to publish, or preparation of the manuscript.References
1. Farooq S, Agid O, Foussias G, Remington G. Using treatment response to subtype schizophrenia: Proposal for a new paradigm in classification. Schizophrenia Bulletin. 2013; 39(6):1169-1172.
2. Demjaha A, Murray R. M, McGuire, PK, Kapur, S., & Howes, OD. (2012). Dopamine synthesis capacity in patients with treatment-resistant schizophrenia. American Journal of Psychiatry. 2012;169(11):1203-1210.
3. Cassidy CM, Zucca FA, Girgis RR, et al. Neuromelanin-sensitive MRI as a noninvasive proxy measure of dopamine function in the human brain. Proc. Natl. Acad. Sci. U. S. A. 2019;116:5108–5117
4. Shibata E, Sasaki M, Tohyama K, et al. Use of neuromelanin-sensitive MRI to distinguish schizophrenic and depressive patients and healthy individuals based on signal alterations in the substantia nigra and locus ceruleus. Biological psychiatry. 2008;64(5):401-406.
5. Wengler K, He X, Abi-Dargham A, Horga G. Reproducibility Assessment of Neuromelanin-Sensitive Magnetic Resonance Imaging Protocols for Region-of-Interest and Voxelwise Analyses. Neuroimage 2019:1–37
6. Avants BB, Tustison N, Song G. Advanced normalization tools (ANTS). Insight j. 2009;2;1–35.
7. Xing Y, Sapuan A, Dineen RA, Auer DP. Life span pigmentation changes of the substantia nigra detected by neuromelanin-sensitive MRI. Mov. Disord. 2018;33:1792–1799 doi: 10.1002/mds.27502.
Figures