2024
Structural abnormalities in patients with early psychosis: a MP2RAGE-based morphometric study at 7T1Animal imaging and technology core (AIT), Center for Biomedical Imaging (CIBM), Ecole Polytechnique Fédérale de Lausanne (EPFL), Lausanne, Switzerland, 2Center for Psychiatric Neuroscience, Department of Psychiatry, Centre Hospitalier Universitaire Vaudois (CHUV) and University of Lausanne (UNIL), Lausanne, Switzerland, 3Service of General Psychiatry, Department of Psychiatry, Centre Hospitalier Universitaire Vaudois (CHUV) and University of Lausanne (UNIL), Lausanne, Switzerland
Synopsis
This study aims to investigate grey matter alterations in early psychosis patients (n = 44) compared to healthy control subjects (n=30). Morphometric analysis using MP2RAGE images at 7T. VBM did not reveal significant cluster after FWE (Family-Wise Error) corrections, but suggested grey matter reduction (uncorrected p<0.005) in the globus pallidus, right thalamus, left inferior temporal gyrus, left superior parietal, left paracentral lobule, left precuneus, right parietal lobe (postcentral gyrus) of patients compared to healthy subjects.
Introduction
Neuroimaging studies have revealed reductions in grey matter volumes in patients with schizophrenia, which are associated with psychotic symptoms and cognitive impairments 1,2. Most of these volumetric studies in schizophrenia were performed based on MPRAGE images acquired at 1.5T and 3T. However, due to subtle brain abnormalities in early psychosis, it is important to use sensitive neuroimaging techniques to detect small regional tissue differences. Several studies have demonstrated greater reproducibility and higher tissue contrast using MP2RAGE relative to MPRAGE images, which imply MP2RAGE may be a more sensitive method for the investigation of volumetric biomarkers 3,4. Furthermore, the use of high magnetic fields could further enhance measurement sensitivity. This study aims to investigate grey matter alterations in early psychosis patients compared to healthy control subjects by morphometric analysis using for the first time MP2RAGE images at 7T.Methods
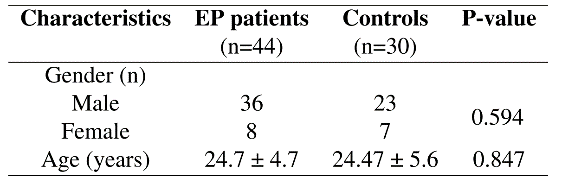
74 subjects, containing 44 patients (36 males, 8 females) and 30 healthy controls (23 males and 7 females), are included in the present study (Figure 1). They underwent magnetic resonance imaging scans in a 7 Tesla/68 cm MR scanner (Siemens Medical Solutions, Erlangen, Germany). A 32-channel receive coil (NOVA Medical Inc., MA) with a single channel volume transmit coil was used. 3D T1-weighted MR images were acquired using MP2RAGE (TE/TR = 1.87/5500 ms, TI1/TI2 = 750/2350 ms, a1/a2 = 4°/5°, slice thickness = 1 mm, FOV = 240 × 256 × 160 mm3, matrix size = 240 × 256 × 160, bandwidth = 240 Hz/Px)) 5.We used voxel-based morphometry (VBM) to show clusters that are statistically significant either at whole-brain or at small volume scale. CAT12 (Computational Anatomy toolbox) implemented based on SPM12 (Statistical Parametric Mapping) was employed for segmentation and statistical analysis. 2-sample t-test model was used with nuisance covariates age, gender, and total intracranial volume (TIV). Family-Wise Error (FWE) correction were performed. ROI (region of interest) analysis 4 was also done for regional GM volume difference. The average GM concentration in voxels was calculated within regional mask created by xjview9.7 7 and WFU PickAtlas 8 toolboxes and compared between two groups using one-way ANOVA. P-value under 0.05 is regarded as significant.
Results
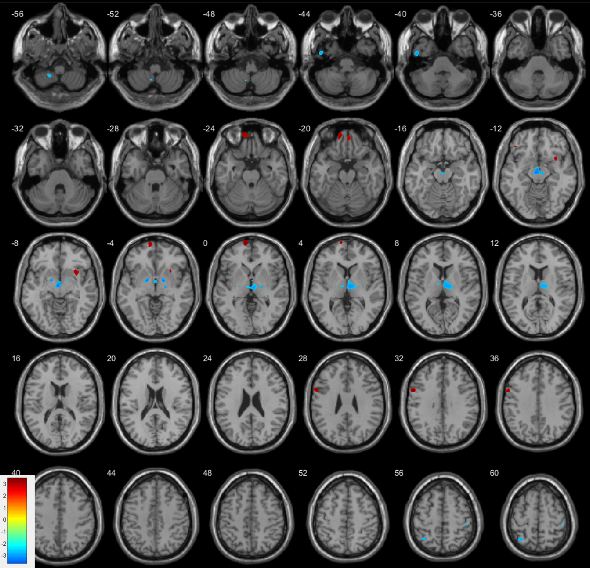
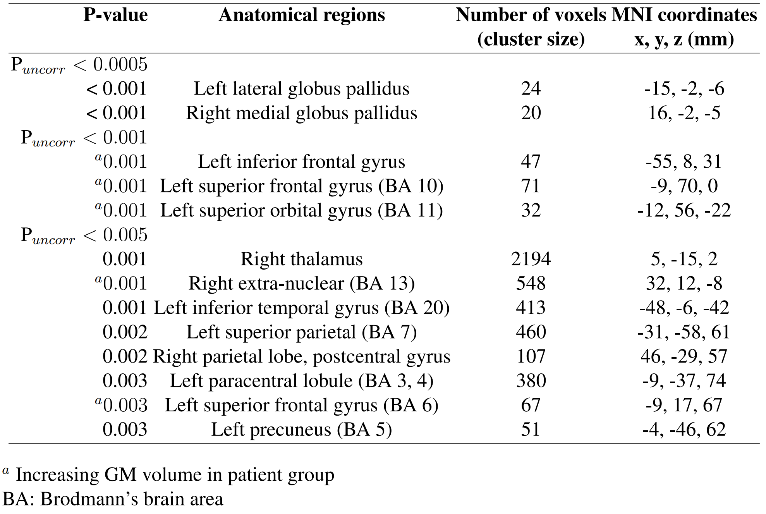
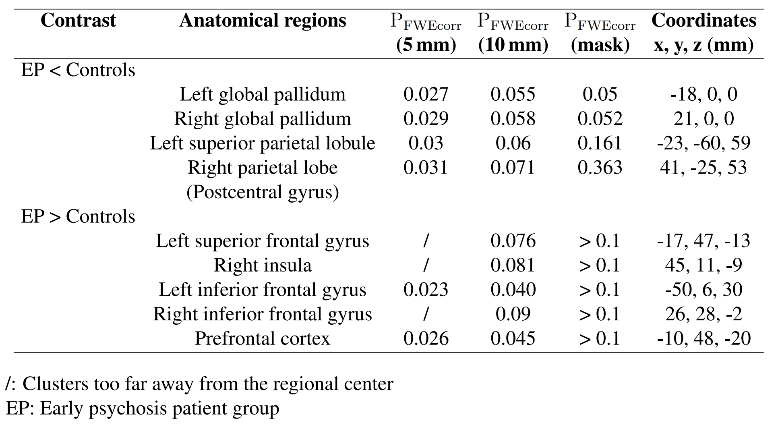
There is no significant difference in TIV between patients and controls. In voxel-by-voxel comparison on whole-brain scale, no significant differences were identified after the FWE correction. A 2-sample t-test map by VBM analysis is presented in Figure 2. Figure 3 lists the clusters with P < 0.005 (uncorrected). GM volume decreases in patient group in the clusters at left lateral globus pallidus, right medial globus pallidus, right thalamus, left inferior temporal gyrus, left superior parietal, left paracentral lobule, left precuneus, right parietal lobe (postcentral gyrus). GM volume increases are revealed at left frontal gyrus. Clusters with GM volume loss are mainly in subcortical region (global pallidus and thalamus), parietal lobe and temporal gyrus.Small volume correction (SVC) 9 was applied on cluster level for global pallidum, left superior parietal lobe, right postcentral gyrus, right insula, frontal gyrus and prefrontal cortex 10-12. Clusters were regarded as significant when an FWE-corrected cluster threshold of 0.05 adjusted for the small volume (Figure 4).
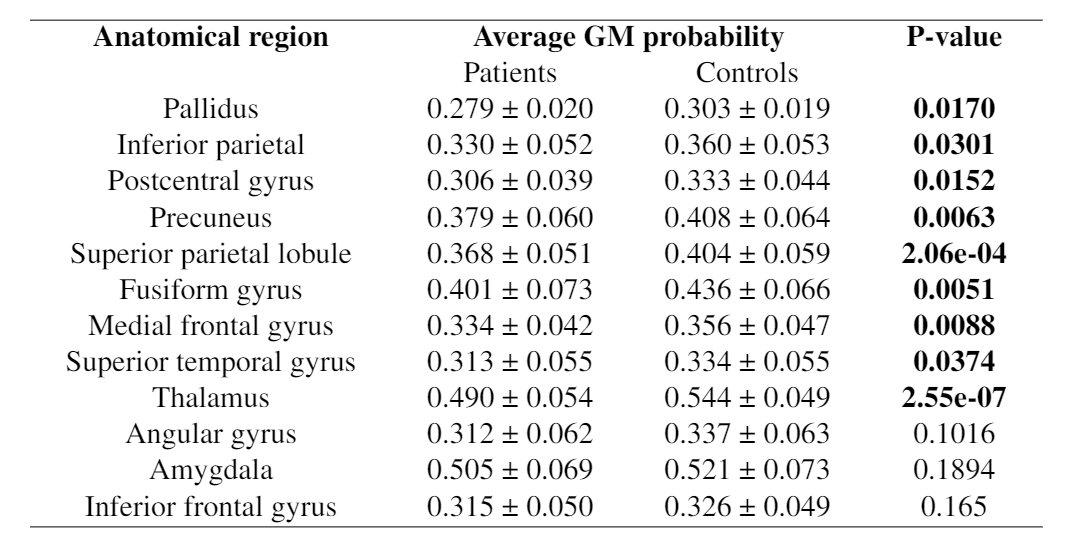
Results of the ROI analysis are in Figure 5. Significant changes appear in global pallidus, inferior parietal, postcentral gyrus, precuneus, superior parietal lobule, fusiform gyrus, medial frontal gyrus, superior temporal gyrus and thalamus.
Discussion and conclusion
The observed regions with GM reductions in patients are consistent with most of the morphometric studies 13,14. A meta-analysis study 15 concluded that the GM volume level at the thalamus region is reduced in both first-episode and chronic schizophrenia subjects. Another subcortical abnormality is located in globus pallidus which is a little-studied structure in schizophrenia research but plays an important role in striatal, thalamic and dopaminergic regulation 16. Reductions in pallidus are also reported in most studies with schizophrenia patients, but not in early psychosis 17. Some typical antipsychotics are associated with the enlargement of the basal ganglia (i.e. globus pallidus, caudate) structures 18,19. Since most studies were performed at a relatively lower magnetic field strength (1.5 or 3T). Higher sensitivity of 7T and MP2RAGE images may facilitate the current observation. Increasing GM volumes in the frontal lobe may be due to the variation of tissue volume with different psychosis stages.The results of the ROI-based analysis agree with those of VBM, showing decreased GM volumes in the globus pallidus and right thalamus of EP patients compared to controls. Additional abnormal regions are found at the fusiform gyrus, medial frontal gyrus and superior temporal gyrus. Interestingly, the frontal region presents a reduction trend in ROI analysis while increasing in some small clusters by VBM. This inconsistency suggests the regional heterogeneity and may be resulted from the less sensitivity to partial changes using the ROI analysis than VBM 20,21. No significant change was shown in the amygdala, although its volume reduction was found in many schizophrenia studies 15,22.
We conclude results of VBM analysis using MP2RAGE images at 7T are largely consistent with previous neuroimaging studies and allow to find other GM alterations between EP patients and controls. This study provides a reference for future morphological studies in early psychosis with MP2RAGE images at a higher field.
Acknowledgements
No acknowledgement found.References
1. Shah, C., Zhang, W., Xiao, Y., Yao, L., Zhao, Y., Gao, X., Liu, L., Liu, J., Li, S., & Tao, B. (2016). Common pattern of gray-matter abnormalities in drug-naive and medicated first-episode schizophrenia: a multimodal meta-analysis. Psychological Medicine, 47, 401–413.
2. Lui, S., Deng, W., Huang, X., Jiang, L., Ma, X., Chen, H., Zhang, T., Li, X., Li, D., & Zou, L. (2009). Association of cerebral deficits with clinical symptoms in antipsychotic-naive first-episode schizophrenia: an optimized voxel-based morphometry and resting state functional connectivity study. The American Journal of Psychiatry, 166, 196–205.
3. A. Droby et al., "Whole brain and deep gray matter structure segmentation: Quantitative comparison between MPRAGE and MP2RAGE sequences", PLOS ONE, vol. 16, no. 8, p. e0254597, 2021. Available: 10.1371/journal.pone.0254597.
4. G. Okubo et al., "MP2RAGE for deep gray matter measurement of the brain: A comparative study with MPRAGE", Journal of Magnetic Resonance Imaging, vol. 43, no. 1, pp. 55-62, 2015. Available: 10.1002/jmri.24960.
5. Marques, J.P., Kober, T., Krueger, G., van der Zwaag, W., Van de Moortele, P.F., and Gruetter, R. (2010). MP2RAGE, a self bias-field corrected sequence for improved segmentation and T1-mapping at high field. Neuroimage 49, 1271-1281.
6. Z. Lao, D. Shen, Z. Xue, B. Karacali, S. Resnick and C. Davatzikos, "Morphological classification of brains via high-dimensional shape transformations and machine learning methods", NeuroImage, vol. 21, no. 1, pp. 46-57, 2004. Available: 10.1016/j.neuroimage.2003.09.027.
7. "xjView | A viewing program for SPM", Alivelearn.net. [Online]. Available: https://www.alivelearn.net/xjview/.
8. "NITRC: WFU_PickAtlas: Tool/Resource Info", Nitrc.org. [Online]. Available: https://www.nitrc.org/projects/wfu_pickatlas/.
9. M. Kubicki, "Voxel-Based Morphometric Analysis of Gray Matter in First Episode Schizophrenia", NeuroImage, vol. 17, no. 4, pp. 1711-1719, 2002. Available: 10.1006/nimg.2002.1296.
10. R. Chan, X. Di, G. McAlonan and Q. Gong, "Brain Anatomical Abnormalities in High-Risk Individuals, First-Episode, and Chronic Schizophrenia: An Activation Likelihood Estimation Meta-analysis of Illness Progression", Schizophrenia Bulletin, vol. 37, no. 1, pp. 177-188, 2009. Available: 10.1093/schbul/sbp073.
11. E. Bora et al., "Neuroanatomical abnormalities in schizophrenia: A multimodal voxelwise meta-analysis and meta-regression analysis", Schizophrenia Research, vol. 127, no. 1-3, pp. 46-57, 2011. Available: 10.1016/j.schres.2010.12.020.
12. S. Kuhn and J. Gallinat, "Resting-State Brain Activity in Schizophrenia and Major Depression: A Quantitative Meta-Analysis", Schizophrenia Bulletin, vol. 39, no. 2, pp. 358-365, 2011. Available: 10.1093/schbul/sbr151.
13. U. Torres et al., "Patterns of regional gray matter loss at different stages of schizophrenia: A multisite, cross-sectional VBM study in first-episode and chronic illness", NeuroImage: Clinical, vol. 12, pp. 1-15, 2016. Available: 10.1016/j.nicl.2016.06.002.
14. M. Leung et al., "Gray Matter in First-Episode Schizophrenia Before and After Antipsychotic Drug Treatment. Anatomical Likelihood Estimation Meta-analyses With Sample Size Weighting", Schizophrenia Bulletin, vol. 37, no. 1, pp. 199-211, 2009. Available: 10.1093/schbul/sbp099.
15. I. Ellison-Wright, D. Glahn, A. Laird, S. Thelen and E. Bullmore, "The Anatomy of First-Episode and Chronic Schizophrenia: An Anatomical Likelihood Estimation Meta-Analysis", American Journal of Psychiatry, vol. 165, no. 8, pp. 1015-1023, 2008. Available: 10.1176/appi.ajp.2008.07101562.
16. M. Williams, "An introduction to the Globus Pallidus in schizophrenia", Oruen, 2017. [Online]. Available: https://www.oruen.com/uncategorized/an-introduction-to-the-globus-pallidus-in-schizophrenia.
17. V. Oertel-Knöchel et al., "Cortical–basal ganglia imbalance in schizophrenia patients and unaffected first-degree relatives", Schizophrenia Research, vol. 138, no. 2-3, pp. 120-127, 2012. Available: 10.1016/j.schres.2012.02.029.
18. F. Womer et al., "Basal ganglia and thalamic morphology in schizophrenia and bipolar disorder", Psychiatry Research: Neuroimaging, vol. 223, no. 2, pp. 75-83, 2014. Available: 10.1016/j.pscychresns.2014.05.017.
19. G. Boonstra et al., "Brain Volume Changes After Withdrawal of Atypical Antipsychotics in Patients With First-Episode Schizophrenia", Journal of Clinical Psychopharmacology, vol. 31, no. 2, pp. 146-153, 2011. Available: 10.1097/jcp.0b013e31820e3f58.
20. N. Giuliani, V. Calhoun, G. Pearlson, A. Francis and R. Buchanan, "Voxel-based morphometry versus region of interest: a comparison of two methods for analyzing gray matter differences in schizophrenia", Schizophrenia Research, vol. 74, no. 2-3, pp. 135-147, 2005. Available: 10.1016/j.schres.2004.08.019.
21. S. Seyedi et al., "Comparing VBM and ROI analyses for detection of gray matter abnormalities in patients with bipolar disorder using MRI", Middle East Current Psychiatry, vol. 27, no. 1, 2020. Available: 10.1186/s43045-020-00076-3.
22. N. Okada et al., "Abnormal asymmetries in subcortical brain volume in schizophrenia", Molecular Psychiatry, vol. 21, no. 10, pp. 1460-1466, 2016. Available: 10.1038/mp.2015.209.
Figures