2023
Phenotyping a Mouse Model of TRAPPC9 Associated Intellectual Disability with High Resolution MRI and Diffusion Tensor Imaging1Centre for Preclinical Imaging, University of Liverpool, Liverpool, United Kingdom, 2Cellular and Molecular Physiology, University of Liverpool, Liverpool, United Kingdom
Synopsis
Microcephaly and intellectual disability is associated with mutation of the TRAPPC9 gene. A knockout mouse model of TRAPPC9-associated intellectual disability and microcephaly was characterised using high resolution T1 and T2 weighted Magnetic Resonance Imaging (MRI) and Diffusion Tensor Imaging (DTI) alongside behavioural assays. Behavioural differences suggested learning impairment in the model, MRI elucidated the developmental timeline of the disorder and highlighted several brain regions with reduced volume. DTI revealed reduced structural integrity in the corpus callosum.
Introduction
An Autosomal Recessive form of Intellectual Disability (AR-ID) is associated with mutation of the gene encoding Trafficking Protein Particle Complex subunit 9 (TRAPPC9)1-3. TRAPPC9 Associated AR-ID imaging in humans typically shows microcephaly and a thin corpus callosum and cerebellar hypoplasia1-3. To characterise and evaluate the time of onset of these phenotypes in a TRAPPC9 knockout (KO) model, we performed high resolution T1 and T2 weighted MRI along with diffusion tensor imaging (DTI) and behavioural assays.Methods
A Trappc9 KO mouse model was used and wild-type (WT) littermates used as controls.Ex Vivo MRI
Heads from 17 Neonatal (P0-P1) and 16 Weanling (P21-P27) mice were perfusion fixed and soaked in a 10mM solution of Multihance for 20 hours (neonates) or 72 hours (weanlings). Imaging was performed using a 27mm loop gap resonator coil in a 9.4 Tesla horizontal bore magnet. T1-weighted images were acquired using a 3D Fast Low Angle Shot (FLASH) sequence using TE: 8ms, TR: 70.8ms, Averages: 2, Flip Angle: 60°, Field of View: 12mm3, isotropic resolution: 0.05mm3
In Vivo MRI
41 mice (12-16 weeks old) were anaesthetised using 1.5-2% isoflurane. A 4-channel phased array receiver coil was used for signal reception, while an 86 mm birdcage coil was used for transmission. A T2 weighted RARE sequence was used with: TE: 33ms, TR: 3200ms, Averages: 8, Echo Spacing: 11ms, Rare Factor: 8, Field of View: 18mm2, Slices: 30, Slice Thickness: 0.5mm Acquisition Matrix: 256mm2.
A DTI-EPI Sequence was also used on a subset of mice (11 WT, 11 KO) using: TE: 22ms, TR: 3000ms, Averages: 2, Segments: 6, Directions: 30, b: 1000s/mm2 Field of View; 18mm2, Slices: 30, Slice Thickness: 0.5mm, Acquisition Matrix: 96mm2.
Image Analysis
Ex vivo T1-weighted image were manually segmented using 3D slicer4. T2-weighted in vivo images were processed using the Atlas-based Image Data Analysis (AIDA) pipeline5 allowing automated segmentation of the brains into regions based on the Allen Reference Atlas6 (Figure 1). Regions of interest (ROI) were chosen based on the human AR-ID phenotype and previous findings in AR-ID models7,8.
Fractional anisotropy (FA) maps were generated in FSL9 and were registered together using FSL’s FLIRT and FNIRT tools before ROI analysis was carried out in ITK-SNAP10. The corpus callosum was segmented into medial and lateral sections at the genu, the isthmus and the splenium (Figure 2). The arbor vitae of the cerebellum, adjacent to the 4th ventricle was also segmented.
Behavioural Tests
The open field, rotarod and plug puzzle tests were performed as previously described11-13 in brightly lit conditions during the mouse’s active phase.
All statistical analysis was carried out in Graphpad Prism version 9.0.0. Correction for multiple comparisons was made using the two-stage step-up method14 with a Q of 1%. In these instances, q values are reported instead of p.
Results
An overview of the MRI findings is provided in Table 1.No difference in total brain volumes were noted between neonatal KO and WT mice. However, significantly smaller brain volumes were observed in the weanling KO versus WT. Similarly, adult KO brains were significantly smaller than WT.
AIDA revealed that KOs had smaller corpus callosum (q=0.0003), cerebellum (q=0.017), hippocampus (q=0.0001), dorsal striatum (q=0.0002), pons (q=0.0001) and medulla (q=0.006). No significant volume differences were seen in the hypothalamus (q=0.16), or ventral striatum (q=0.14) (Figure 3).
DTI revealed significant FA differences in the corpus callosum at the medial genu between KOs and WTs. KOs also had reduced FA at the medial splenium of the corpus callosum. Though slightly lower in KOs, the differences in cerebellar FA were not statistically significant.
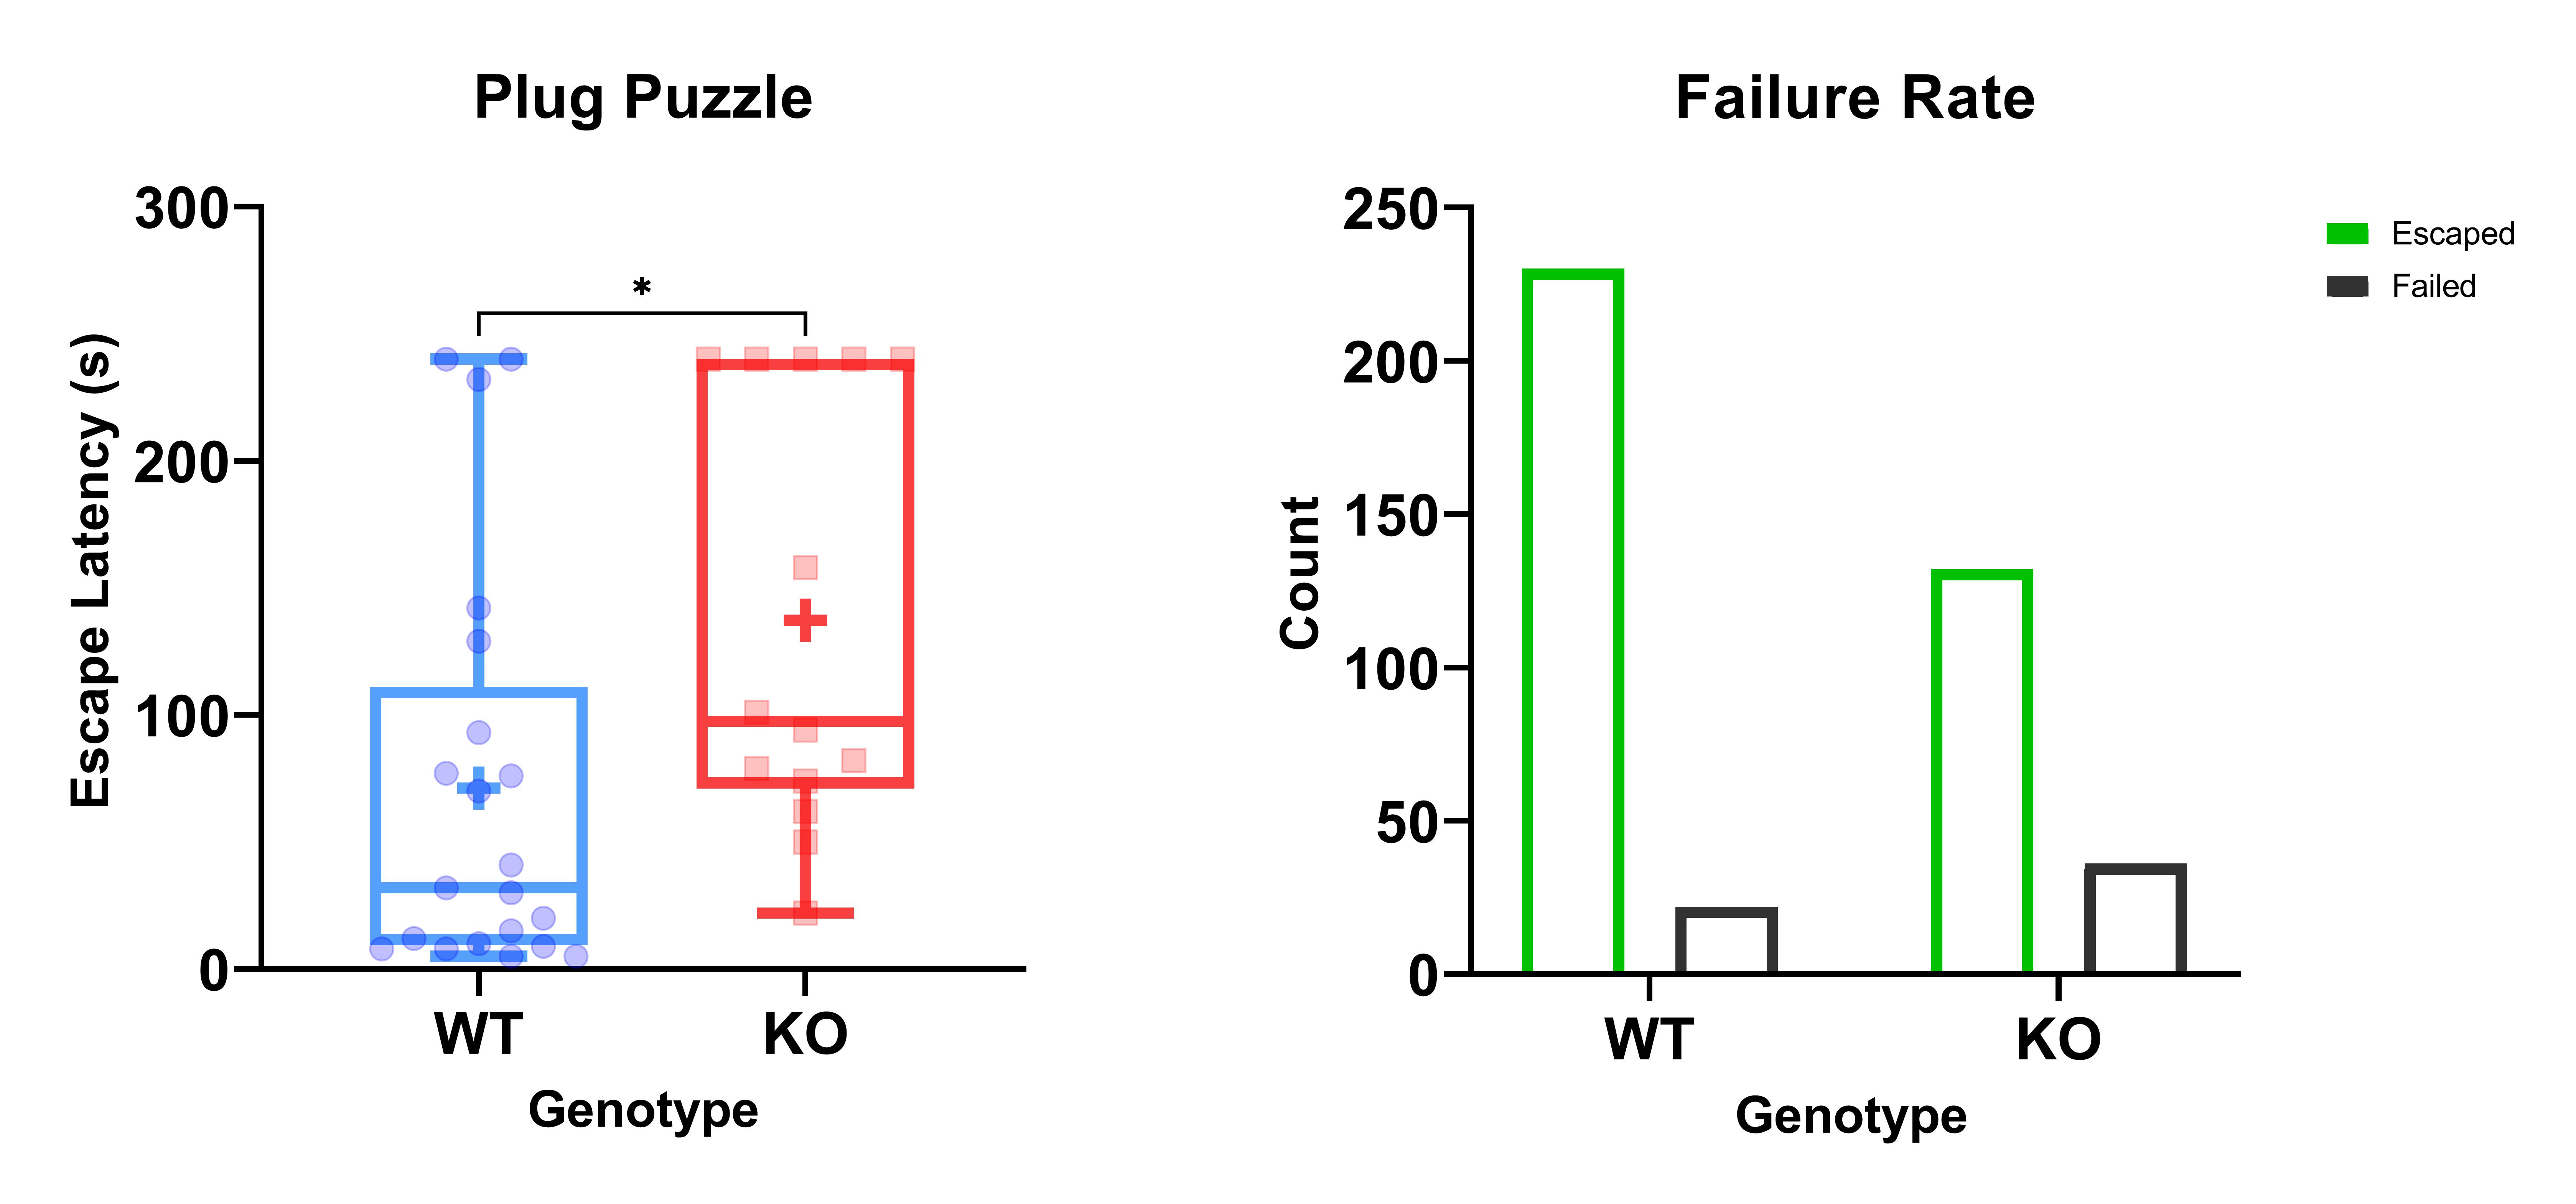
KOs spent less time in the centre than WTs in the open field. They also had a shorter fall latency on the rotarod, an increased escape latency and greater probability of failure in the plug puzzle (Figure 4).
Discussion
The results from the neonatal and weanling brain volumes elucidate the developmental timeline and imply that microcephaly develops postnatally. The hippocampus was significantly smaller in KOs and this has been linked to reduced memory and intelligence in humans and mice15. The volume reductions seen in the medulla and pons contradict previous histological findings7-8 and suggest MRI may be a more suitable tool for morphometry, providing quantitative volume estimates without histological tissue modification.Reduced white matter integrity in the corpus callosum was indicated by lower FA values, found in both the genu and the splenium. This, alongside the morphometry findings, suggests not only macrostructural volume differences, but differences on a microstructural level. The imaging findings were corroborated by behaviour assays as learning impairments were observed in KO animals.
Conclusion
TRAPPC9 KO mice recapitulate human AR-ID and multi-parametric imaging aids in the assessment of neurological abnormalities.Acknowledgements
This project has received funding from the MRC-DiMeN Doctoral Training Program. The studies were performed in the Centre for Preclinical Imaging, which is funded by the grants from the MRC as well as the Wellcome Trust.
References
1 Mochida, G.H. et al. (2009) A Truncating Mutation of TRAPPC9 Is Associated with Autosomal-Recessive Intellectual Disability and Postnatal Microcephaly. Am. J. Hum. Genet. 85, 897–902
2 Abou Jamra, R. et al. (2011) Homozygosity mapping in 64 Syrian consanguineous families with non-specific intellectual disability reveals 11 novel loci and high heterogeneity. Eur. J. Hum. Genet. 19, 1161–1166
3 Ashaat, E.A. et al. (2020) A novel homozygous variant in the TRAPPC9 gene causing intellectual disability and autism Spectrum disorder. Meta Gene 26, 100783
4 Kikinis, R. et al. (2014) 3D Slicer: A Platform for Subject-Specific Image Analysis, Visualization, and Clinical Support. In Intraoperative Imaging and Image-Guided Therapy (Jolesz, F. A., ed), pp. 277–289, Springer New York
5 Pallast, N. et al. (2019) Processing pipeline for atlas-based imaging data analysis of structural and functional mouse brain MRI (AIDAmri). Front. Neuroinform. 13, 1–14
6 Sunkin, S.M. et al. (2013) Allen Brain Atlas: An integrated spatio-temporal portal for exploring the central nervous system. Nucleic Acids Res. 41,
7 Liang, Z.S. et al. (2020) Trappc9 deficiency causes parent-of-origin dependent microcephaly and obesity. PLoS Genet. 16,
8 Ke, Y. et al. (2020) Trappc9 deficiency in mice impairs learning and memory by causing imbalance of dopamine d1 and d2 neurons. Sci. Adv. 6,
9 Smith, S.M. et al. (2004) Advances in functional and structural MR image analysis and implementation as FSL. Neuroimage 23, 208–219
10 Yushkevich, P.A. et al. (2006) User-guided 3D active contour segmentation of anatomical structures: Significantly improved efficiency and reliability. Neuroimage 31, 1116–1128
11 Shaw, R.C. and Schmelz, M. (2017) Cognitive test batteries in animal cognition research : evaluating the past , present and future of comparative psychometrics. Anim. Cogn. 20, 1003–1018
12 Deacon, R.M.J. (2013) Measuring Motor Coordination in Mice. J. Vis. Exp. DOI: 10.3791/2609
13 O’Connor, A.M. et al. (2014) The use of the puzzle box as a means of assessing the efficacy of environmental enrichment. J. Vis. Exp. DOI: 10.3791/52225
14 Benjamini, Y. et al. (2006) Adaptive linear step-up procedures that control the false discovery rate. Biometrika 93, 491–507
15 Bagdatlioglu, E. et al. (2020) Cognitive impairment appears progressive in the mdx mouse. Neuromuscul. Disord. 30, 368–388
Figures
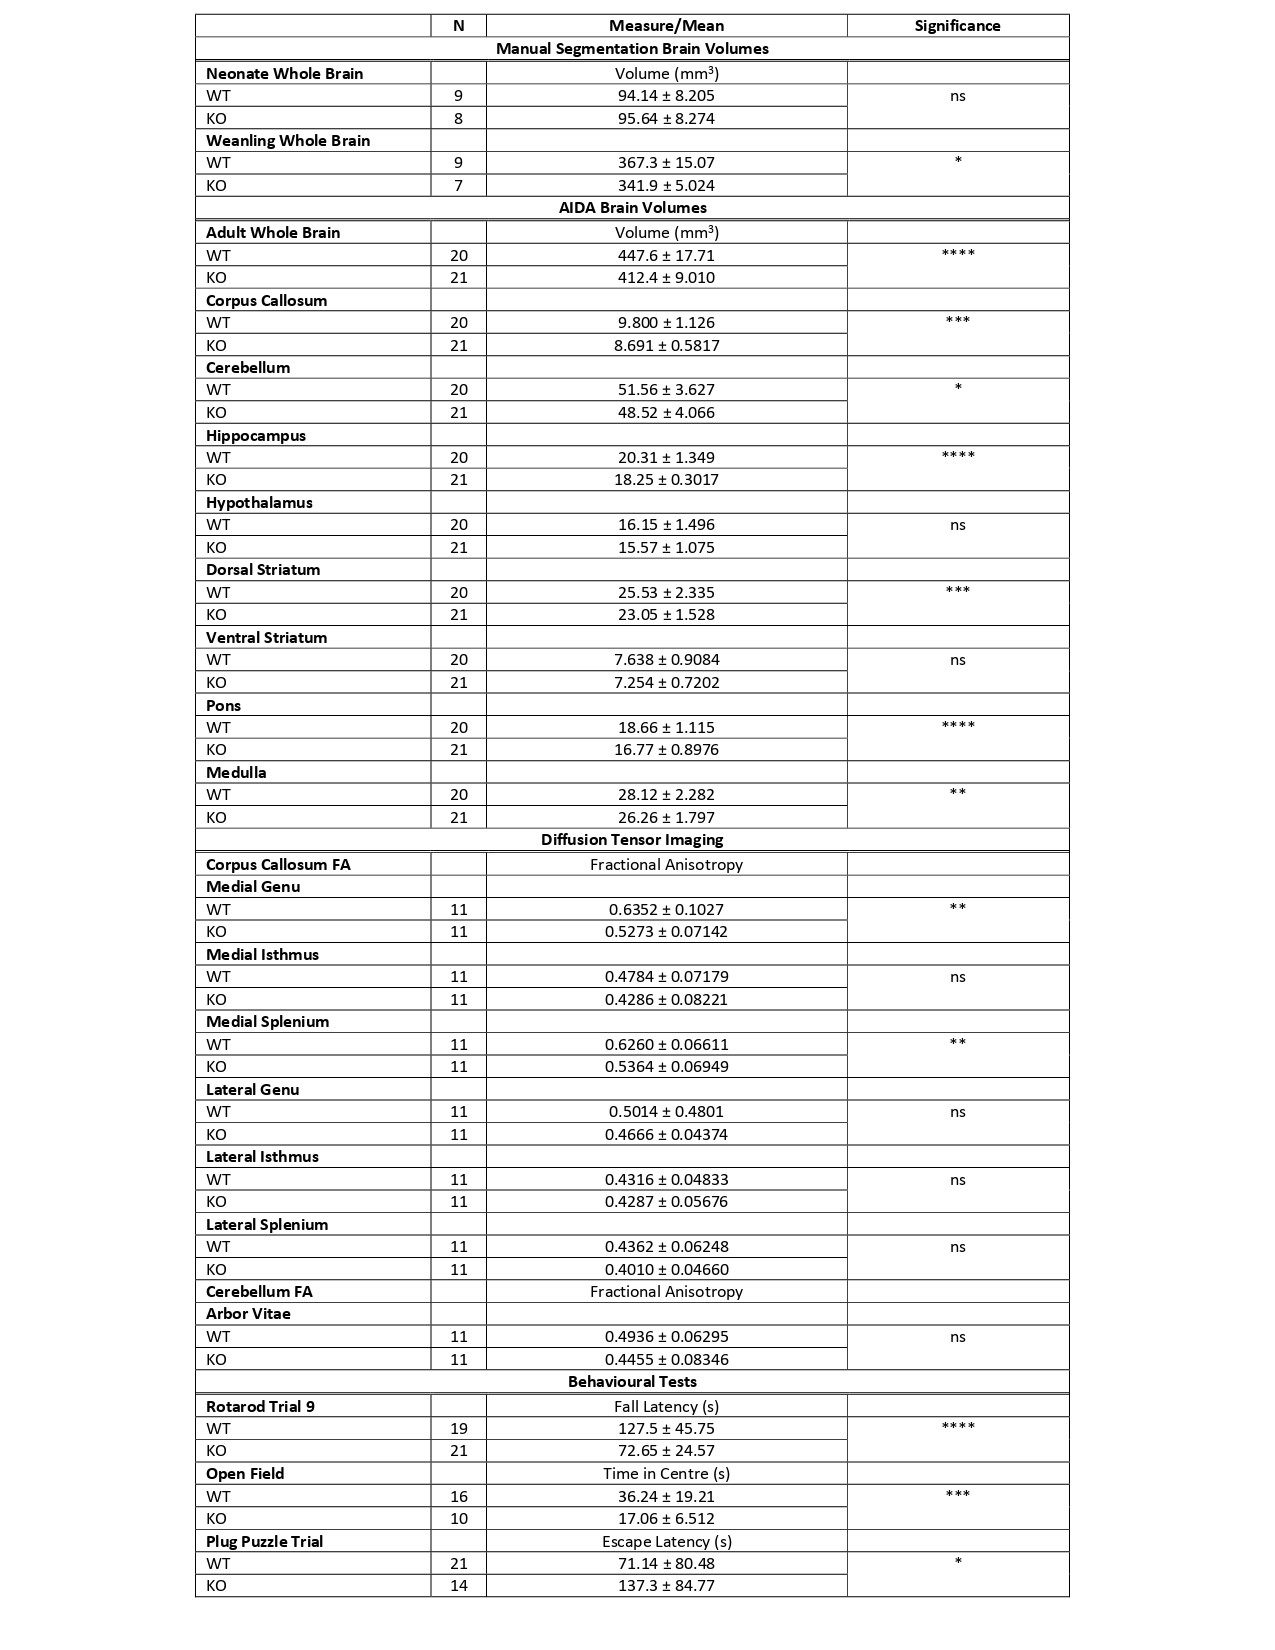
Table 1. An overview of results. Significance levels are denoted with ns: no significance, *: 0.01-0.05, **: 0.001 – 0.01, ***: 0.0001 – 0.001 , ****: p< 0.0001

Figure 1. A coronal slice of a T2-Weighted Image of a mouse brain after processing with Atlas Based Image Analysis pipeline shown without (left) and with (right) the Allen Reference Atlas overlaid.

Figure 2. A coronal slice of fractional anisotropy map of a mouse brain. Shown with the region of interest mask of the medial (red) and lateral (yellow) portions of the splenium of the corpus callosum.
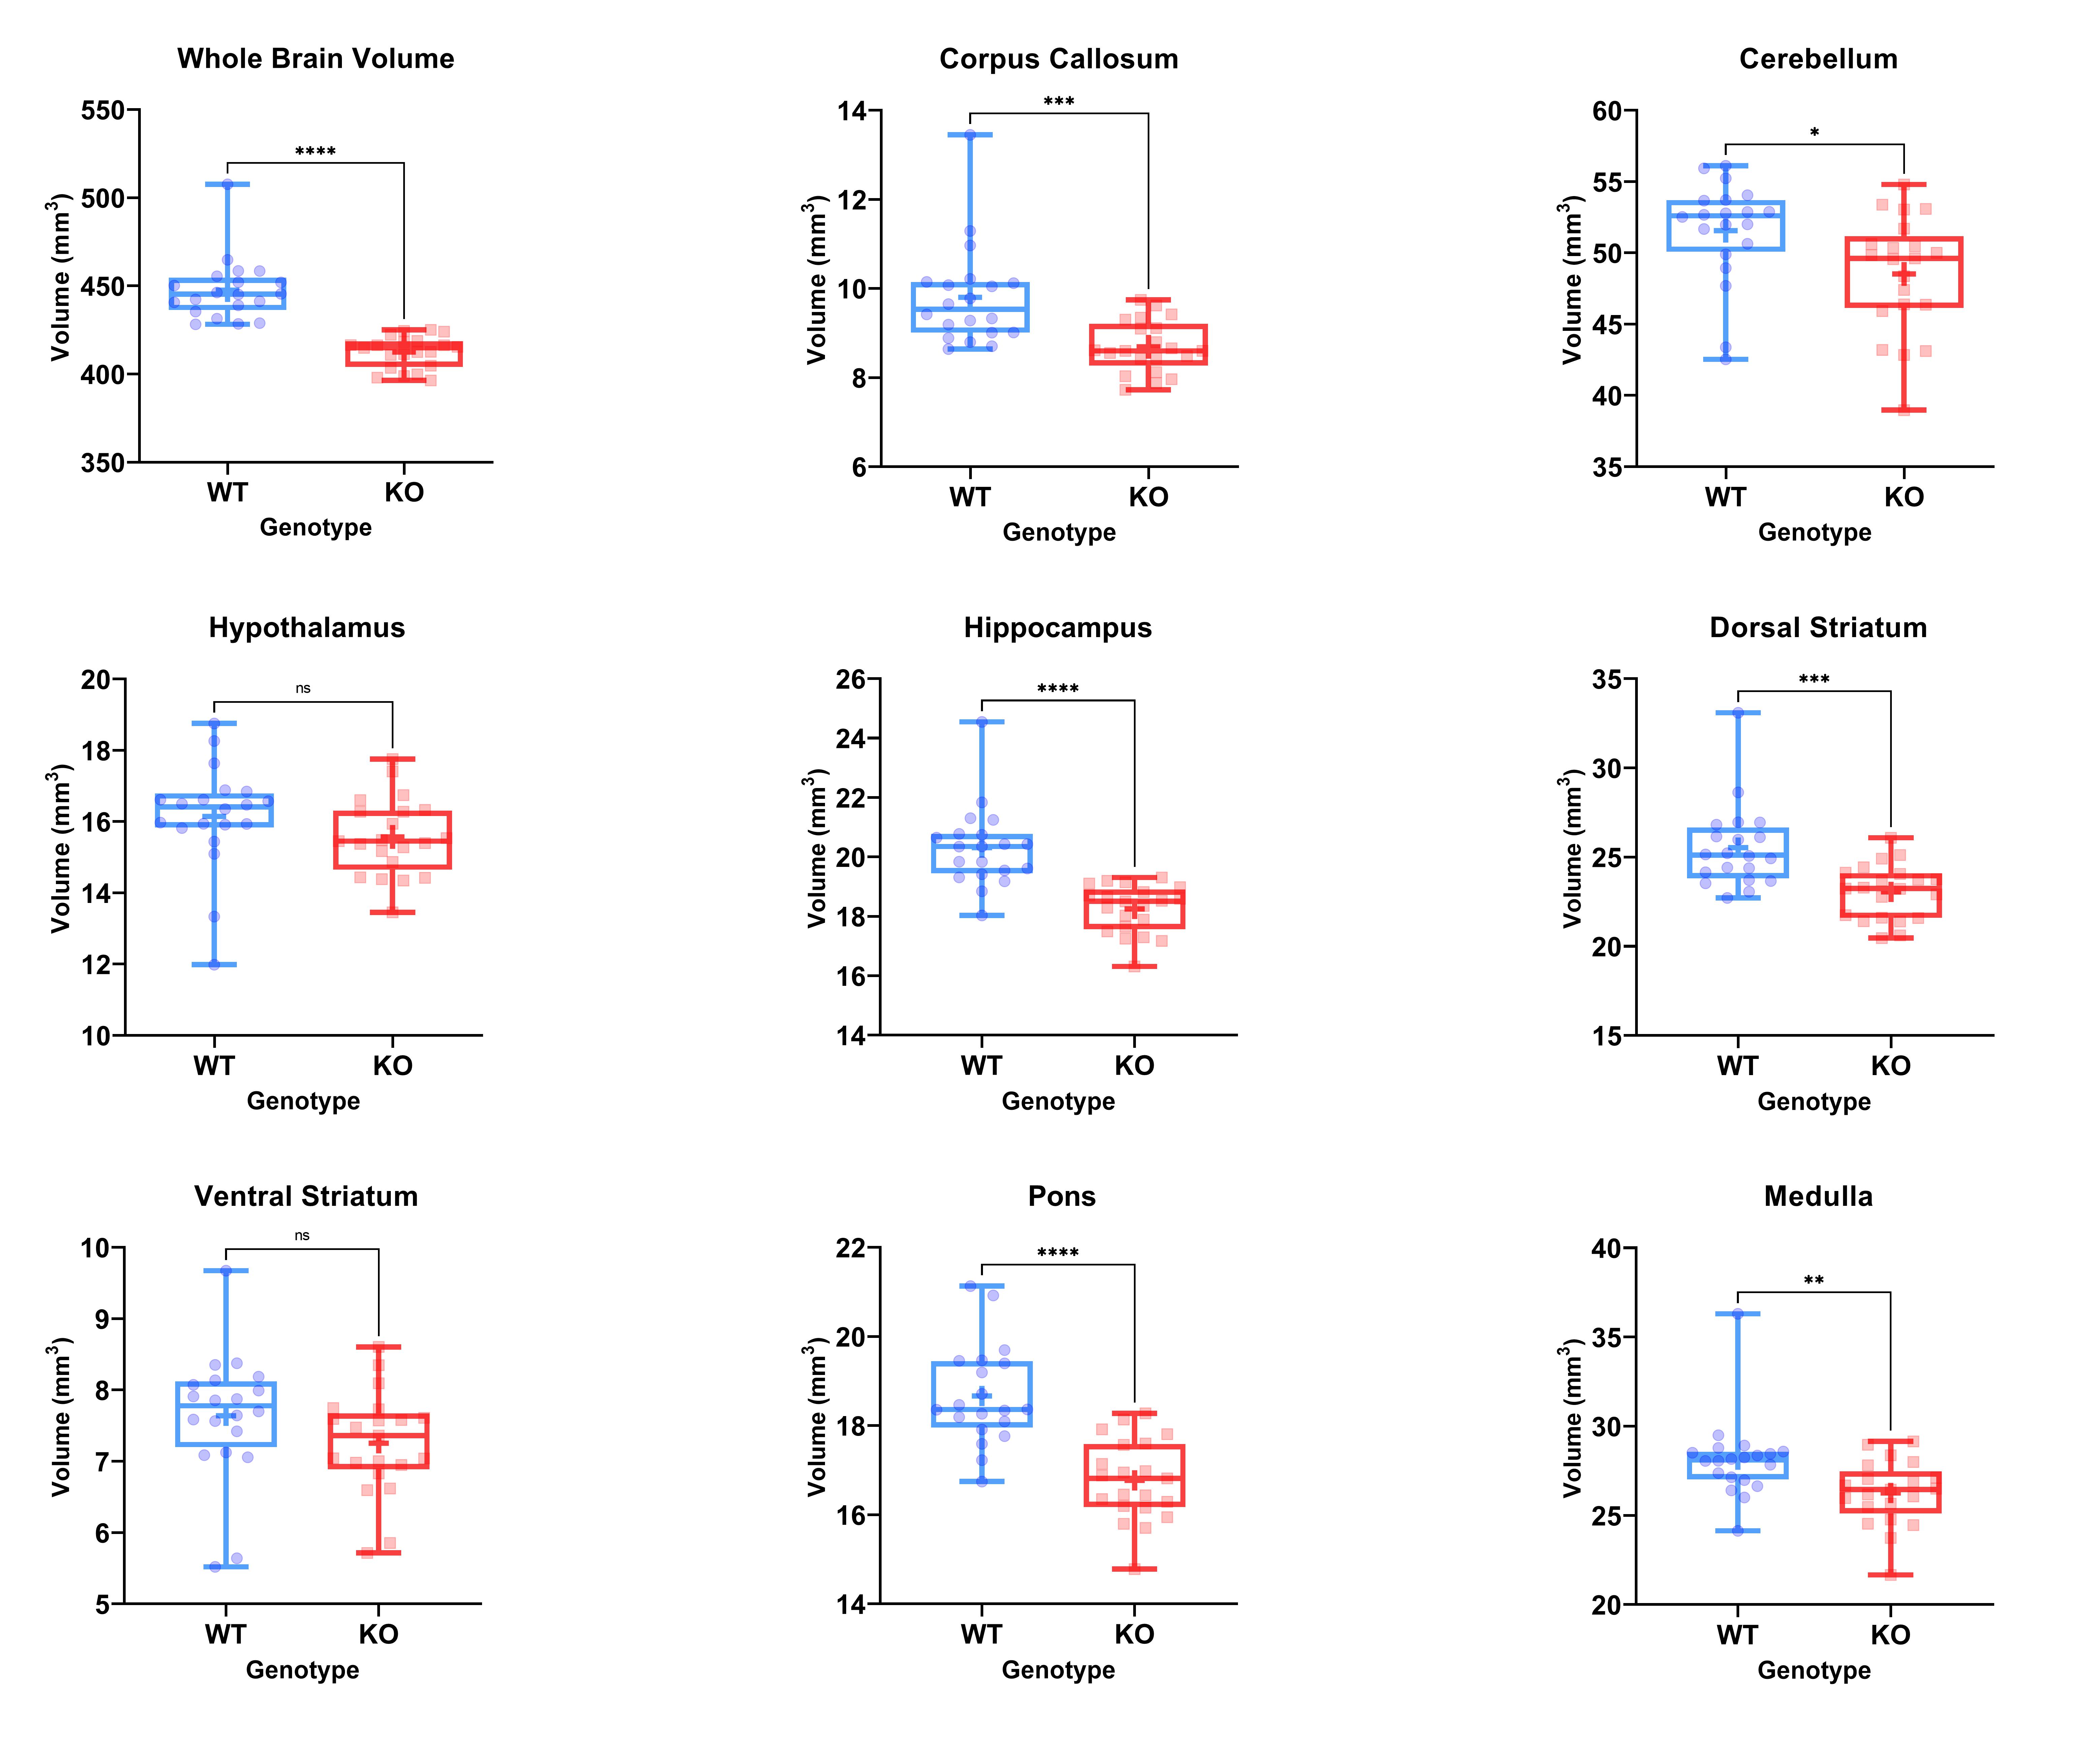
Figure 3. Boxplots showing median and interquartile ranges of regional brain volumes for wildtype and knockout mice. Averages are denoted with +. Significance levels are denoted with ns: no significance, *: 0.01-0.05, **: 0.001 – 0.01, ***: 0.0001 – 0.001 , ****: p< 0.0001