2019
Conduction velocity mapping a transcallosal pathway through a correlative multimodal structure-function relationship1Danish Research Centre for Magnetic Resonance (DRCMR), Copenhagen Universital Hospital Amager and Hvidovre, Copenhagen, Hvidovre, Denmark, 2Signal Processing Lab (LTS5), École Polytechnique Fédérale de Lausanne, Lausanne, Switzerland, 3Department of Applied Mathematics and Computer Science, Technical University of Denmark (DTU), Kgs. Lyngby, Denmark, 4Research Laboratory for Stereology and Neuroscience, Copenhagen University Hospital Bispebjerg, Copenhagen, Denmark, 5Department of Clinical Medicine, Faculty of Medical and Health Sciences, University of Copenhagen, Copenhagen, Denmark, 6Department of Neurology, Copenhagen University Hospital Bispebjerg, Copenhagen, Denmark
Synopsis
The structure-function relationship of axons within the intact brain proves challenging to delineate. We recorded transcallosal conduction time in the rat brain with optogenetics and electrophysiology, estimated pathway length with tractography, - and axon diameters (AD) with dw-MRI and transmission electron microscopy. The modalities exhibit different sensitivity profiles. Recorded latencies correspond only to smaller axons below the mode of the distribution of ADs from histology. dw-MRI is only sensitive to larger axons, not accounted for by electrophysiology and only sparsely with histology. Future correlative studies should choose modalities with a sufficient sensitivity profile for the structural or functional metric of interest.
Introduction
The structure-function relationship in peripheral nerves has been delineated1, but proves more challenging for axons of the intact central nervous system. The axon diameter (AD) is one variable that affects the conduction velocity (CV), and is therefore interesting to capture non-invasively with MRI. However, MRI is not sensitive to the smallest diameters2,3, but limited to representing only the larger ones, and does therefore not show the whole picture.Here, we aim to investigate the structure-function relationship via AD estimation with diffusion-weighted MRI (dw-MRI) and transmission electron microscopy (TEM) and relating these metrics to latencies from optogenetically evoked local field potentials (LFP) of the transcallosal fibers between the primary motor cortices (M1) in rats.
Methods
SurgeryYoung male Sprague-Dawley rats were injected with a viral inoculum (AAV5::CaMKIIa−hChR2(H134R)−EYFP) and implanted with an optic fiber in Layer 2/3 of right M1. A stereotrode was implanted at the same depth of the contralateral M14.
Electrophysiological recordings
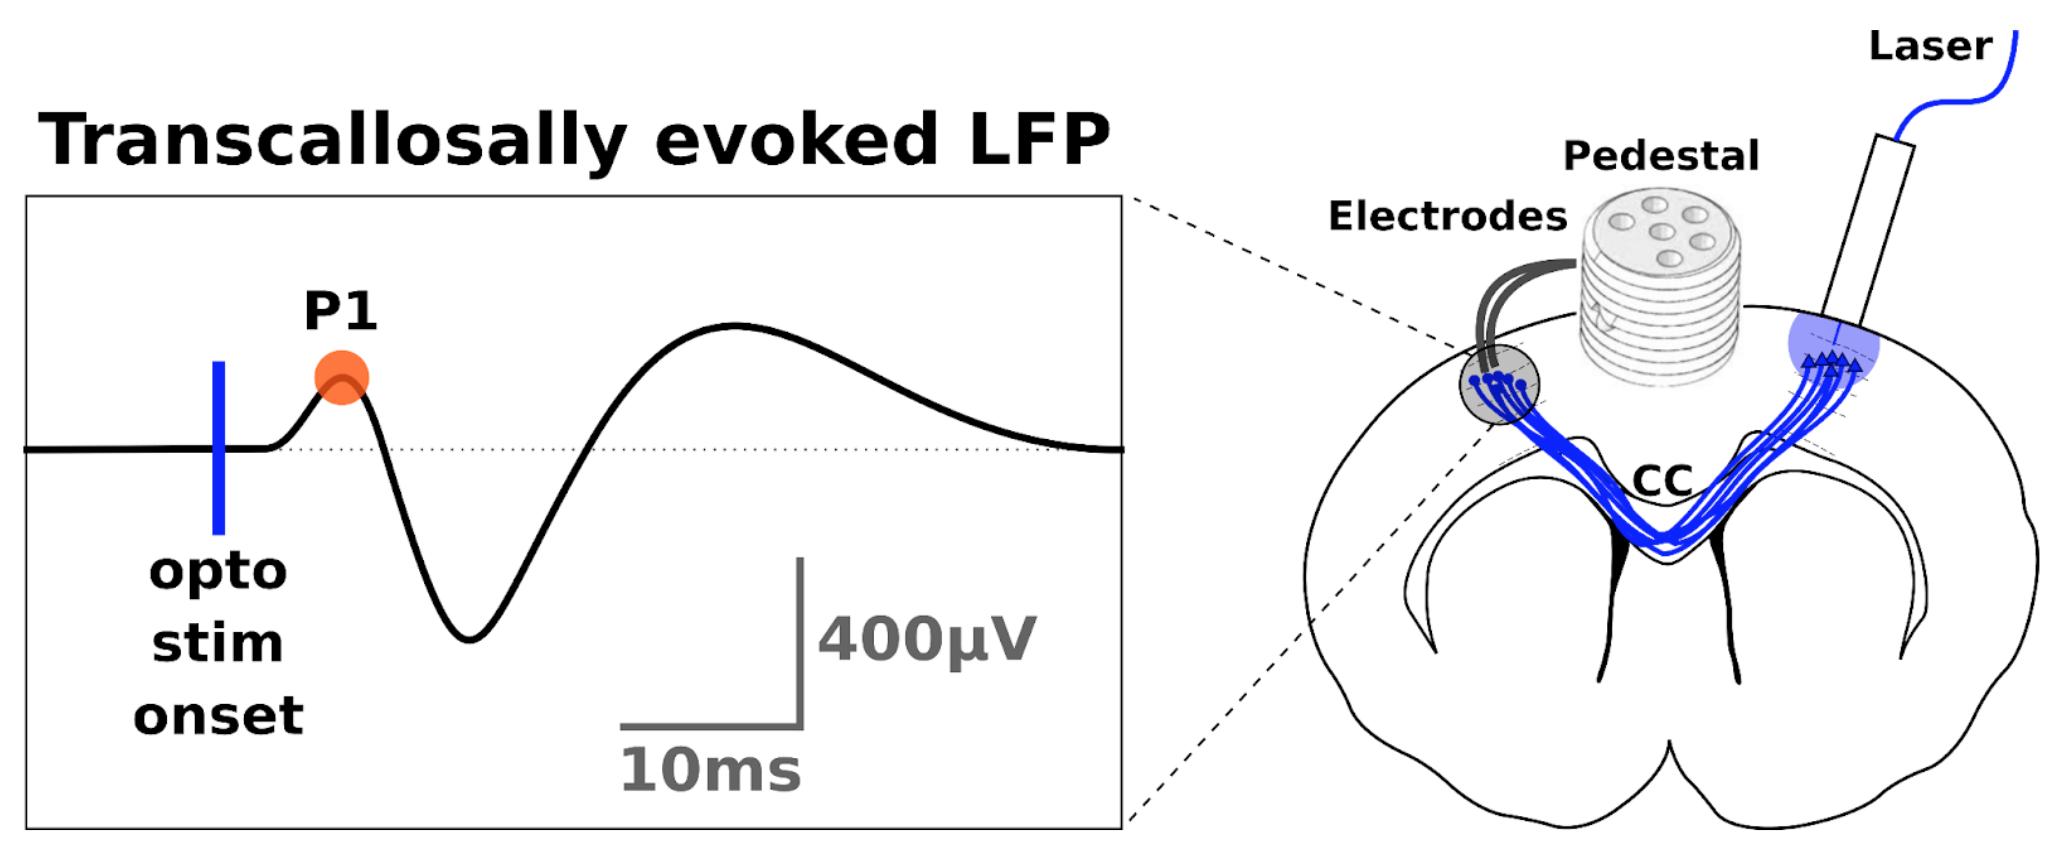
Transcallosal conduction time (TCT) was estimated from optogenetically evoked responses in M1 after optogenetic stimulation in the contralateral homotopic area4. We used the latency of the first positive peak (P1) from the LFP signal as indicative of TCT (fig.1).
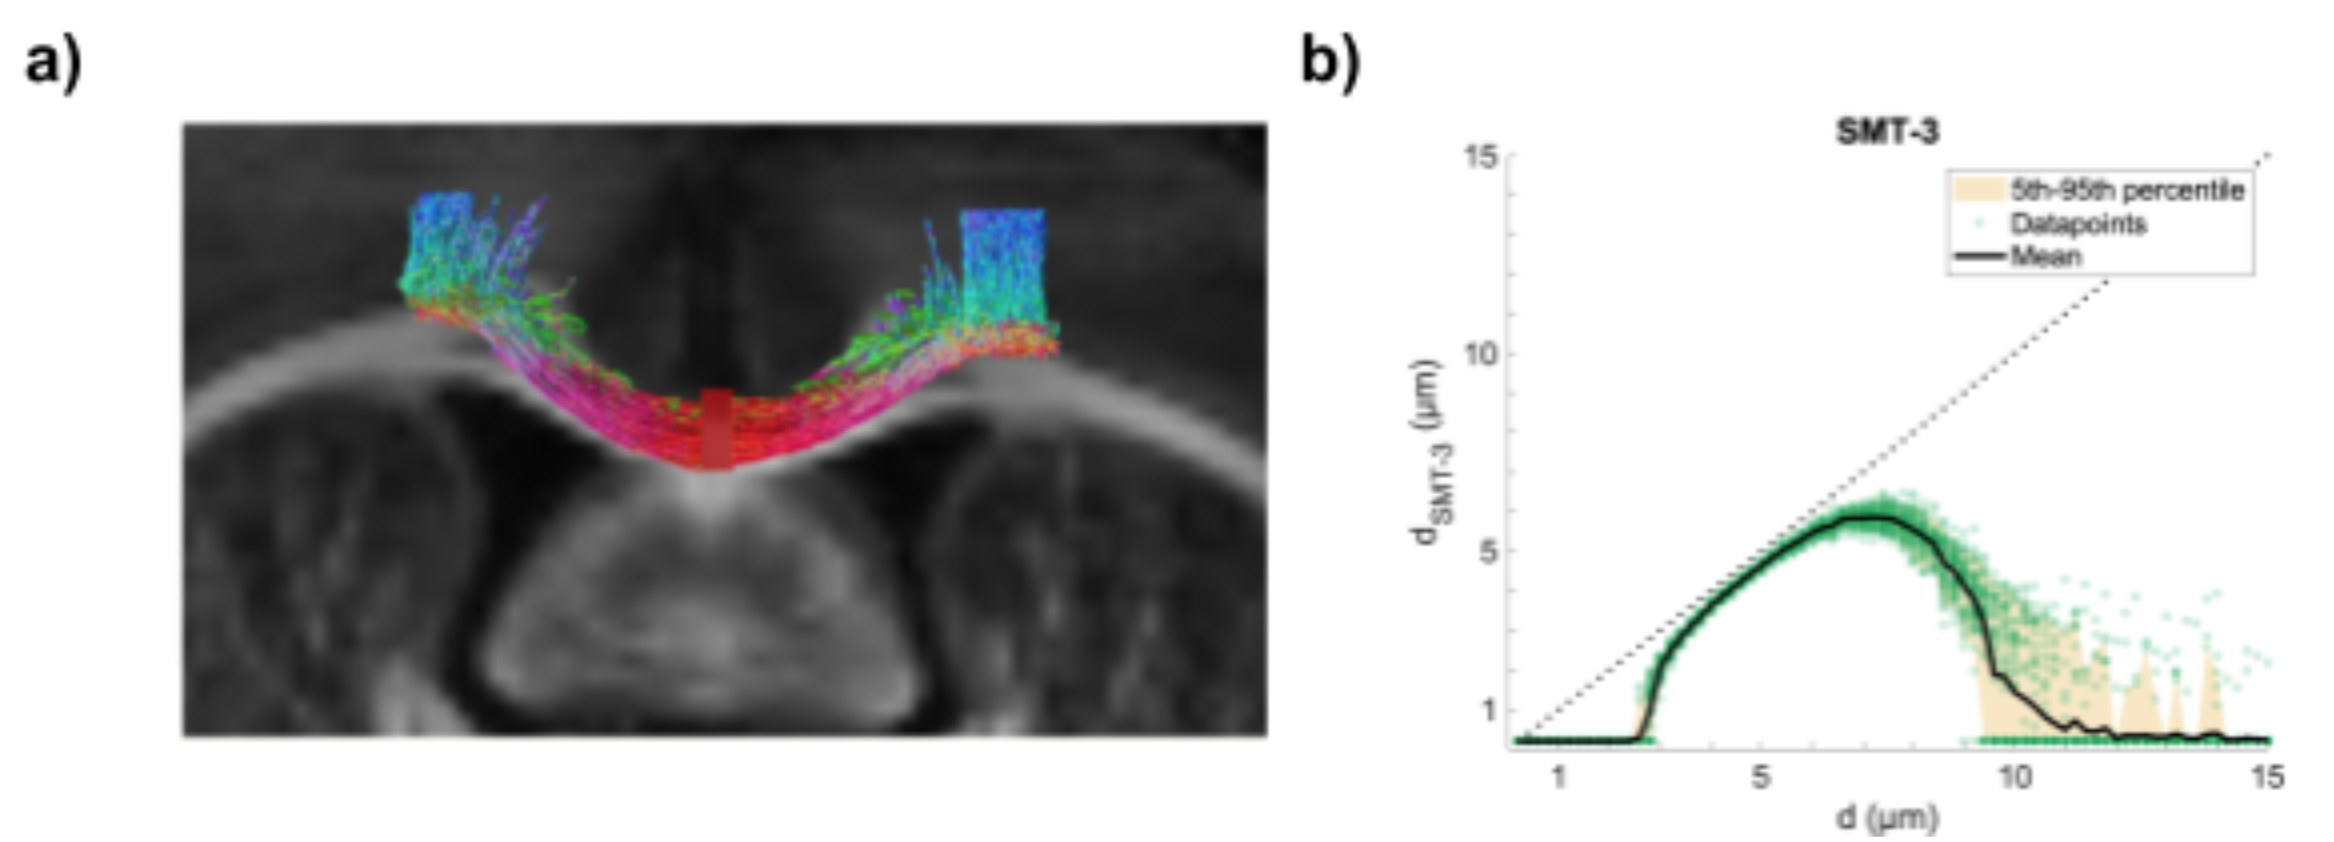
For verification, the stimulated transcallosal projection region was revealed with fluorescence light microscopy of a midsagittal section with histology. The pathway length between the bilateral M1s and through the projection region was measured using tractography (fig.2a). Whole-brain ex vivo diffusion weighted MRI (dw-MRI) data were collected with isotropic voxel size (125 µm; 20 axial slices) using a single shell with b-value of 4000 s/mm2 (G = 224 mT/m; ∆ = 23 ms; ∂ = 7.5 ms), 61 isotropically distributed non-collinear directions from the Camino tool box5. Scans were acquired with echo time (TE) = 38.6 ms and repetition time (TR) = 3592 ms.
The CV was calculated as CV = TCT/Length, which could be used to infer on the corresponding AD through the following relation6: $$$\text{CV} = (5.5/g) \cdot d$$$, with d being the inner AD, and assuming a constant g-ratio (g) of 0.7 for CNS7,8.
Measuring ADs from TEM
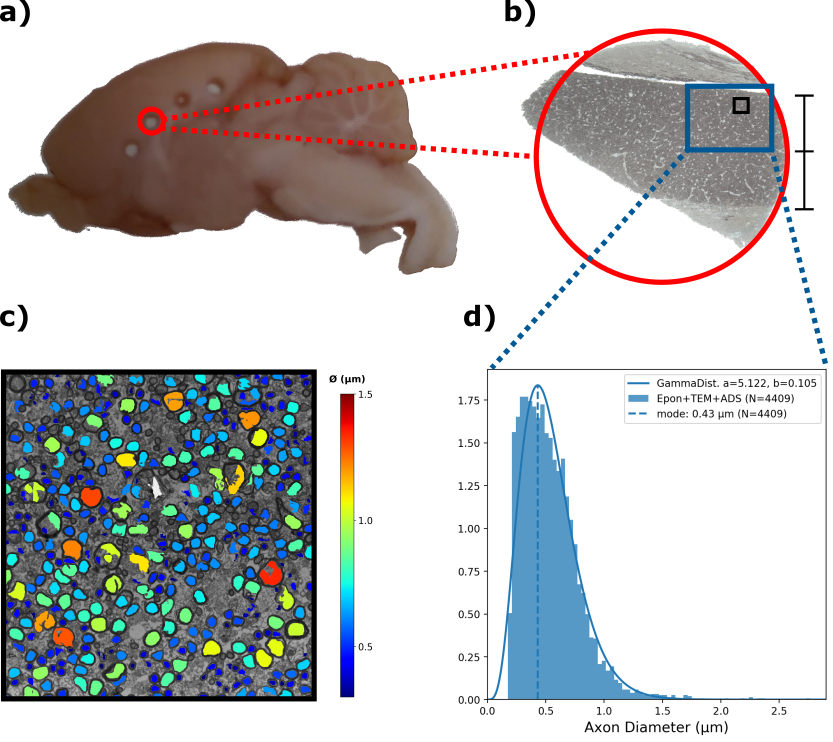
Tissue punctures from a midsagittal area were Epon-embedded9 (fig.4a) and then sectioned for TEM. TEM images were obtained at x4200 magnification of the M1 callosal projection region (fig.4b). The inner ADs were automatically segmented using AxonDeepSeg10 (fig.4c), obtaining an AD distribution (ADD) (fig.4d).
AD estimation with dwMRI
A pulsed gradient spin echo (PGSE) protocol was acquired for AD estimation with parameters: gradient strengths G = [500, 550, 590] mT/m, gradient separation ∆ = 18 ms and gradient duration ∂ = 8 ms. It was applied along 50 isotropically distributed directions and gave three unique b-values, b = [17840, 21558, 24783] s/mm2. These b-values are high enough to suppress contributions from the extra-axonal space11, and the SMT-3 model12 could thus be fitted to the powder averaged signal to obtain AD. The intrinsic ex vivo diffusivity was assumed to be $$$D_0 = 0.6 \cdot 10^{-9} \text{m}^2\text{/s}$$$. Voxel values of mean AD above 0.5 µm (1 value excluded) were extracted from a manually drawn ROI in the projection ROI.
Sensitivity simulation
To assess the lower bound of measurable diameter, the sensitivity profile to AD (fig. 2b) of this dw-MRI acquisition was calculated12. The signals from cylinders were analytically generated for diameters between 0.2 µm and 15.0 µm. Rician noise with a signal-to-noise ratio (SNR) of 100 was added to the signals and the SMT-3 model was fitted to obtain a diameter estimate.
Results and Discussion
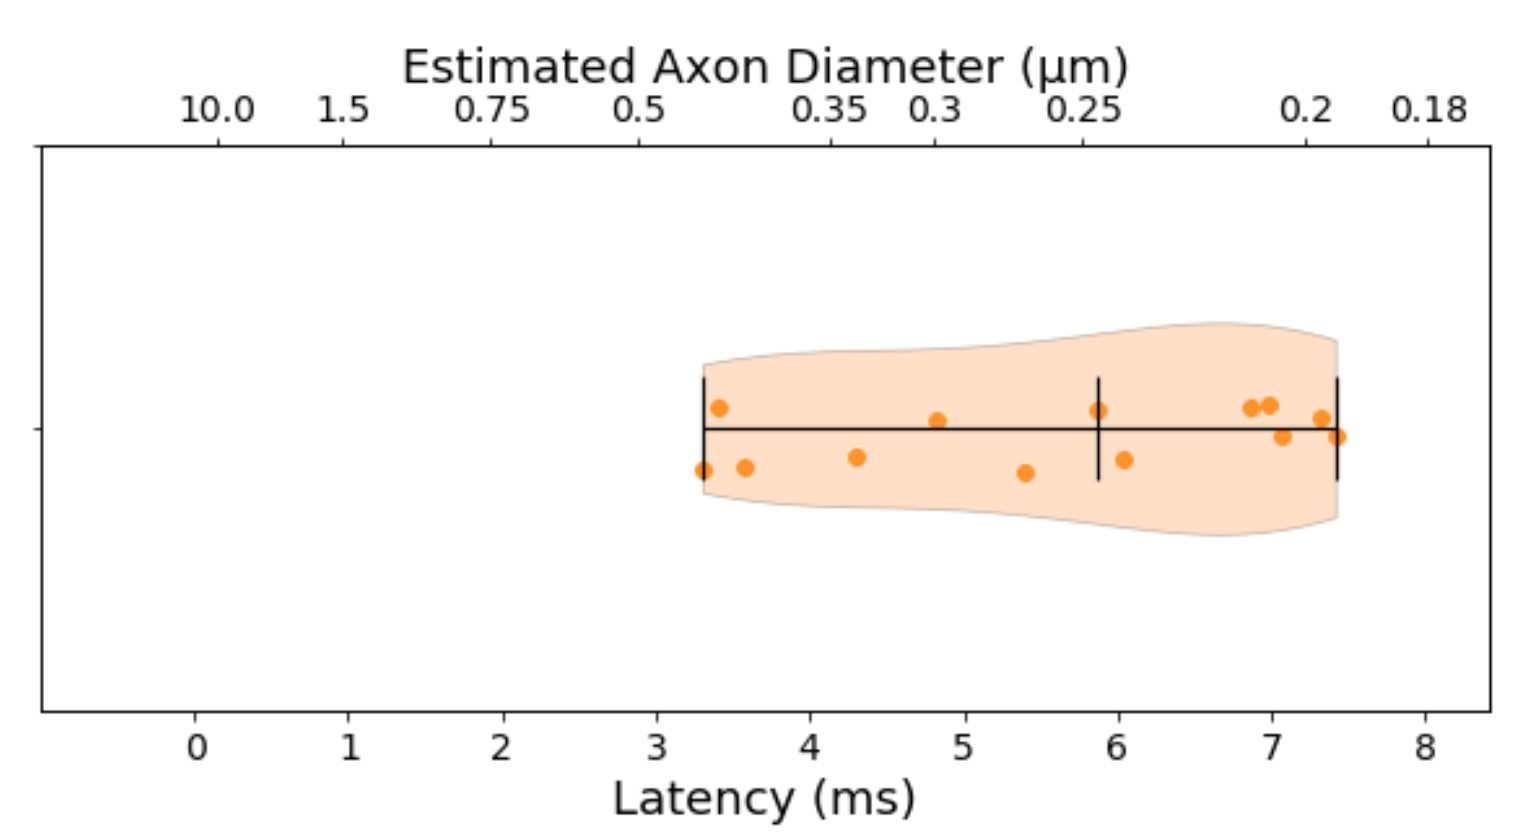
The median TCT was 5.6 ms with 0.3 ms mean standard deviation within animals and 1.49 ms between animals. Such latency corresponds to a predicted axon diameter of 0.25 ± 0.09 µm (fig.3)The ADD segmented from TEM images is shown in fig. 4d along with the gamma-fitted distribution (a = 5.122, b = 0.105). The ADD has a mode of 0.43 µm (mean = 0.54 µm; var = 0.06; skew = 0.88), with few axons being larger than 1.5 µm.
The ADs predicted from the electrophysiological experiments corresponded to the smaller axons up to the mode of the ADDs from histology. These recordings were thus not sensitive to detect latencies corresponding to the larger axons, which might even be underestimated due to shrinkage induced through tissue processing13.
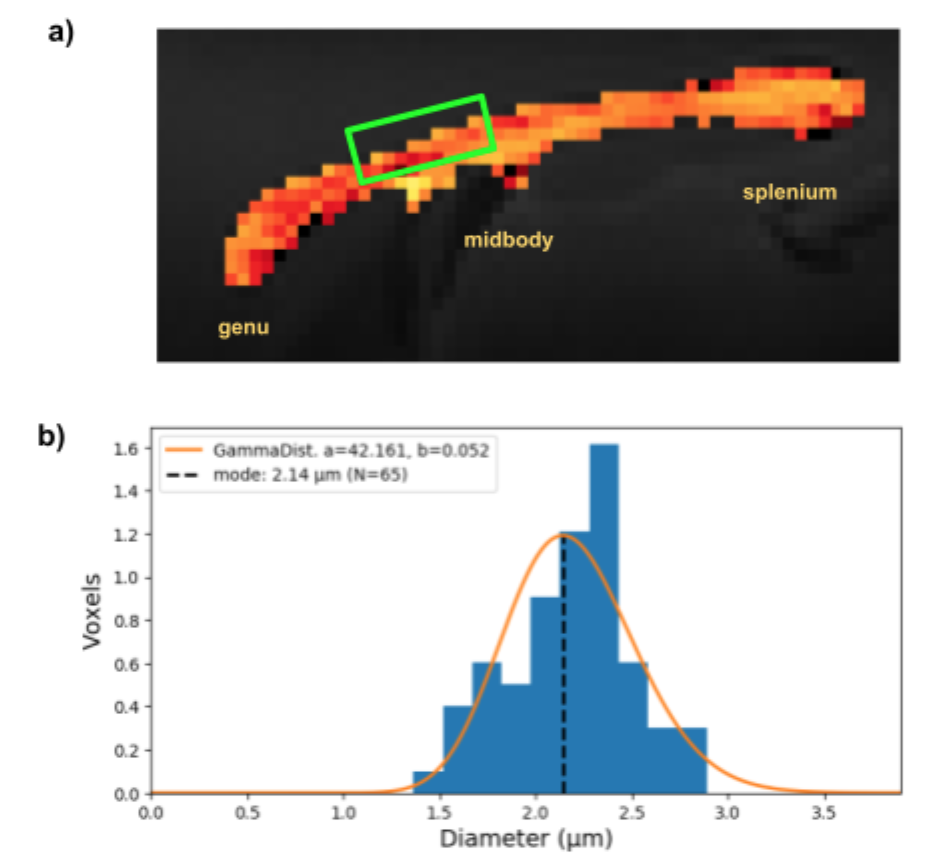
With dw-MRI we also estimated the mean volume-weighted ADs in the projection region revealed by tractography between the bilateral M1s, stimulated with optogenetics (fig.5a).
dw-MRI was mainly sensitive towards the larger axon diameter population, not captured with our electrophysiological recordings and only sparsely with histology. The latter might be limited by the FOV to robustly represent the low density of larger axons. The obtained mean ADs from dw-MRI are however all below the lower-bound of about 3.0 µm (fig.5b), indicating that they are likely underestimated, when taking the simulated sensitivity profile (fig.2b) into account.
Conclusion
All modalities (electrophysiology, TEM and dw-MRI) showed large variability and sensitivity. The mode of the ADD measured from TEM corresponds with the AD predicted from the latency of electrophysiology, but not the larger axon population for which dw-MRI appears sensitive towards. Future studies should choose modalities having sensitivity profiles suitable for observing the functional and structural ranges of interest.Acknowledgements
MA and CSS were supported by the Capital Region of Denmark Research Foundation (grant# A5657; PI: TBD). MP received funding from the European Union’s Horizon 2020 research and innovation programme under the Marie Skłodowska-Curie grant agreement #754462 (MP). HRS holds a 5-year professorship in precision medicine at the Faculty of Health Sciences and Medicine, University of Copenhagen which is sponsored by the Lundbeck Foundation (grant# R186-2015-2138).
References
1. Hursh JB. Conduction Velocity and Diameter of Nerve Fibers. American Journal of Physiology. 1939 Jul 31;127(1):131–9.2. Alexander DC, Hubbard PL, Hall MG, Moore EA, Ptito M, Parker GJM, et al. Orientationally invariant indices of axon diameter and density from diffusion MRI. Vol. 52, NeuroImage. 2010. p. 1374–89. Available from: http://dx.doi.org/10.1016/j.neuroimage.2010.05.043
3. Veraart J, Nunes D, Rudrapatna U, Fieremans E, Jones DK, Novikov DS, et al. Nonivasive quantification of axon radii using diffusion MRI. Elife. 2020 Feb 12;9. Available from: http://dx.doi.org/10.7554/eLife.49855
4. Skoven CS, Tomasevic L, Kvitsiani D, Pakkenberg B. Profiling the transcallosal response of rat motor cortex evoked by contralateral optogenetic stimulation of glutamatergic cortical neurons. bioRxiv. 2021; Available from: https://www.biorxiv.org/content/10.1101/2021.04.15.439619v1.abstract
5. Cook PA, Bai Y, Nedjati-Gilani S, Seunarine KK, Hall MG, Parker GJM, et al. Camino: open-source diffusion-MRI reconstruction and processing. 2006. Seattle, WA, USA. 2006;2759.
6. Waxman SG, Bennett MV. Relative conduction velocities of small myelinated and non-myelinated fibres in the central nervous system. Nat New Biol. 1972 Aug 16;238(85):217–9.
7. Tettoni L, Lehmann P, Houzel JC, Innocenti GM. Maxsim, software for the analysis of multiple axonal arbors and their simulated activation. J Neurosci Methods. 1996 Jul;67(1):1–9.
8. Caminiti R, Carducci F, Piervincenzi C. Diameter, Length, Speed, and Conduction Delay of Callosal Axons in Macaque Monkeys and Humans: Comparing Data from Histology and Magnetic Resonance Imaging Diffusion Tractography. Journal of Neuroscience. 2013; Available from: https://www.jneurosci.org/content/33/36/14501.short
9. Riise J, Pakkenberg B. Stereological estimation of the total number of myelinated callosal fibers in human subjects. J Anat. 2011 Mar;218(3):277–84.
10. Zaimi A, Wabartha M, Herman V, Antonsanti P-L, Perone CS, Cohen-Adad J. AxonDeepSeg: automatic axon and myelin segmentation from microscopy data using convolutional neural networks. Sci Rep. 2018 Feb 28;8(1):3816.
11. Veraart J, Raven EP, Edwards LJ, Weiskopf N, Jones DK. The variability of MR axon radii estimates in the human white matter. Hum Brain Mapp. 2021 May;42(7):2201–13.
12. Andersson M, Pizzolato M, Kjer HM, Skodborg, Katrine Forum, Lundell H, Dyrby TB. Does powder averaging remove dispersion bias in diffusion MRI diameter estimates within real 3D axonal architectures? Neuroimage. 2021 Nov 10;118718.
13. Dyrby TB, Innocenti GM, Bech M, Lundell H. Validation strategies for the interpretation of microstructure imaging using diffusion MRI. Vol. 182, NeuroImage. 2018. p. 62–79. Available from: http://dx.doi.org/10.1016/j.neuroimage.2018.06.049
Figures