2016
Different approaches of aspartate approximation in MEGA-PRESS 1H MRS spectra1Lomonosov Moscow State Univesity, Moscow, Russian Federation, 2Emanuel Institute of Biochemical Physics of RAS, Moscow, Russian Federation, 3Clinical and Research Institute of Emergency Pediatric Surgery and Traumatology, Moscow, Russian Federation, 4Johns Hopkins University, Baltimore, MD, United States, 5Semenov Institute of Chemical Physics of the Russian Academy of Sciences, Moscow, Russian Federation
Synopsis
Changes in Aspartate (Asp) concentrations are a potential biomarker of malate-aspartate shuttle dysfunction, as well as disturbances in the synthesis of NAA. J-difference editing allows the detection of a resolved Asp signal at δAsp ≈ 2.71ppm. This resonance has a complex shape and therefore approximation of the Asp signal is a challenging task. In our study we compare the performance of six Asp-approximation models applied to data from three brain regions (anterior cingulate gyrus (ACC), dorsolateral pre-frontal area (DLPFA) and visual cortex (VC)). A model consisting of four Gauss signals shows the best performance for all brain regions studied.
Introduction
Aspartate (Asp) is known to be an important amino acid that aids in the proper functioning of the central nervous system. To begin with, due to the Asp carries reducing equivalents in malate-aspartate shuttle (MAS)[1], changes in Asp concentrations could be used as a biomarker for MAS dysfunction. Furthermore, Asp is a precursor of N-acetyl-aspartate (NAA). Decreased NAA levels have been linked to a variety of diseases[2–4]. Simultaneous estimation of Asp and NAA using 1H MRS could be useful for figuring out why NAA levels are decreasing. J-difference editing methods, such as MEGA-PRESS[5] sequence, allows to obtain resolved Asp signal at δAsp ≈ 2.71ppm. Due to the intricate form of the Asp resonance in the MEGA-PRESS spectrum, approximating the Asp signal is a difficult operation. Therefore, the primary goal of this research was to optimize the approximation of the edited Asp signal at 2.71 ppm using several fitting models.Materials and methods
75 Asp-edited MEGA-PRESS spectra acquired in healthy volunteers (mean age – 21.2±3.3 years) were retrospectively analyzed: 33 spectra from the anterior cingulate gyrus (ACC) (voxel size: 50x25x25 mm); 23 spectra from the dorsolateral pre-frontal area (DLPFA) (voxel size: 50x19x27 mm); 19 spectra from the visual cortex (VC) (voxel size: 20x40x30 mm) (figure 1). We used Philips Achieva dStream 3.0T MRI scanner (Philips Healthcare, The Best, The Netherlands). The MEGA-PRESS pulse sequence had the following parameters: TE = 90 ms; TR = 2000 ms; 2048 points; spectral bandwidth 2 kHz; NSA = 288; MOIST water suppression, 25-ms editing pulses applied at δON = 3.89 ppm and δOFF = 5.21 ppm). 8 water reference transients were also acquired as a part of MEGA-PRESS.Data Processing
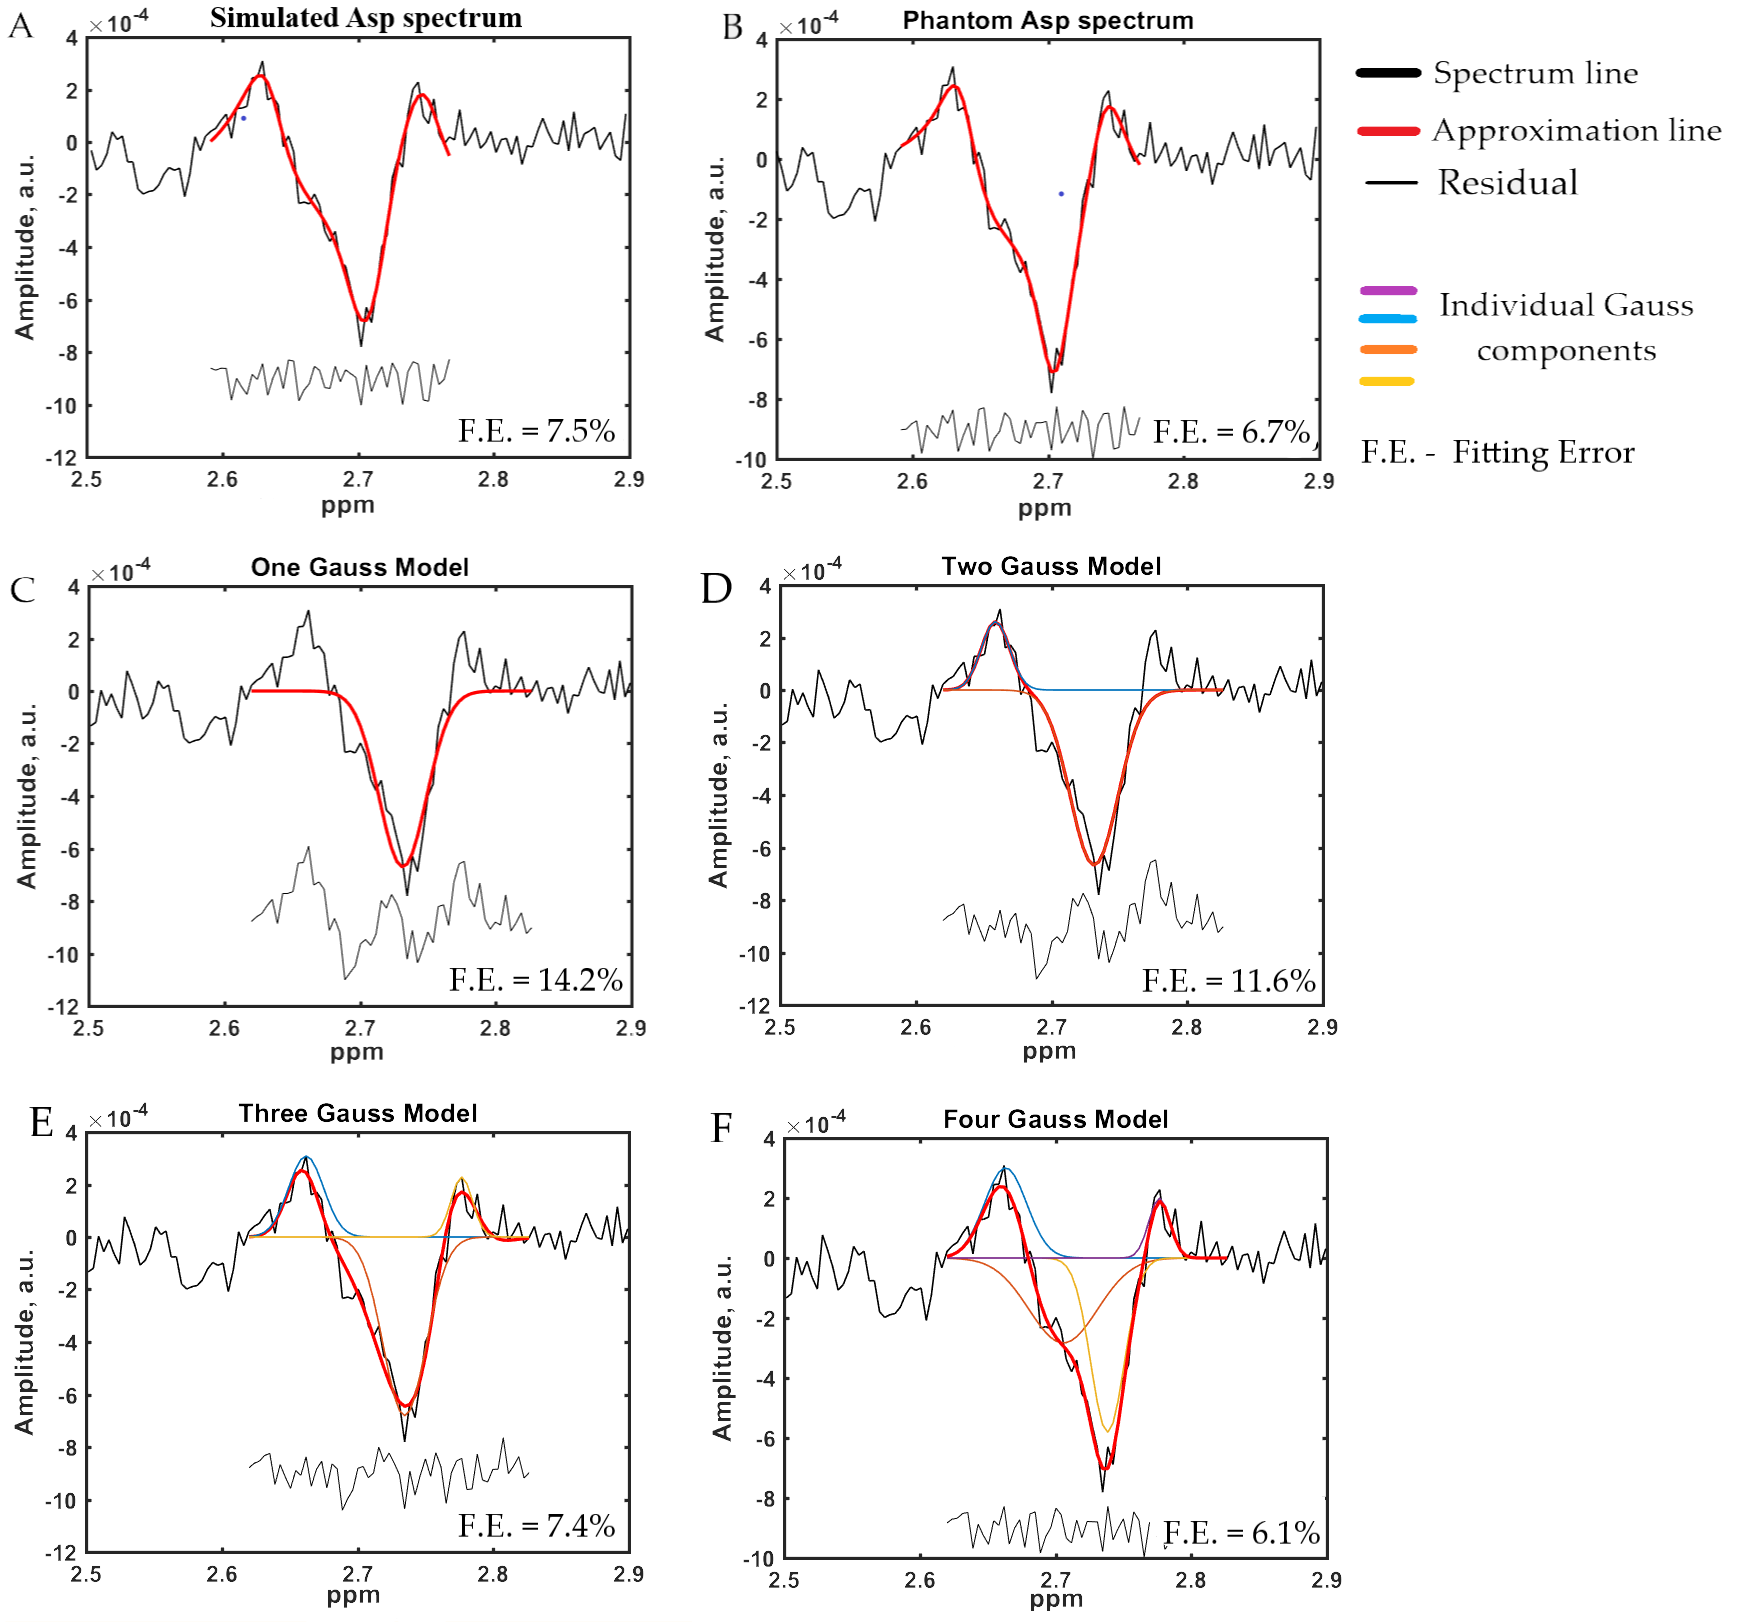
Using a combination of Gannet v3.120[6] and in-house scripts, spectral preprocessing and quantification were performed in MATLAB (MATrix LABoratory). Processing included zero filling, rejection of bad averages, aligning and averaging. We used six approximation models to estimate Asp signal intensity from the DIFF spectra between 2.62 and 2.83 ppm: a model of between one and four Gaussians, a measured phantom spectrum, and a simulated spectral line. For Asp approximation with experimental spectral line, phantom spectra were registered from prepared Asp (30 mM) and Cr (18 mM) solutions with pH = 7.2. The same MEGA-PRESS parameters as for in vivo spectral registration were utilized. Simulated spectral lines were obtained in FID-A[7] using density matrix simulations. The Asp and tCr peak (tCr = 3.01 ppm) signal-to-noise (SNR) levels, as well as the FWHM (full width at half maximum) values of the tCr, were computed for each spectra. The coefficient of variation (CV) of Asp-to-tCr ratios for three brain areas was measured for between-subject fitting techniques. The Spearman rank criteria in GraphPad Prism 8.4.3 (GraphPad Software, San Diego) software was used to investigate correlations between CV and fitting errors across the locations.Results
Samples of Asp approximation by various models were presented at figure 2. The main results were demonstrated in table 1. It is presented Asp SNR, creatine FWHM, fitting errors (FE) and CV for different approximation models. values for 4-gauss model were also presented. The main finding is that 4-Gaussian approximation shows the lowest fitting errors for all regions as compared to other approaches. The contrast in fitting approaches is clearly seen in ACC, where Asp SNR is substantially larger than in the other two regions: from the poorest values for 1-Gaussian to the best for 4-Gaussian, with phantom and simulation approximation fitting errors lying between 2- and 3-Gaussian models. In addition, for ACC, CV rises as the fitting error decreases, as evidenced by the substantial linear correlation between these variables (p=0,05, r= 0,83). ). For regions with low SNR (DLPFA, VC) the choice of fitting approach does not have significant effect on the fitting errors and between-subject CV values.Discussion
The 4-gauss model demonstrated the lowest fitting errors and the best approximation qualities. Probably it is due to the best matching of 4-gauss shape with in-vivo Asp spectra structure. It is interesting that simulated and phantom spectra approximation show the intermediate fitting errors and concede to 4-gauss model. This can be explained by the large number of degrees of freedom in the 4-gauss model. SNR values were also found to be much greater in the ACC than in the VC and DLPFA. This is tightly linked to the voxel volume as well as the gray matter fraction which are lower in DLPFA and VC respectively. Therefore, the low amplitude of outer parts of Asp multiplet compared with noise level in VC voxels with lowest SNR may add additional uncertainty in phantom and simulation modeling. However, for robust Asp quantification spectra with high SNR, fitting using phantom and simulated spectra may be considered.Conclusion
The major finding is that, when compared to other approaches, the 4-Gaussian approximation has the lowest fitting errors for all regions. Fitting with phantom and simulated spectra may be explored for robust Asp quantification in spectra with high SNR.Acknowledgements
No acknowledgement found.References
1. H. Chen, C. Wang, X. Wei, X. Ding, W. Ying, Malate-Aspartate Shuttle Inhibitor Aminooxyacetate Acid Induces Apoptosis and Impairs Energy Metabolism of Both Resting Microglia and LPS-Activated Microglia, Neurochem. Res. 40 (2015) 1311–1318. https://doi.org/10.1007/S11064-015-1589-Y.
2. P.E. Menshchikov, N.A. Semenova, A. V. Manzhurtsev, T.A. Akhadov, S.D. Varfolomeev, Cerebral quantification of N-acetyl aspartate, aspartate, and glutamate levels in local structures of the human brain using J-editing of 1H magnetic resonance spectra in vivo, Russ. Chem. Bull. 2018 674. 67 (2018) 655–662. https://doi.org/10.1007/S11172-018-2119-2.
3. J.A. Stanley, M. Vemulapalli, J. Nutche, D.M. Montrose, J.A. Sweeney, J.W. Pettegrew, F.P. MacMaster, M.S. Keshavan, Reduced N-acetyl-aspartate levels in shizophrenia patients with a younger onset age: a single-voxel 1H spectroscopy study, Schizophr. Res. 93 (2007) 23. https://doi.org/10.1016/J.SCHRES.2007.03.028.
4. T.C. Ford, D.P. Crewther, A Comprehensive Review of the 1H-MRS Metabolite Spectrum in Autism Spectrum Disorder, Front. Mol. Neurosci. 0 (2016) 14. https://doi.org/10.3389/FNMOL.2016.00014.
5. M. Mescher, H. Merkle, J. Kirsch, M. Garwood, R. Gruetter, Simultaneous in vivo spectral editing and water suppression, NMR Biomed. 11 (1998) 266-272. https://doi.org/10.1002/(sici)1099-1492(199810)11:6<266::aid-nbm530>3.0.co;2-j.
6. R.A.E. Edden, N.A.J. Puts, A.D. Harris, P.B. Barker, C.J. Evans, Gannet: A batch-processing tool for the quantitative analysis of gamma-aminobutyric acid-edited MR spectroscopy spectra, J. Magn. Reson. Imaging. 40 (2014) 1445–1452. https://doi.org/10.1002/JMRI.24478.
7. R. Simpson, G.A. Devenyi, P. Jezzard, T.J. Hennessy, J. Near, Advanced processing and simulation of MRS data using the FID appliance (FID-A)—An open source, MATLAB-based toolkit, Magn. Reson. Med. 77 (2017) 23–33. https://doi.org/10.1002/MRM.26091.
Figures