2014
Fast scan downfield MR spectra of human brain in vivo at 7.0 Tesla1Perelman School of Medicine at The University of Pennsylvania, Philadelphia, PA, United States, 2Radiology, Center for Advance Metabolic Imaging in Precision Medicine, Perelman School of Medicine at The University of Pennsylvania, Philadelphia, PA, United States, 3Bioengineering, University of Pennsylvania, Philadelphia, PA, United States
Synopsis
In this study, we investigated the optimal acquisition parameters in terms of voxel size, SNR and total scan time to obtain high quality NAD+ 1H downfield (>4.7 ppm) spectra from human brain at 7 Tesla. Using a spectrally selective excitation spatially selective localization pulse sequence and without water suppression, large voxel size and shorter TR, we were able to acquire NAD+ spectra with an SNR of ~30 in about 5 min. Preliminary results of high SNR and resolution enhanced NAD+ spectra from human brain of healthy volunteers are presented.
INTRODUCTION
Nicotinamide adenine dinucleotide (NAD+), a coenzyme involved in the redox reactions, has a vital role in the cellular metabolism and serves as substrate for several families of regulatory proteins that are involved in many vital processes such as aging, DNA repair, apoptosis, to name a few1-6. Current techniques for in vivo monitoring of NAD+ levels are phosphorous spectroscopy (31P NMR), which cannot distinguish between oxidized and reduced form7 and very recently, down field magnetic resonance spectroscopy (DFMRS) has been shown to detect NAD+ in the brain8-10 and calf muscle11. A limitation of 1H MRS quantification of [NAD+] is the long scan times required to achieve a sufficient signal-to-noise ratio. In human brain, [NAD+] <1 mM and it has significant cross-relaxation with water, limiting its overall detectability. In this study, we investigated the optimal acquisition parameters in terms of voxel size, SNR and total scan time to obtain high quality NAD+ spectra from human brain at 7.0 T.METHODS
After explaining the study protocol and obtaining the consent form, three subjects (all males) in the age range of 27-42Y participated in this IRB approved study. All the downfield 1HMRS data were obtained at 7.0 T Terra (Siemens Healthcare, Erlangen, Germany) using a single-channel transmit/32-channel receive phased array head radio frequency coil. A spectrally selective 90° E-BURP pulse12 centered at 9.1ppm was used to excite the NAD+ resonances with a band-width (BW) of 2ppm at three different TR’s of 590, 750 and 1000 ms (TE:18ms, 256 averages). A three narrow spatially selective refocusing 180° Shinnar-Le Roux (SLR) pulses with a BW of 800Hz were used for localization as described in our previous study10. Total acquisition time for NAD+ spectra including water eddy scans (16 averages & 8 dummy scans; 24s) and water reference scans with long TR of 10s (16 averages & 8 dummy scans; 2min24s) were 5min20s, 6min1s and 7min5s, respectively. A large voxel was positioned to cover the maximum area within the brain and the voxel dimensions varied across the volunteers to cover their maximum brain area (250-350cc). The NAD+ peaks at 9.14 (labeled NAD2) and 9.33ppm (labeled NAD3) are fitted in the time domain using Hankel singular value decomposition (HSVD)11,12 to model Lorentzian signal components. NAD+ concentrations were calculated based on the equation reported in our prior study10.RESULTS
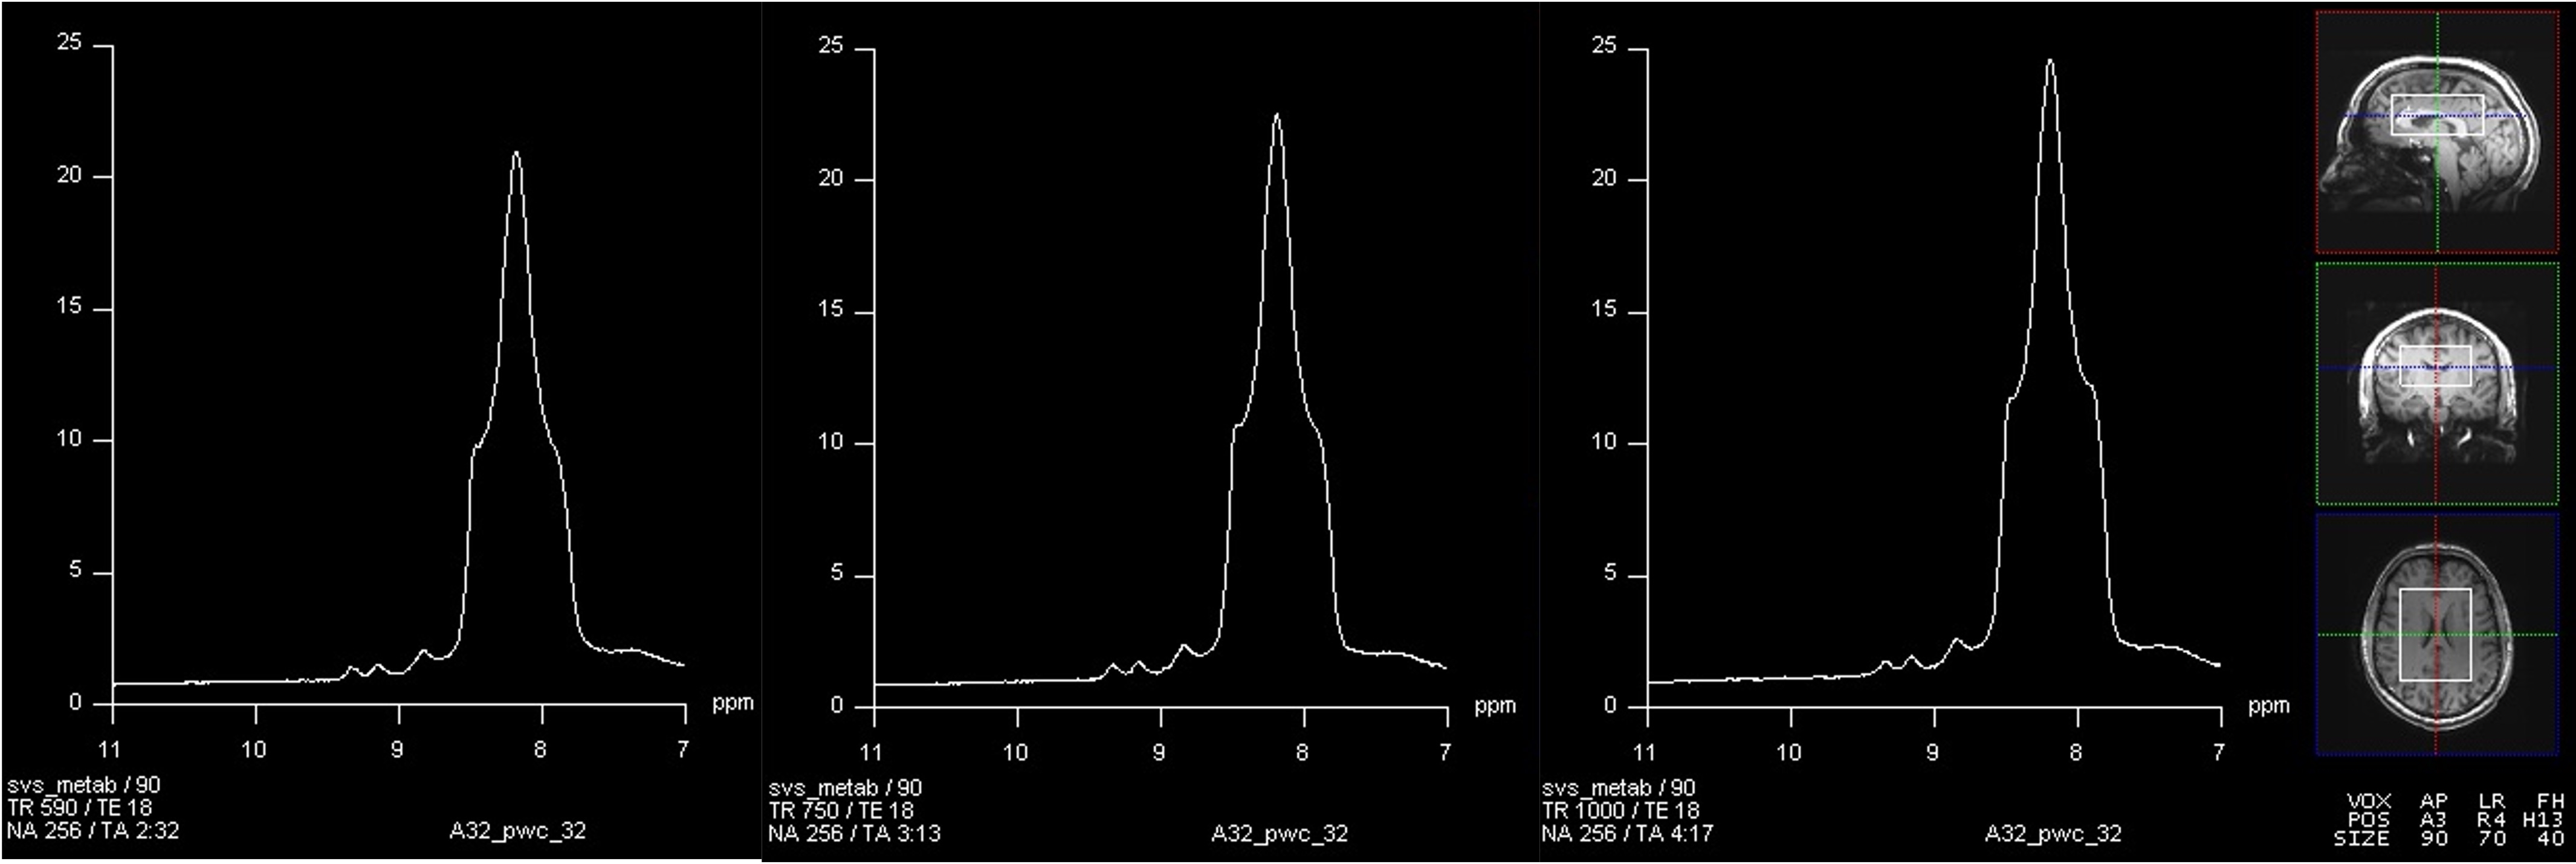
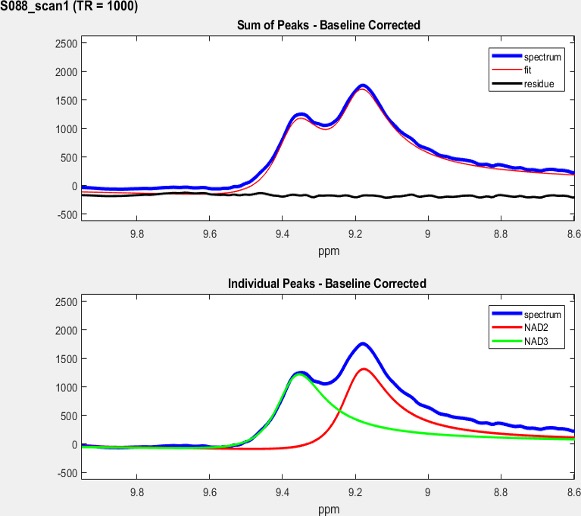
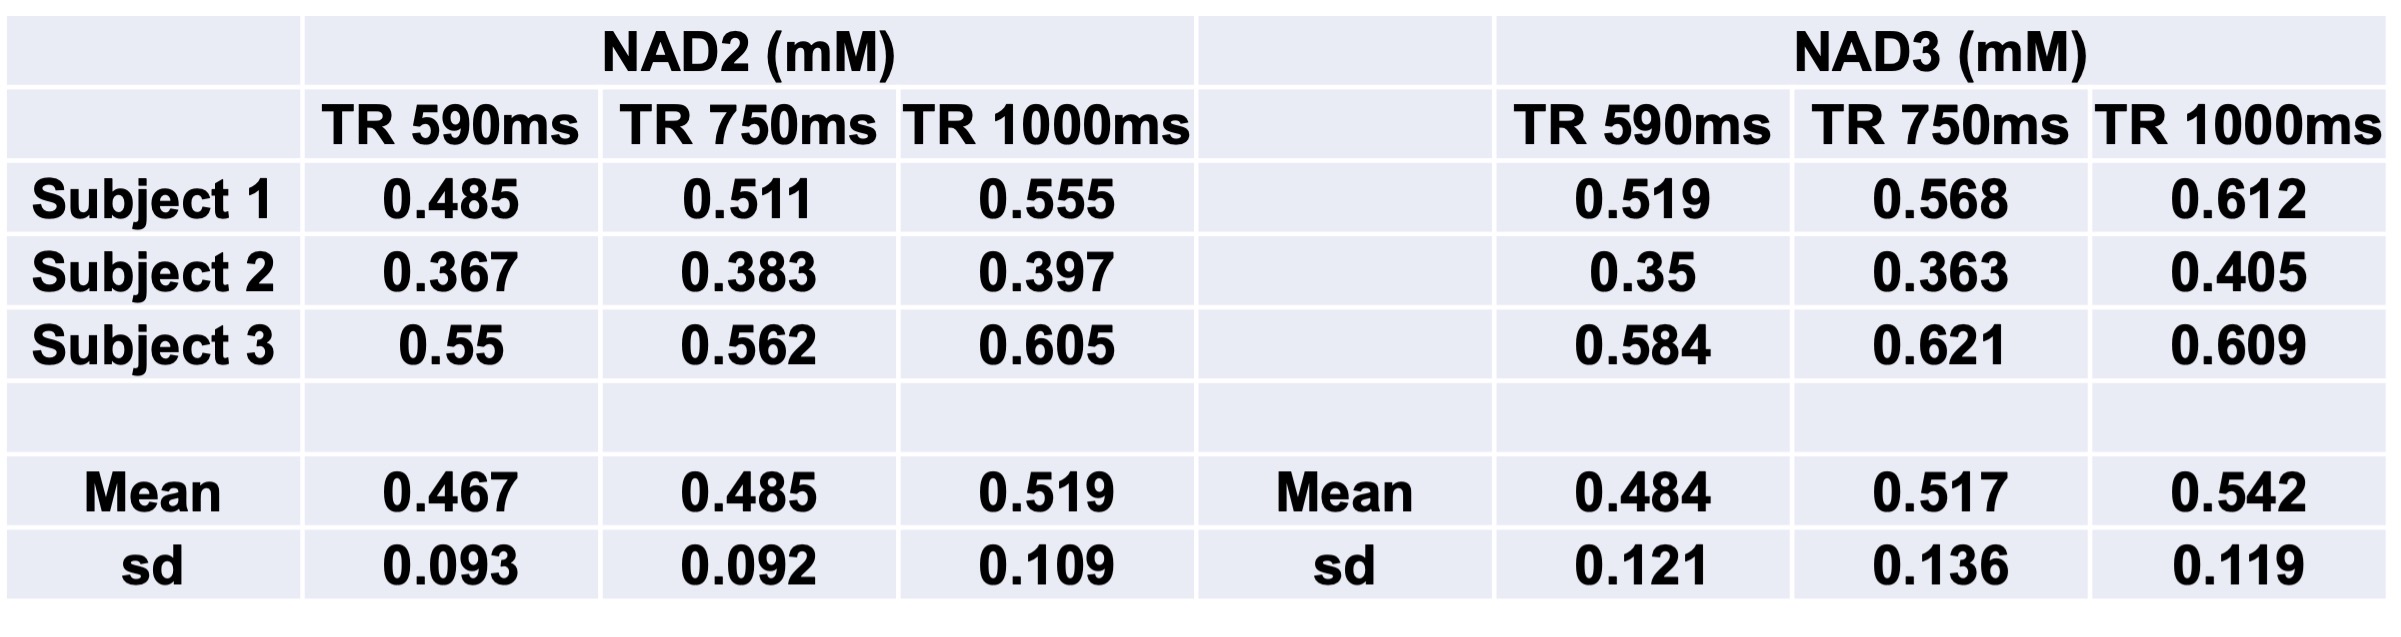
A representative large voxel from which the NAD+ spectroscopy was acquired from the brain of one of the volunteers in vivo is shown in Figure 1. Water signal full-width at half maximum for all the subjects were between 21-26Hz. A representative NAD+ spectrum from one of the volunteers is shown in Figure 2 for all the three TR’s of 590/750/1000ms with same scale as that of TR=1000ms. The quality of fit for NAD+ peaks for the same subject data by HSVD is shown in Figure 3. The NAD+ peak fitted values are listed in Figure 4 for all the three volunteers scanned. Mean NAD+ peak concentration for NAD2 and NAD3 peaks from all the subjects were 0.519±0.11 mM and 0.542±0.12 mM, respectively for data acquired at TR of 1000ms, while a reduction of 10% in calculated concentration values were observed at the shorter TR of 590ms. Please note that the concentrations reported here do not incorporate the gray (GM), white (WM) and CSF matter fractions of brain.DISCUSSION
Previously published study employed a 40x40x40 mm3 voxel on occipital lobe with a scan time requirement of ~12min. By optimizing the scan parameters and by employing a large voxel, we were able to reduce the total scan time to 7min5s for a TR of 1000ms which can further be reduced down to 5min20s at a TR of 590ms with a slightly reduced SNR. With these optimized larger voxel acquisitions, along with an improved SNR we have also observed that the NAD+ peaks were better resolved. Further work is in progress for improving the peak fitting algorithm along with the incorporation of GM, WM and CSF fractions for accurate quantification of NAD+ peaks.CONCLUSION
We were able to reduce the scan time to 5min20s to acquire high quality NAD+ spectra (with an SNR of ~30) from human brain by reducing the TR and increasing the voxel size. We anticipate robust detection of NAD+ spectra from the brain of patients with aging and other neurological disorders with the optimized acquisition parameters described here. Given the short scan time, it can be readily implemented as an add on scan to any clinical protocol involving the studies of brain metabolism.Acknowledgements
Research reported here was supported by the National Institute of Biomedical Imaging and Bioengineering of the National Institutes of Health under award Number P41EB029460 and by the National Institute of Aging of the National Institute of Health under award Numbers R56AG062665 and R01AG063869.References
1. Stein LR, Imai S. The dynamic regulation of NAD metabolism in mitochondria. Trends Endocrinol Metab. 2012;23:420-38.
2. Bai P, Canto C. The role of PARP-1 and PARP-2 enzymes in metabolic regulation and disease Cell Metab. 2012;16:290-95.
3. Gupte R, Liu Z, Kraus WL et al. PARPs and ADP-ribosylation: recent advances linking molecular functions to biological outcomes. Genes Dev 2017;31:101-126.
4. Cohen MS, Chang P. Insights into the biogenesis, function, and regulation of ADP-ribosylation. Nat Chem Biol. 2018;14:236-243.
5. Houtkooper RH, Pirinen E, Auwerx J. Sirtuins as regulators of metabolism and healthspan. Nat Rev Mol Cell Biol. 2012;13:225-228.
6. Nikiforov A, Kulikova V, Ziegler M. The human NAD metabolome: Functions, metabolism and compartmentalization. Crit Rev Biochem Mol Biol. 2015;50:284-297.
7. Lu M, Zhu X-H, Zhang Y, et al. Intracellular redox state revealed by in vivo (31)P MRS measurement of NAD(+) and NADH contents in brains. Magn Res Med. 2014;71:1959-1972.
8. de Graaf RA, Behar KL. Detection of cerebral NAD(+) by in vivo (1)H NMR spectroscopy. NMR Biomed. 2014;27:802-809.
9. de Graaf RA, De Feyter HM, Brown PB, et al. Detection of cerebral NAD+ in humans at 7T. Magn Reson Med. 2017;78:828-835.
10. Bagga P, Hariharan H, Wilson NE, et al. Single-voxel 1H MR spectroscopy of cerebral nicotinamide adenine dinucleotide (NAD+) in humans at 7T using a 32-channel volume coil. Magn Reson Med. 2020;83:806-814.
11. Bagga P, et al. In vivo detection of NAD+ in human calf muscle at 7T using 28 channel knee volume coil at 7T. ISMRM&SMRT Annual Meeting and Exhibition 2018.
12. Geen H, Freeman R. Band-selective radiofrequency pulses. J Magn Reson. 1991;93:93-141.
13. Barkhuijsen H, De Beer R, Van Ormondt D. Improved algorithm for noniterative time-domain model fitting to exponentially damped magnetic resonance signals. J Magn Reson.1987;73:553-557.
14. Pijnappel W, Van den Boogaart A, De Beer R, et al. SVD-based quantification of magnetic resonance signals. J Magn Reson.1992;97:122-134.
Figures