2013
Assessing the feasibility of measuring glycine with a TE-Averaged MRS sequence at 3 Tesla1Institute of Mental Health Research, The Royal Ottawa Mental Health Centre, Ottawa, ON, Canada
Synopsis
A TE-Averaged sequence was created on a Siemens Biograph mMR 3 Tesla scanner for the purpose of detecting glycine at a clinical field strength in a healthy population. The sequence demonstrated that it can detect glycine and glutamate with moderate reproducibility, potentially providing a method to indirectly measure the health of the NMDA receptor
Introduction
The amino acid glycine is a necessary co-agonist to the primary glutamatergic receptor, the N-methyl-D-aspartate receptor (NMDAR)1,2. The NMDAR has been implicated in schizophrenia and addiction3,4, and has been shown to be strongly connected to working memory performance5. It is possible that in vivo measurements of glycine could be indirect indicators of NMDAR function, making glycine an interesting target for magnetic resonance spectroscopy (MRS) studies. Standard MRS techniques cannot reliably measure glycine in vivo due to its low concentration and overlap with other strongly coupled metabolites including myo-inositol (myo), though several novel methodologies have shown promise6–8. One technique that has been used at magnetic field strengths of 4 Tesla and higher is echo-time averaged (TE-averaged) MRS6,9,10. This sequence utilizes the destructive combination of myo peaks when averaged over many TE due to the J-dephasing that occurs, compared to the constructive combination of the glycine singlet every TE. As field strengths higher than 3 Tesla are rare, the intention of this work is to assess the feasibility of using TE-averaged MRS for measuring glycine at the clinical field strength of 3 Tesla.Methods
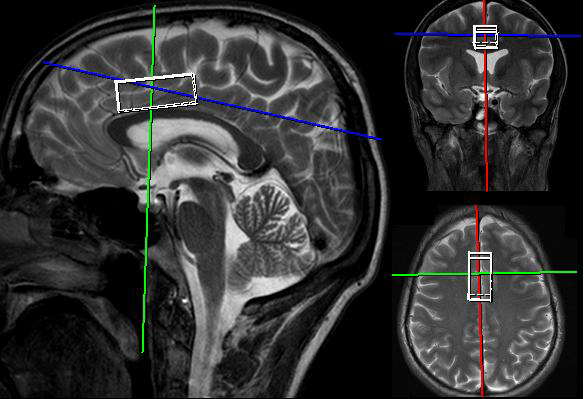
All experiments were performed on a Siemens Biograph mMR 3 Tesla PET/MRI using a 32ch head coil. One participant provided informed written consent and was scanned 10 times over the course of a week. The participant was removed from the scanner between each session to assess the reproducibility of the technique and the placement of the 3x2x1.5 cm3 voxel placed in the dorsal anterior cingulate cortex (dACC; Fig. 1). A TE-Averaged MRS sequence was created based off the stock PRESS sequence (TR=2000 ms, TE=30-260 ms, ΔTE=10 ms, 240 total averages, 10 averages per TE, TAcq= 8 min). A water unsuppressed spectrum with one average per TE was acquired for concentration estimates. Averages were acquired individually then frequency and phase corrected before being combined offline using in-house software. Spectra were fit using LCModel11 using a basis set simulated using FID-A12. Spectral signatures for were corrected for T2 relaxation effects at each TE then combined to form the basis set.Results
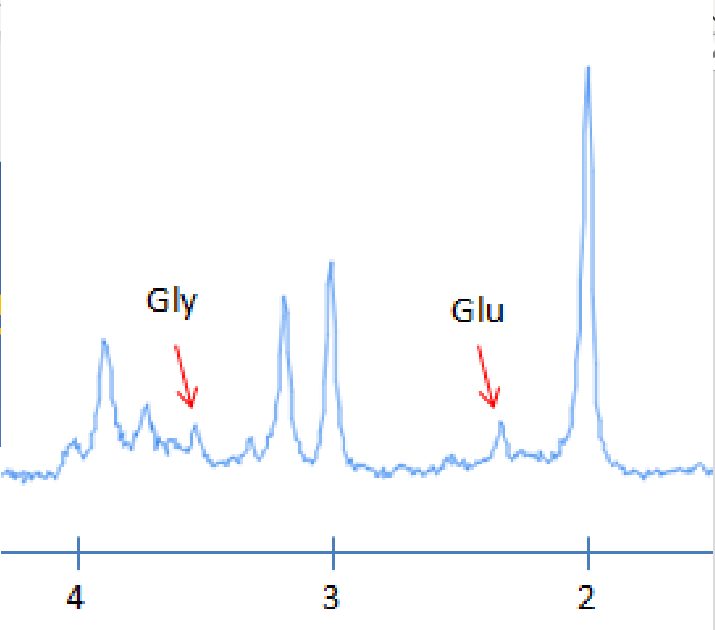
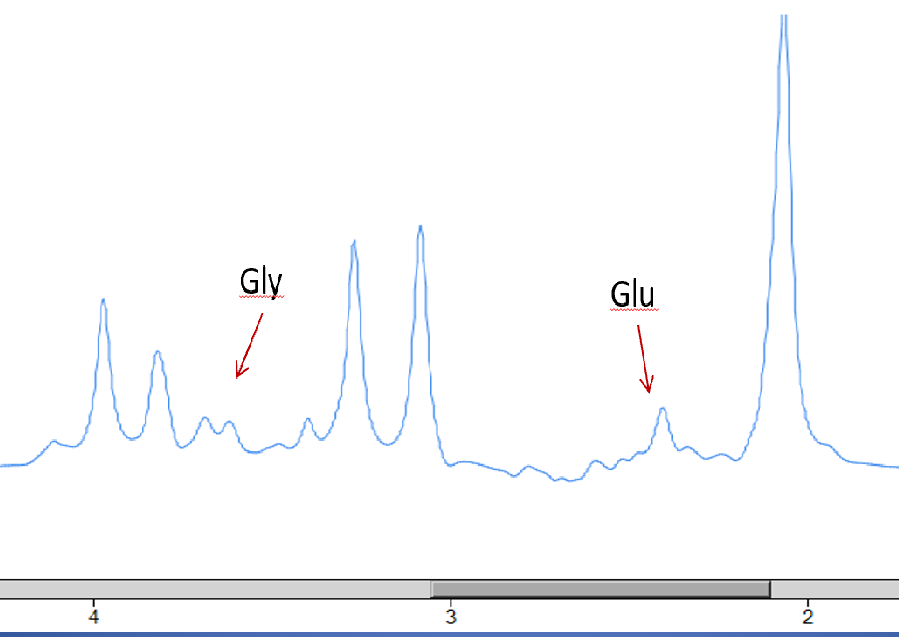
TE-Averaged spectra were acquired from the dACC with good SNR and linewidths (Fig. 2). There appears to be well-resolved glycine and glutamate peaks in the resulting averaged spectrum which compares well with the expected simulated output (Fig. 3). The Coefficients of Variation (CV) for glycine and glutamate concentrations were 16.5% and 10.4%, respectively, and 15.2% and 7.7%, respectively, when using creatine ratios. The smallest detectable difference (SDD) between two cohorts of n=30 would then be 12.5% and 7.9% for glycine and glutamate concentrations, respectively, and 11.4% and 5.8% for ratios to creatine. There were two glycine measurements with relatively lower concentrations that had Cramer-Rao Lower-Bounds (CRLB) greater than 20% (26% and 22%), with the remaining estimates having an average CRLB of 14.8 +/- 2.1%. The average glutamate CRLB was 8.4 +/- 1.5%.Discussion
Compared to traditional MRS techniques, glycine was able to be quantified with some degree of reliability using TE-Averaged MRS at 3 Tesla. Due to the low concentration of glycine, it is not surprising that the CRLB values were relatively high. However, the SDD values between two groups with n=30 were higher than ideal. This acquisition was constrained to 24 TE with 10 averages each and 10ms increments. It is possible a broader range of TE, or smaller increments, would be beneficial as others have demonstrated at higher field strengths6,9,10. The main issue with long TE acquisitions is the amount of signal relaxation that occurs compared to short TE spectra and at 3 Tesla there will be even less signal remaining. It is likely that the ideal combination of TE is not a linear array and perhaps the sequence could benefit from a Monte-Carlo simulation approach to optimizing the TE combination that is used. It would be recommended to use creatine ratios over concentration estimates for studies using this sequence as the reproducibility values were slightly better. The sequence demonstrated that it can measure glutamate, and being able to reliably measure both glycine and glutamate in one acquisition could be a useful approach to indirectly studying the NMDAR using MRS. A similar technique to the TE-Averaged sequence is 2D-JPRESS7,13, which has more difficult post-processing, but has demonstrated improved glycine measurements at 3 Tesla over the current technique. It is possible that an optimized TE parameter set would improve the acquisition over 2D-JPRESS, but currently it does not perform as well.Conclusion
The TE-Averaged MRS sequence demonstrated that it can be used to measure glycine at 3 Tesla with moderate reproducibility, though there is likely room to improve. With its current parameter set, other demonstrated techniques may be better options at 3 Tesla.Acknowledgements
The author would like to thank the Brain Imaging Centre at the Royal Ottawa Mental Health Centre for the scan time provided in-kind.References
1. Cummings, K. A. & Popescu, G. K. Glycine-dependent activation of NMDA receptors. J. Gen. Physiol. 145, 513–527 (2015).
2. Coyle, J. T. & Tsai, G. The NMDA receptor glycine modulatory site: a therapeutic target for improving cognition and reducing negative symptoms in schizophrenia. Psychopharmacology (Berl). 174, 32–38 (2004).
3. Harvey, R. J. & Yee, B. K. Glycine transporters as novel therapeutic targets in schizophrenia, alcohol dependence and pain. Nat. Rev. Drug Discov. 12, 866–85 (2013).
4. Coyle, J. T. NMDA receptor and schizophrenia: A brief history. Schizophr. Bull. 38, 920–926 (2012).
5. Newcomer, J. W., Farber, N. B. & Olney, J. W. NMDA receptor function, memory, and brain aging. Dialogues Clin. Neurosci. 2, 219–232 (2000).
6. Prescot, A. P. et al. In vivo detection of brain glycine with echo-time-averaged 1H magnetic resonance spectroscopy at 4.0 T. Magn. Reson. Med. 55, 681–686 (2006).
7. Prisciandaro, J. J. et al. Evidence for a unique association between fronto-cortical glycine levels and recent heavy drinking in treatment naïve individuals with alcohol use disorder. Neurosci. Lett. 706, 207–210 (2019).
8. Choi, C. et al. Measurement of glycine in human brain by triple refocusing 1H-MRS in vivo at 3.0T. Magn. Reson. Med. 59, 59–64 (2008).
9. Kim, S.-Y. et al. In Vivo Brain Glycine and Glutamate Concentrations in Patients With First-Episode Psychosis Measured by Echo Time–Averaged Proton Magnetic Resonance Spectroscopy at 4T. Biol. Psychiatry 83, 484–491 (2018).
10. Kaufman, M. J. et al. Oral glycine administration increases brain glycine/creatine ratios in men: A proton magnetic resonance spectroscopy study. Psychiatry Res. - Neuroimaging 173, 143–149 (2009).
11. Provencher, S. Estimation of metabolite concentrations from localized in vivo proton NMR spectra. Magn. Reson. Med. 30, 672–679 (1993).
12. Simpson, R., Devenyi, G. A., Jezzard, P., Hennessy, T. J. & Near, J. Advanced processing and simulation of MRS data using the FID appliance (FID-A)—An open source, MATLAB-based toolkit. Magn. Reson. Med. 77, 23–33 (2015).
13. Schulte, R. F., Lange, T., Beck, J., Meier, D. & Boesiger, P. Improved two-dimensional J-resolved spectroscopy. NMR Biomed. 19, 264–270 (2006).
Figures