2012
Evaluation of a new, openly accessible in vivo MP2RAGE mouse brain template for registration and morphometric analysis1Neuroimaging, King's College London, London, United Kingdom, 2Basic & Clinical Neuroscience, King's College London, London, United Kingdom
Synopsis
The most popular mouse brain templates are created from ex vivo scans while in vivo templates are not widely available. We have released openly accessible in vivo multi-contrast mouse brain templates and associated tissue probability maps for analyses of in vivo mouse neuroimaging data. Deformation-based morphometry was performed on a test dataset using a study-specific template, our new “MouseIn” template, or the ex vivo DSURQE template. The results using the MouseIn template better matched those using the “gold-standard” study-specific template compared to those using the ex vivo template.
Introduction
The most popular mouse brain templates (e.g., DSURQE1, AMBMC2,3, Waxholm4) are created from ex vivo scans. While this provides higher image quality and resolution, ex vivo brain morphology differs from that in vivo5, even within subject6,7,8. This brings into question the choice of registration template for in vivo mouse neuroimaging studies, as registration can be biased by template choice9,10.Many studies use study-specific templates, but their redistribution rarely follows FAIR principles11. Often, they are only accessible by contacting the authors and/or lack appropriate licenses for redistribution, which hamper scientific reproducibility.
To address these issues, we have developed an in vivo MRI mouse brain template and associated resources, which are openly available via the Open Science Framework, and the version-controlled template repository, TemplateFlow12.
We compared our new template to the ex vivo DSURQE template to test the impact of template choice on performing deformation-based morphometry on an in vivo dataset.
Methods
An in vivo mouse brain template (named the MouseIn template) was created from 53 wild-type C57Bl6/J mice (23 females) ranging from 12 to 56 weeks of age.The test dataset came from an ongoing, unpublished longitudinal study of a TDP-43Q331K knock-in mouse model of ALS-FTD13. The cohort comprised 28 homozygous (Hom) mutants (12 females) and 29 wild-type (WT) littermates (15 females).
For all mice, MP2RAGE images (150-micron isotropic resolution) were acquired with a 9.4T Bruker BioSpec 94/20 using an 86-mm volume resonator and 2x2 phased array receiver coil.
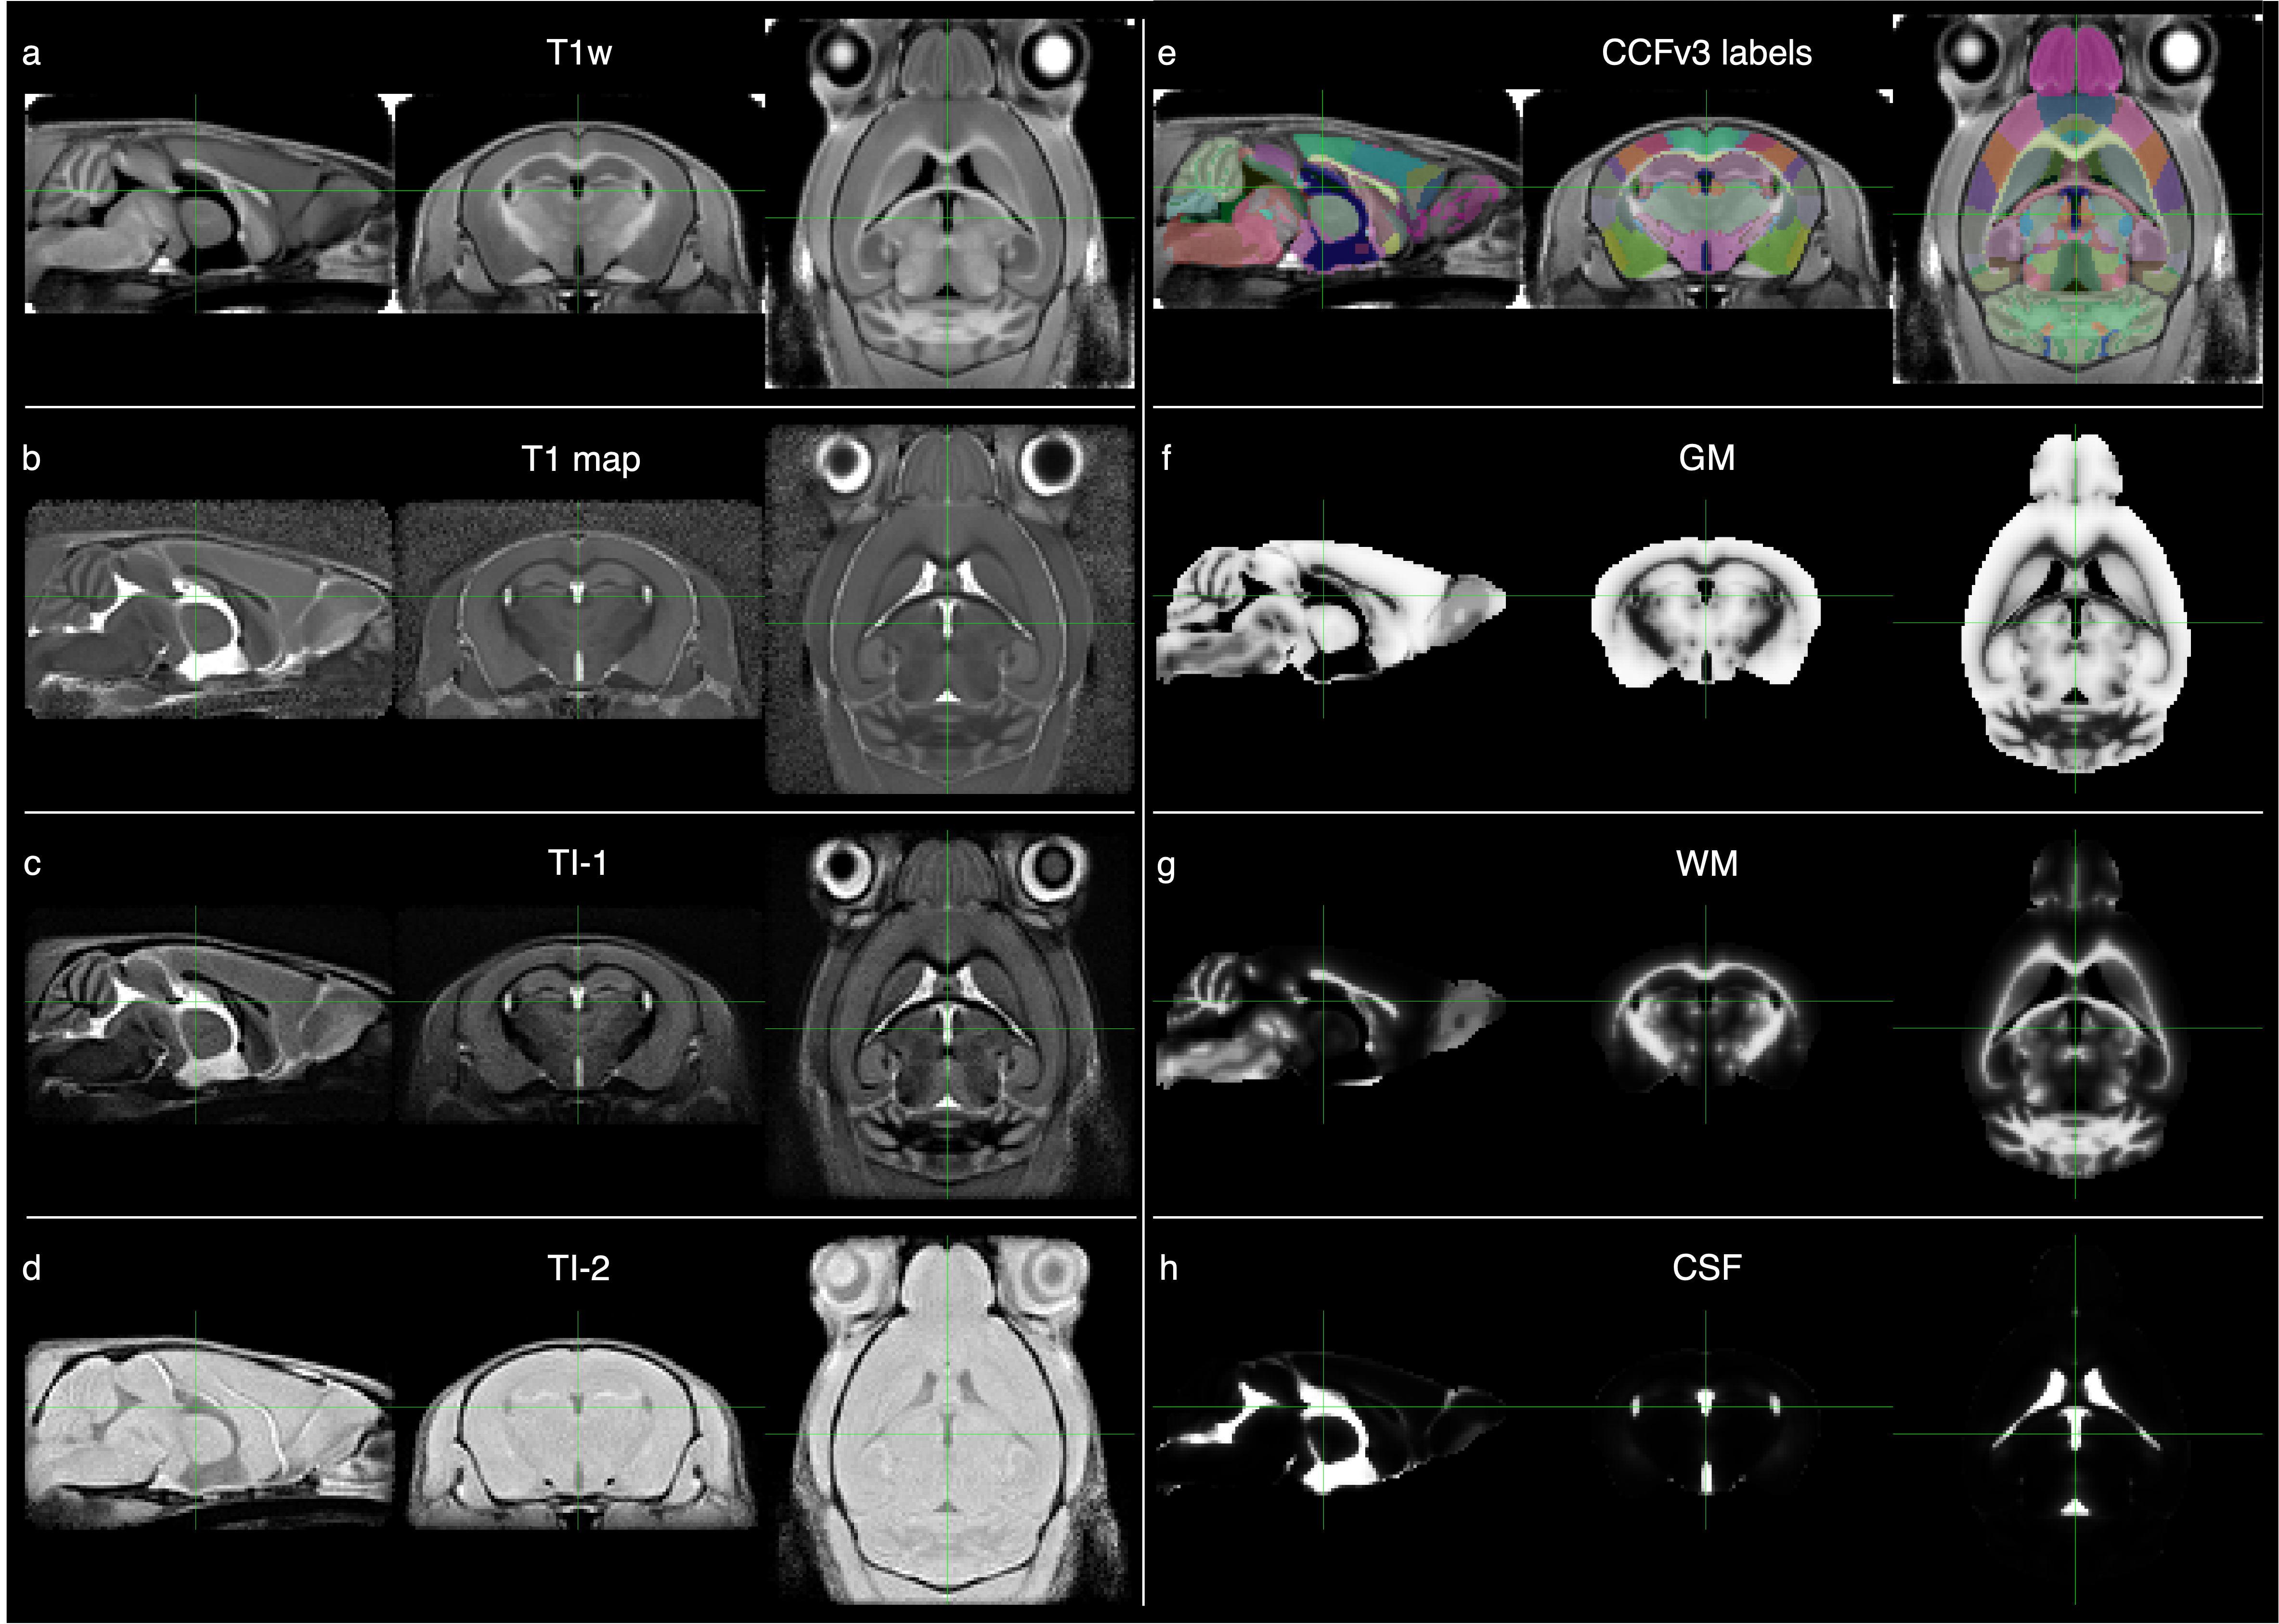
T1w images and T1 relaxation time maps were generated from the MP2RAGE images. Additionally, bias field correction was applied to the two inversion time images (TI-1 and TI-2). These four sets of images were used to create the multi-contrast MouseIn template (Figure 1a-d). Similarly, a study-specific template was generated from 50 randomly-selected subjects in the test cohort.
The Allen Mouse Brain Common Coordinate Framework (CCFv3)14 was registered to the MouseIn space (Figure 1e), and its atlas labels were combined into gray matter (GM), white matter (WM), and cerebrospinal fluid (CSF) labels. These were then used as priors in constructing MouseIn tissue probability maps (TPMs, Figure 1f-h). Individual subject TPMs were created and averaged to produce the final MouseIn TPMs.
The T1-maps of all test subjects were nonlinearly registered to three templates: 1) the (de facto gold-standard) study-specific T1-map template, 2) the MouseIn T1-map template, and 3) the DSURQE T2w template. The DSURQE template was down-sampled to 150-micron isotropic voxel size, and the in vivo T1-maps were used to make the three templates as similar in resolution and contrast as possible.
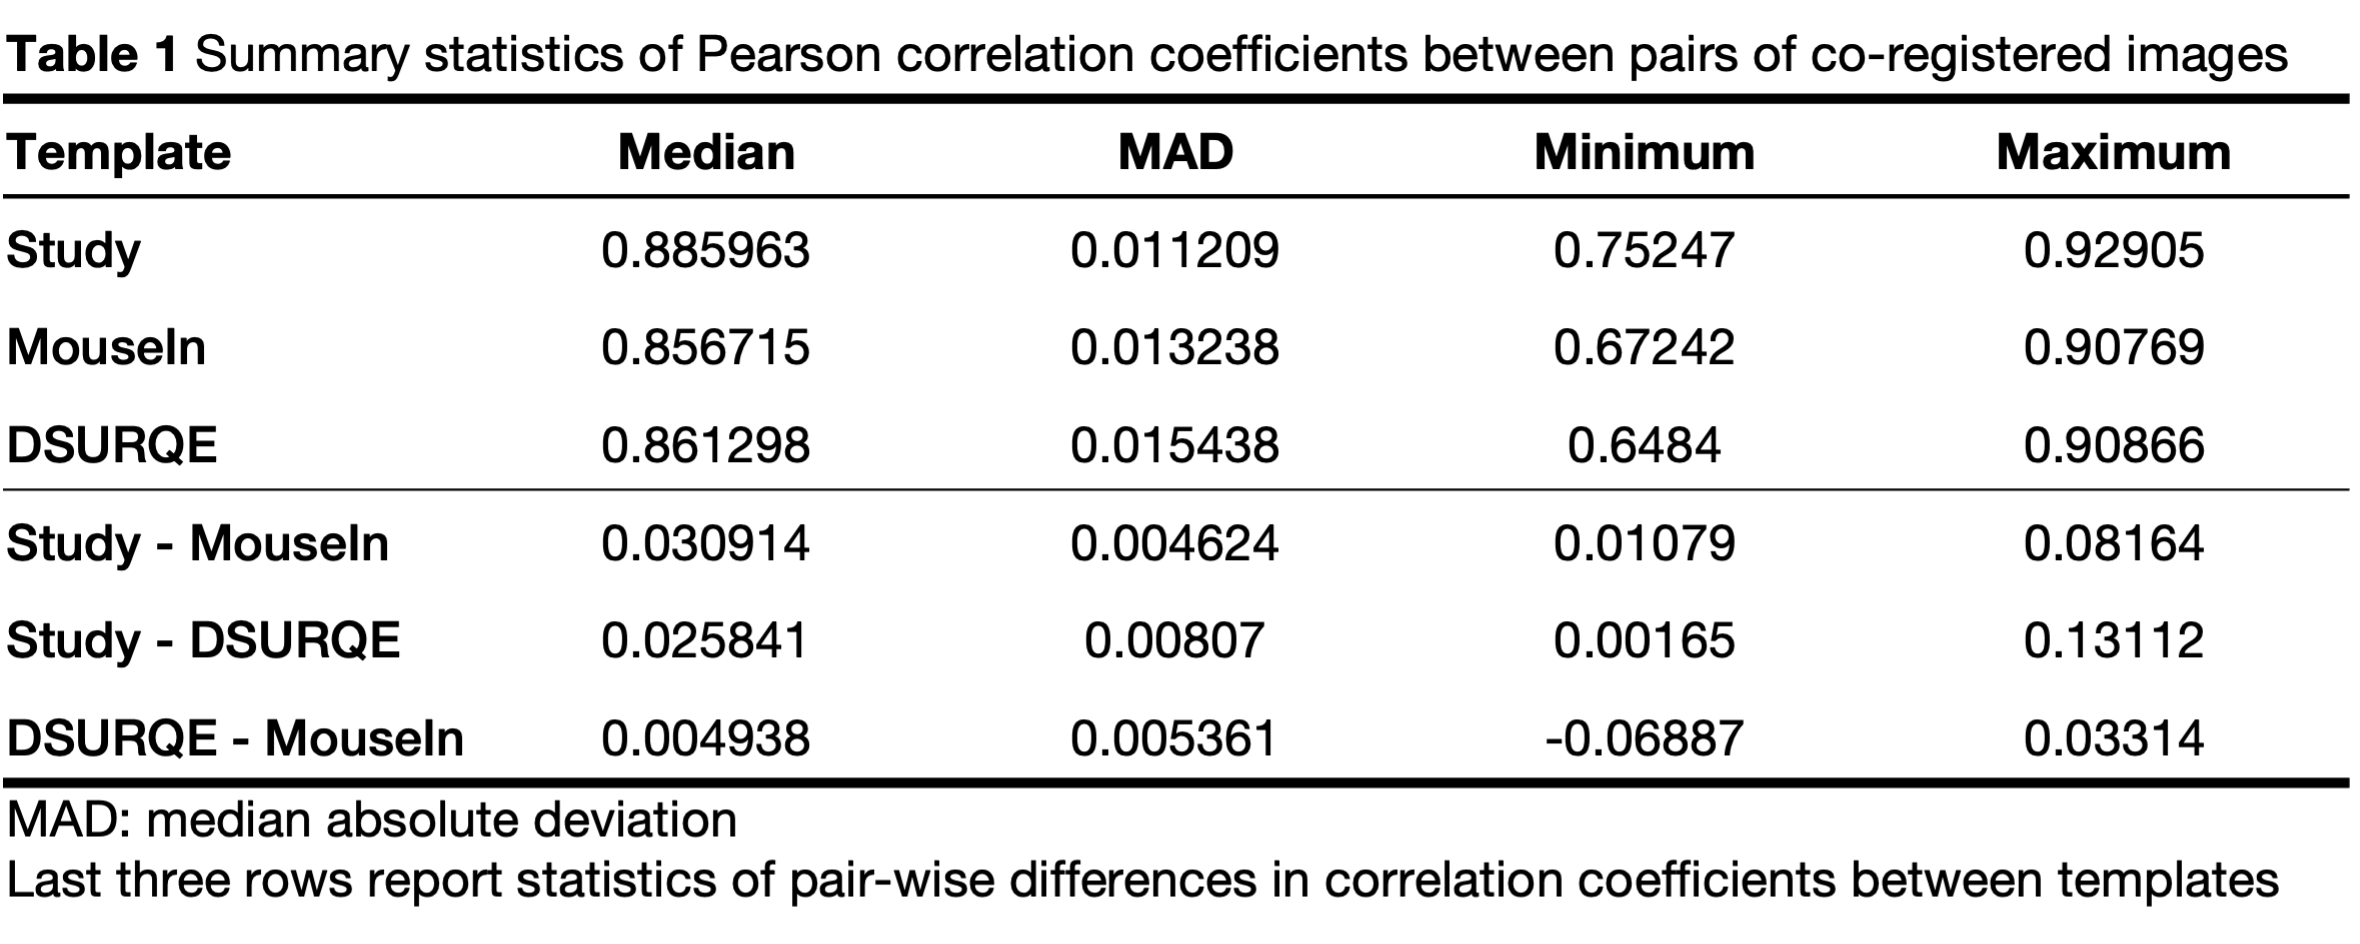
Pearson correlation coefficients (r) between co-registered images were calculated for all pairs of subjects to compare the quality of registration to the three templates.
Log-transformed Jacobian determinant maps of the nonlinear deformation fields were calculated, and nonparametric permutation testing was performed to compare Homs and WTs.
Results
An in vivo mouse template following FAIR principlesThe MouseIn template is available in multiple contrast options and includes a brain mask, TPMs, and modified and transformed CCFv3 labels. To comply with FAIR principles, all template resources are available from a persistent identifier (DOI:10.17605/OSF.IO/SZYQE), with filenames and in-depth meta-data inspired by Brain Imaging Data Structure (BIDS15) community standards. All resources are openly available under a Creative Commons Attribution-ShareAlike license.
Correlation between co-registered images
Generally, there were strong correlations between co-registered images for all three target templates (Figure 2a,b, Table 1). The correlations were lowest for Homs with severe hydrocephalus, a known phenotype observed in a subset of these mice16. This reflects the difficulty of co-registering two images with gross anatomical differences.
For each pair of subjects, r was highest for the study-specific template (Figure 2c, Table 1). While r values were generally slightly greater for the DSURQE template than the MouseIn, the correlations involving hydrocephalic mice were weakest for the DSURQE template (Figure 2d).
Group comparison of morphometric differences
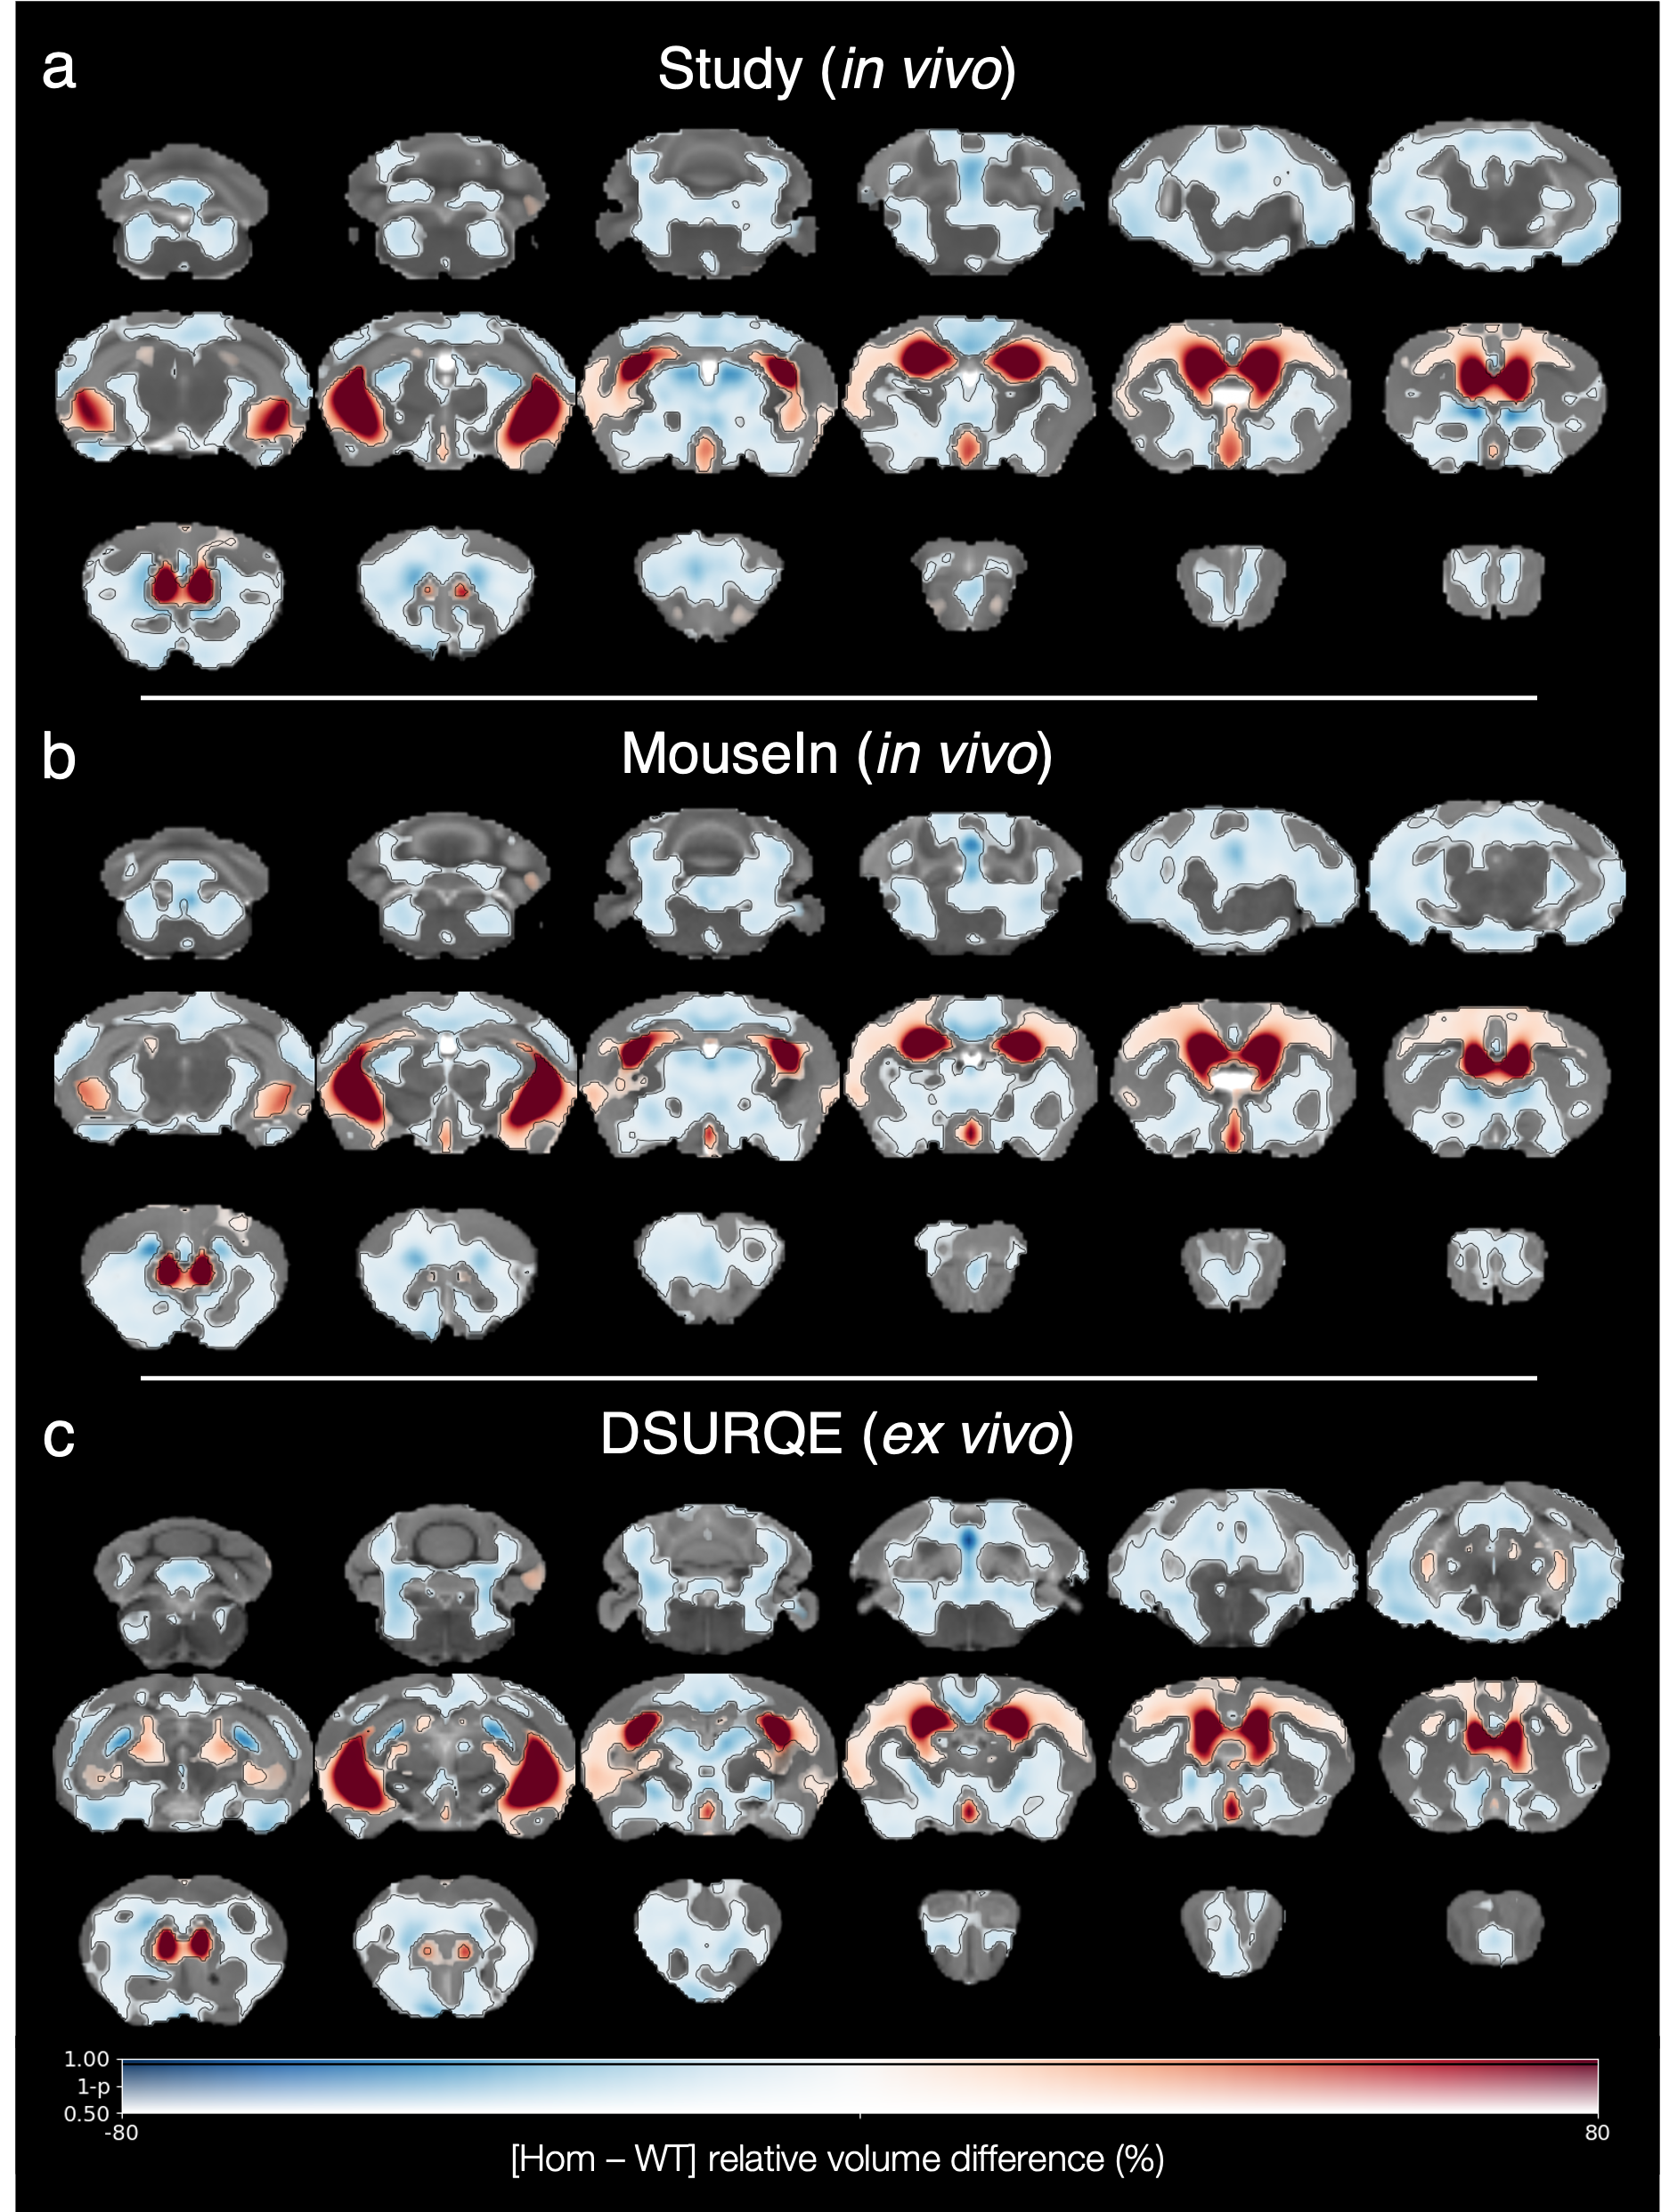
The morphometric differences between genotypes were largely consistent across all three templates: the Homs displayed enlargement of the lateral and third ventricles and widespread volume reduction elsewhere (Figure 3). However, there were subtle differences, particularly in the DSURQE results where fewer subcortical regions were affected by volume loss compared to the in vivo templates.
Discussion
High correlation between the intensities of two co-registered images is expected, and all templates provided median inter-subject correlations r > 0.85. Although MouseIn had a slightly lower median r than DSURQE, it also had lower variability because the correlations were higher for the severely hydrocephalic mice.Qualitative assessment of deformation-based morphometry analyses showed the results from the in vivo templates were more like each other than those from the ex vivo template. This was likely influenced by the in vivo templates being generated from the same image sequence and thus having similar image contrast, as well as by the effects of ex vivo tissue processing on brain morphology.
Reusability was a priority for MouseIn from its inception. For example, multiple contrasts facilitate application to an array of studies, while accessible license and provenance information support reuse, and consequently standardization, within the field.
Conclusion
The in vivo MouseIn template may be a more suitable alternative to pre-existing ex vivo templates for in vivo mouse neuroimaging studies.Acknowledgements
No acknowledgement found.References
Qiu LR, Fernandes DJ, Szulc-Lerch KU, et al. Mouse MRI shows brain areas relatively larger in males emerge before those larger in females. Nature communications. 2018 Jul 5;9(1):1-5.
Janke AL, Ullmann JF. (2015) Robust methods to create ex vivo minimum deformation atlases for brain mapping. Methods. 2015 Feb;73:18-26.
Janke AL, Ullmann J, Kurniawan N, et al. (2012) 15μm average mouse models in Waxholm space from 16.4T 30μm images. In 20th Annual ISMRM Scientific Meeting and Exhibition, Melbourne, Australia.
Johnson GA, Badea A, Brandenburg J, et al. Waxholm space: an image-based reference for coordinating mouse brain research. Neuroimage. 2010 Nov 1;53(2):365-72.
Ma Y, Smith D, Hof PR, et al. In vivo 3D digital atlas database of the adult C57BL/6J mouse brain by magnetic resonance microscopy. Frontiers in neuroanatomy. 2008 Apr 17;2:1.
Lerch JP, Gazdzinski L, Germann J, Sled JG, Henkelman RM, Nieman BJ. Wanted dead or alive? The tradeoff between in-vivo versus ex-vivo MR brain imaging in the mouse. Frontiers in neuroinformatics. 2012 Mar 23;6:6.
Ma D, Holmes HE, Cardoso MJ, et al. Study the longitudinal in vivo and cross-sectional ex vivo brain volume difference for disease progression and treatment effect on mouse model of tauopathy using automated MRI structural parcellation. Frontiers in neuroscience. 2019 Jan 24;13:11.
Holmes HE, Powell NM, Ma D, et al. Comparison of in vivo and ex vivo MRI for the detection of structural abnormalities in a mouse model of tauopathy. Frontiers in neuroinformatics. 2017 Mar 31;11:20.
Yoon U, Fonov VS, Perusse D, Evans AC, Brain Development Cooperative Group. The effect of template choice on morphometric analysis of pediatric brain data. Neuroimage. 2009 Apr 15;45(3):769-77.
Avants BB, Yushkevich P, Pluta J, et al. The optimal template effect in hippocampus studies of diseased populations. Neuroimage. 2010 Feb 1;49(3):2457-66.
Wilkinson MD, Dumontier M, Aalbersberg IJ, et al. The FAIR Guiding Principles for scientific data management and stewardship. Scientific data. 2016 Mar 15;3(1):1-9.
Ciric R, Thompson WH, Lorenz R, et al. TemplateFlow: FAIR-sharing of multi-scale, multi-species brain models. Biorxiv. 2021 Aug 26.
White MA, Kim E, Duffy A, et al. TDP-43 gains function due to perturbed autoregulation in a Tardbp knock-in mouse model of ALS-FTD. Nature neuroscience. 2018 Apr;21(4):552-63.
Wang Q, Ding SL, Li Y, et al. The Allen Mouse Brain Common Coordinate Framework: A 3D Reference Atlas. Cell. 2020 May 14;181(4):936-953.e20.
Gorgolewski KJ, Auer T, Calhoun VD, et al. The brain imaging data structure, a format for organizing and describing outputs of neuroimaging experiments. Scientific data. 2016 Jun 21;3(1):1-9.
Lin Z, Kim E, Ahmed M, et al. MRI-guided histology of TDP-43 knock-in mice implicates parvalbumin interneuron loss, impaired neurogenesis and aberrant neurodevelopment in amyotrophic lateral sclerosis-frontotemporal dementia. Brain communications. 2021;3(2):fcab114.
Figures