2011
Multimodal high-resolution mapping of subcortical regions in the macaque monkey revealed by combined MAP-MRI and histology1Neuroscience, Center for Neuroscience and Regenerative Medicine (CNRM), Henry M. Jackson Foundation (HJF) for the Advancement of Military Medicine, Bethesda, MD 20817; Section on Quantitative Imaging and Tissue Sciences (SQITS), Eunice Kennedy Shriver National Institute of Child Health and Human Development (NICHD), NIH, Bethesda, MD 20892, Bethesda, MD, United States, 2Scientific and Statistical Computing Core, Scientific and Statistical Computing Core, National Institute of Mental Health (NIMH), Bethesda, MD 20892, Bethesda, MD, United States, 3Section on Quantitative Imaging and Tissue Sciences (SQITS), Center for Neuroscience and Regenerative Medicine (CNRM), Henry M. Jackson Foundation (HJF) for the Advancement of Military Medicine, Bethesda, MD 20817; Section on Quantitative Imaging and Tissue Sciences (SQITS), Eunice Kennedy Shriver National Institute of Child Health and Human Development (NICHD), NIH, Bethesda, MD 20892, Bethesda, MD, United States
Synopsis
Despite its essential use as a model for neurological disorders in humans, the rhesus macaque lacks a comprehensive MRI-histology-based segmentation of subcortical regions. Here, we mapped the subcortical regions in the macaque monkey using MAP-MRI, and postmortem histology of the same brain. Our results demonstrate that, at high spatial resolution, MAP-MRI can distinguish a large number of gray and white matter structures in deep brain areas. The ability to delineate and validate these in a given subject is useful for neurosurgical planning and navigation of implantable devices to potential targets for deep brain stimulation in the macaque model of neurological or psychiatric disorders.
INTRODUCTION
The subcortical regions are known to play an important role in the regulation of the central and peripheral nervous systems. It can be difficult to identify and delineate many of these subcortical nuclei and their finer subdivisions using conventional MRI due to their small size, buried location, and often subtle contrast compared to neighboring tissue. To address this problem, we combine high-resolution mean apparent propagator (MAP)-MRI 1,2 obtained at 7T and five histological stains imaged with high-resolution microscopy in the same brain to map the location, boundaries, and microarchitectural features of subcortical nuclei and associated white matter pathways of the macaque monkey.METHODS
We scanned an adult perfusion-fixed rhesus monkey brain on a 7T scanner using MAP-MRI with 200 μm resolution. We acquired a total of 112 diffusion-weighted images with multiple b-values (bmax=10000s/mm2), pulse duration δ=6ms, and diffusion time Δ=28ms. In each voxel, we estimated the MAP and computed microstructural DTI/MAP parameters: fractional anisotropy (FA); mean, axial, and radial diffusivities (MD, AD, and RD, respectively); propagator anisotropy (PA), non-gaussianity (NG), return-to-origin probability (RTOP), return-to-axis probability (RTAP), and return-to-plane probability (RTPP), along with the fiber orientation distribution functions (fODFs) 3. The MT ratio (MTR) was computed from the images acquired with and without MT preparation.Following MRI acquisition, the brain specimen was prepared for histological processing with five different stains as follows. An alternating series of 50 μm thick coronal sections were processed with Nissl, Acetylcholinesterase (AchE), or immunohistochemically with antibodies against parvalbumin, neurofilament protein (SMI-32), and choline acetyltransferase (ChAT). The high-resolution images of these different cell bodies and fiber stained sections were then manually registered to corresponding maps of MAP-MRI parameters to allow analysis in histologically-defined regions 4 in basal ganglia, thalamus, hypothalamus, amygdala, brainstem, and cerebellum.
RESULTS
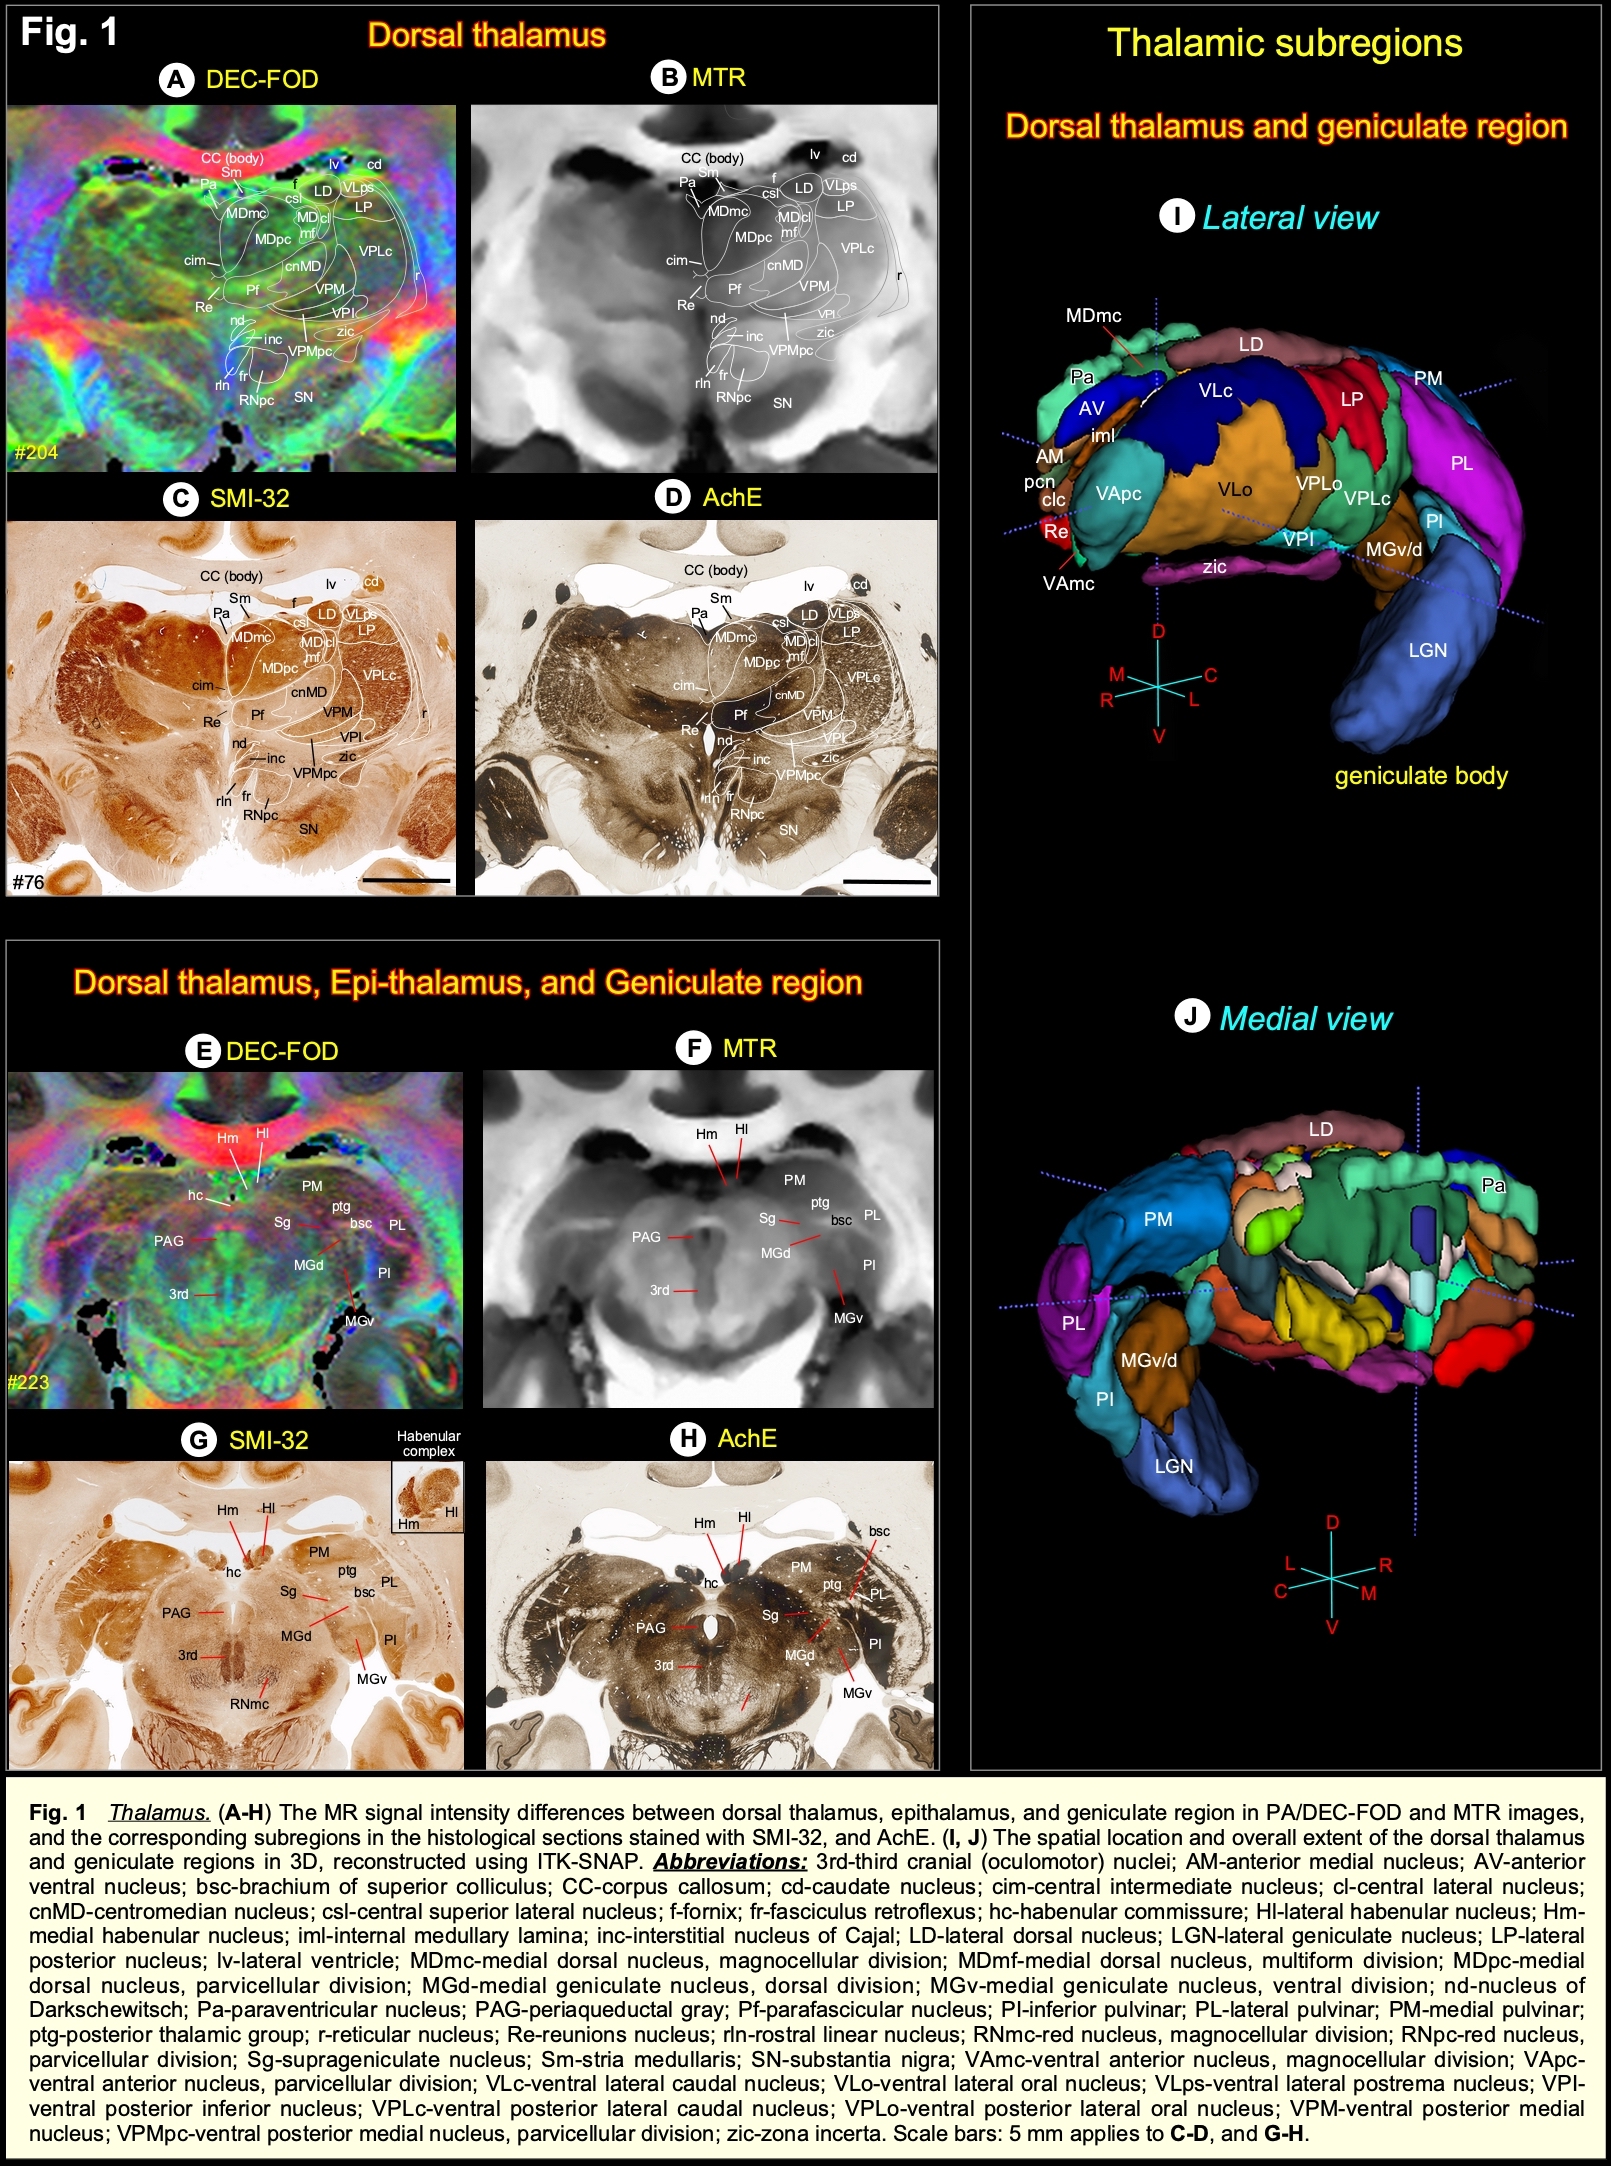
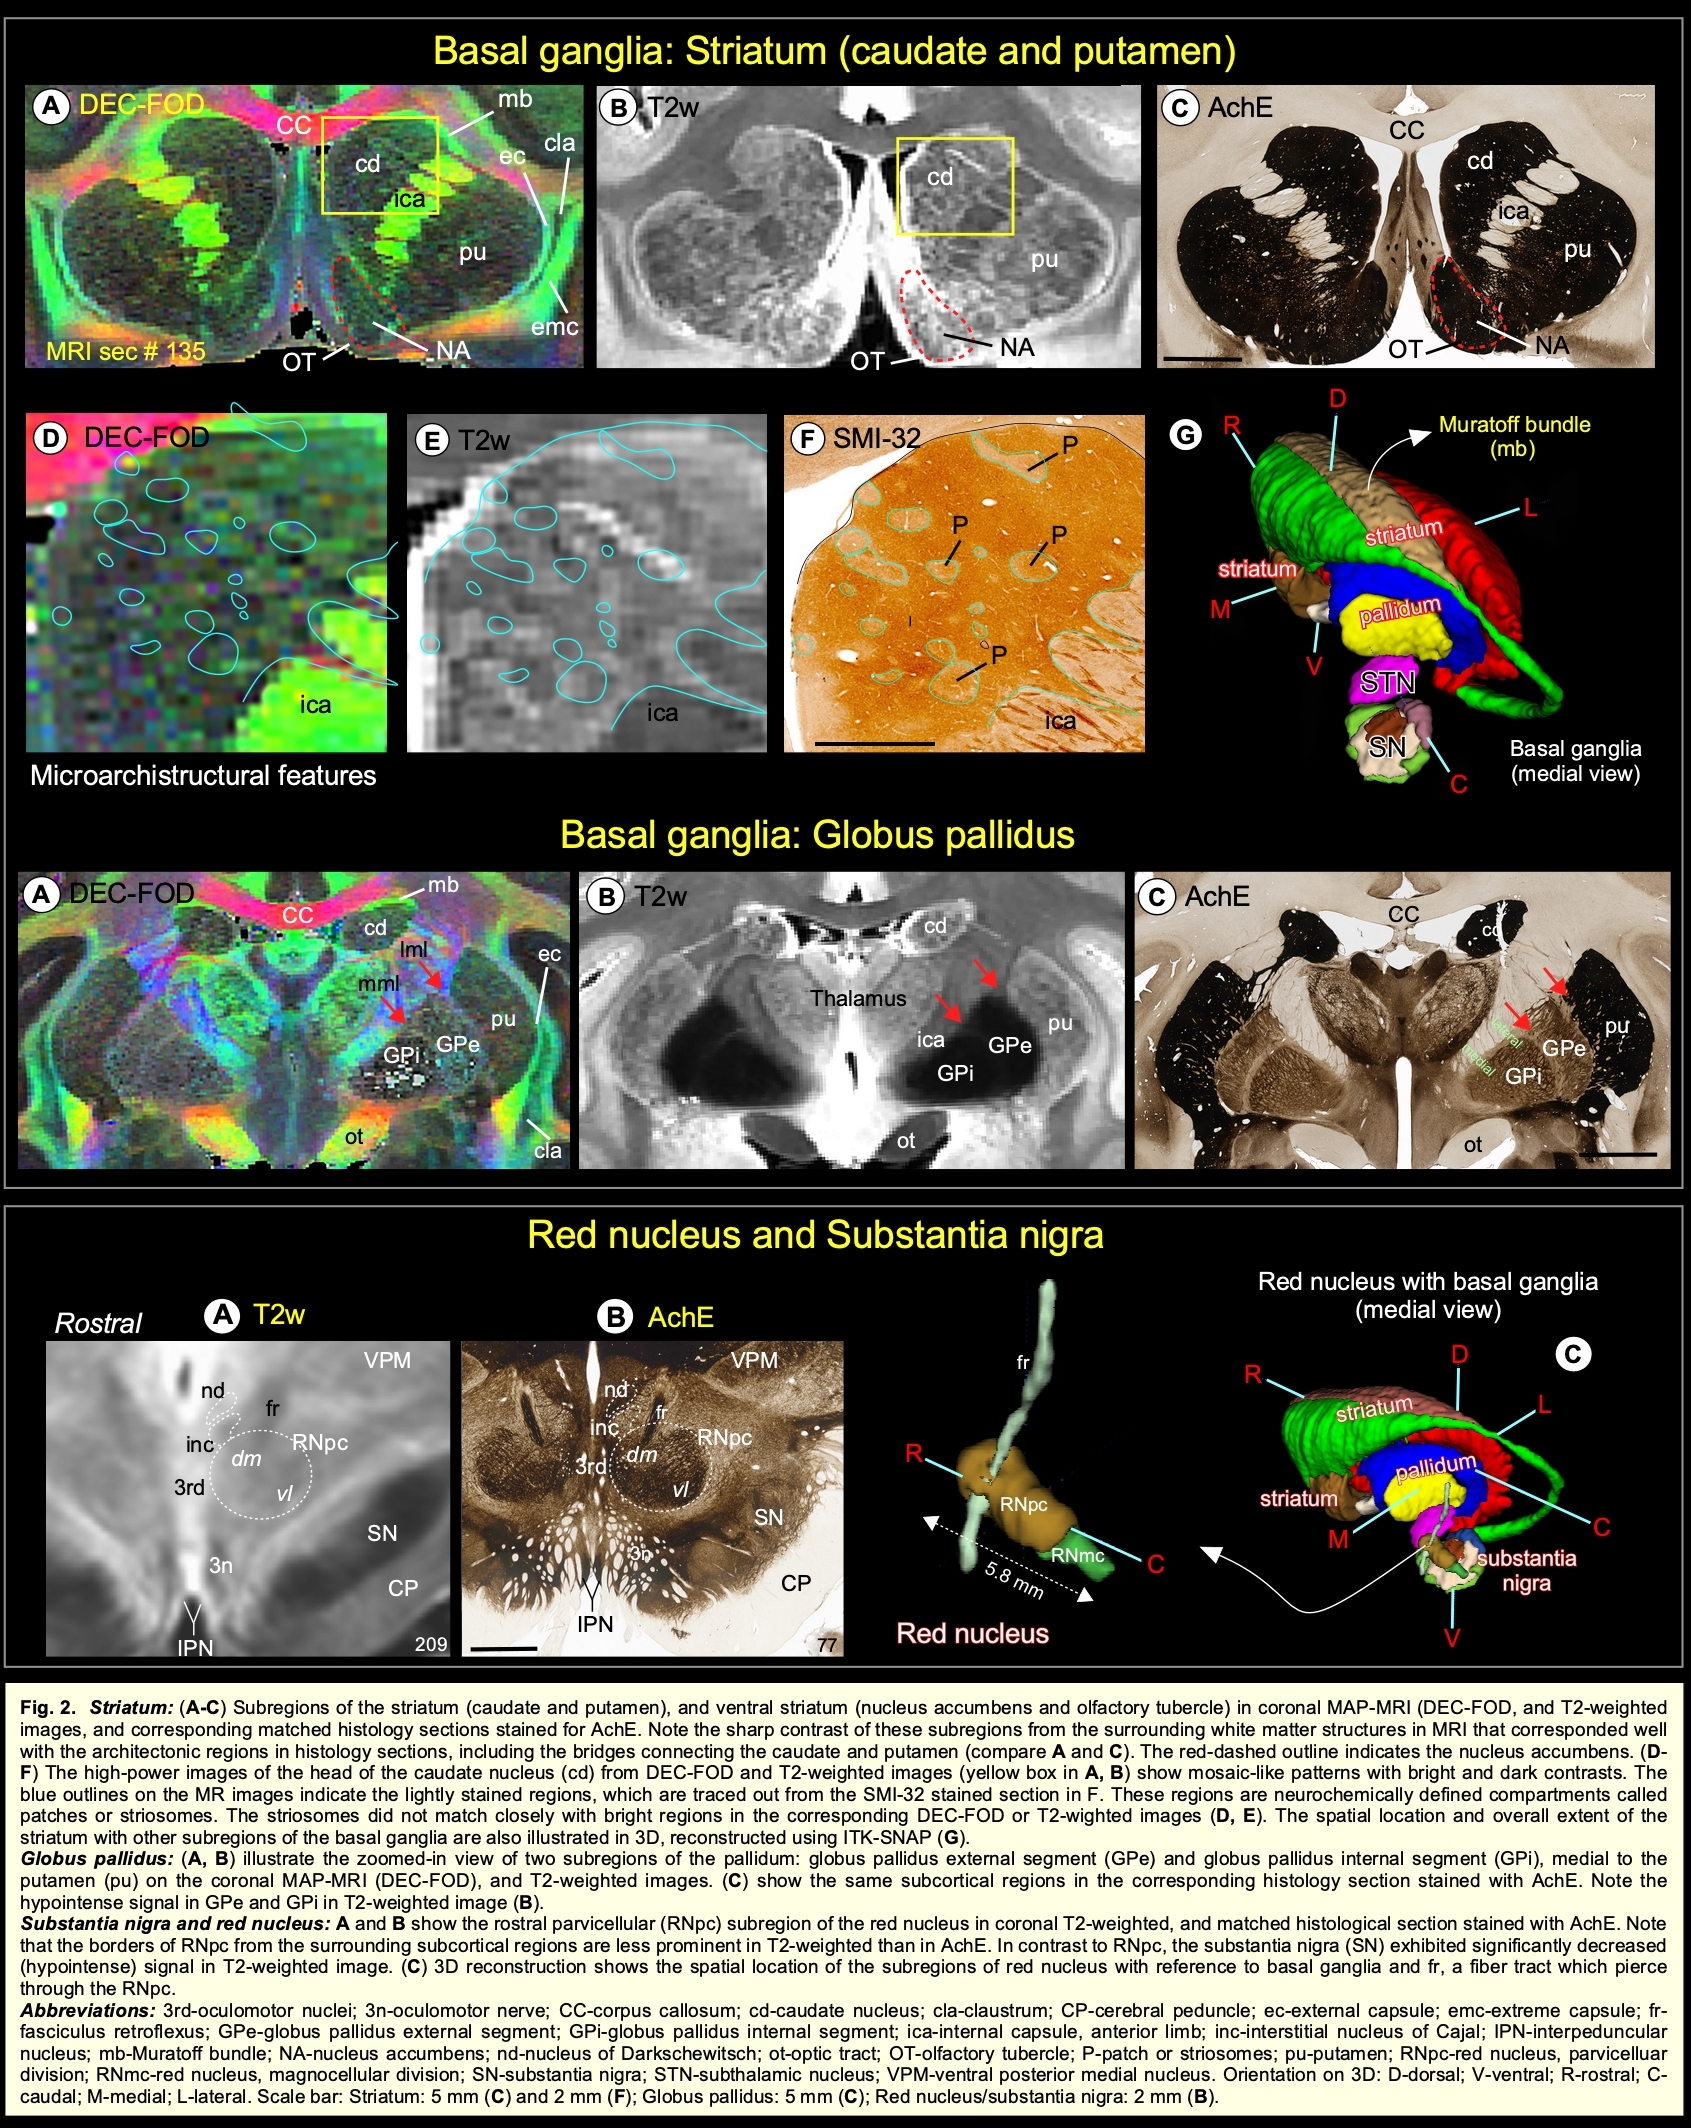
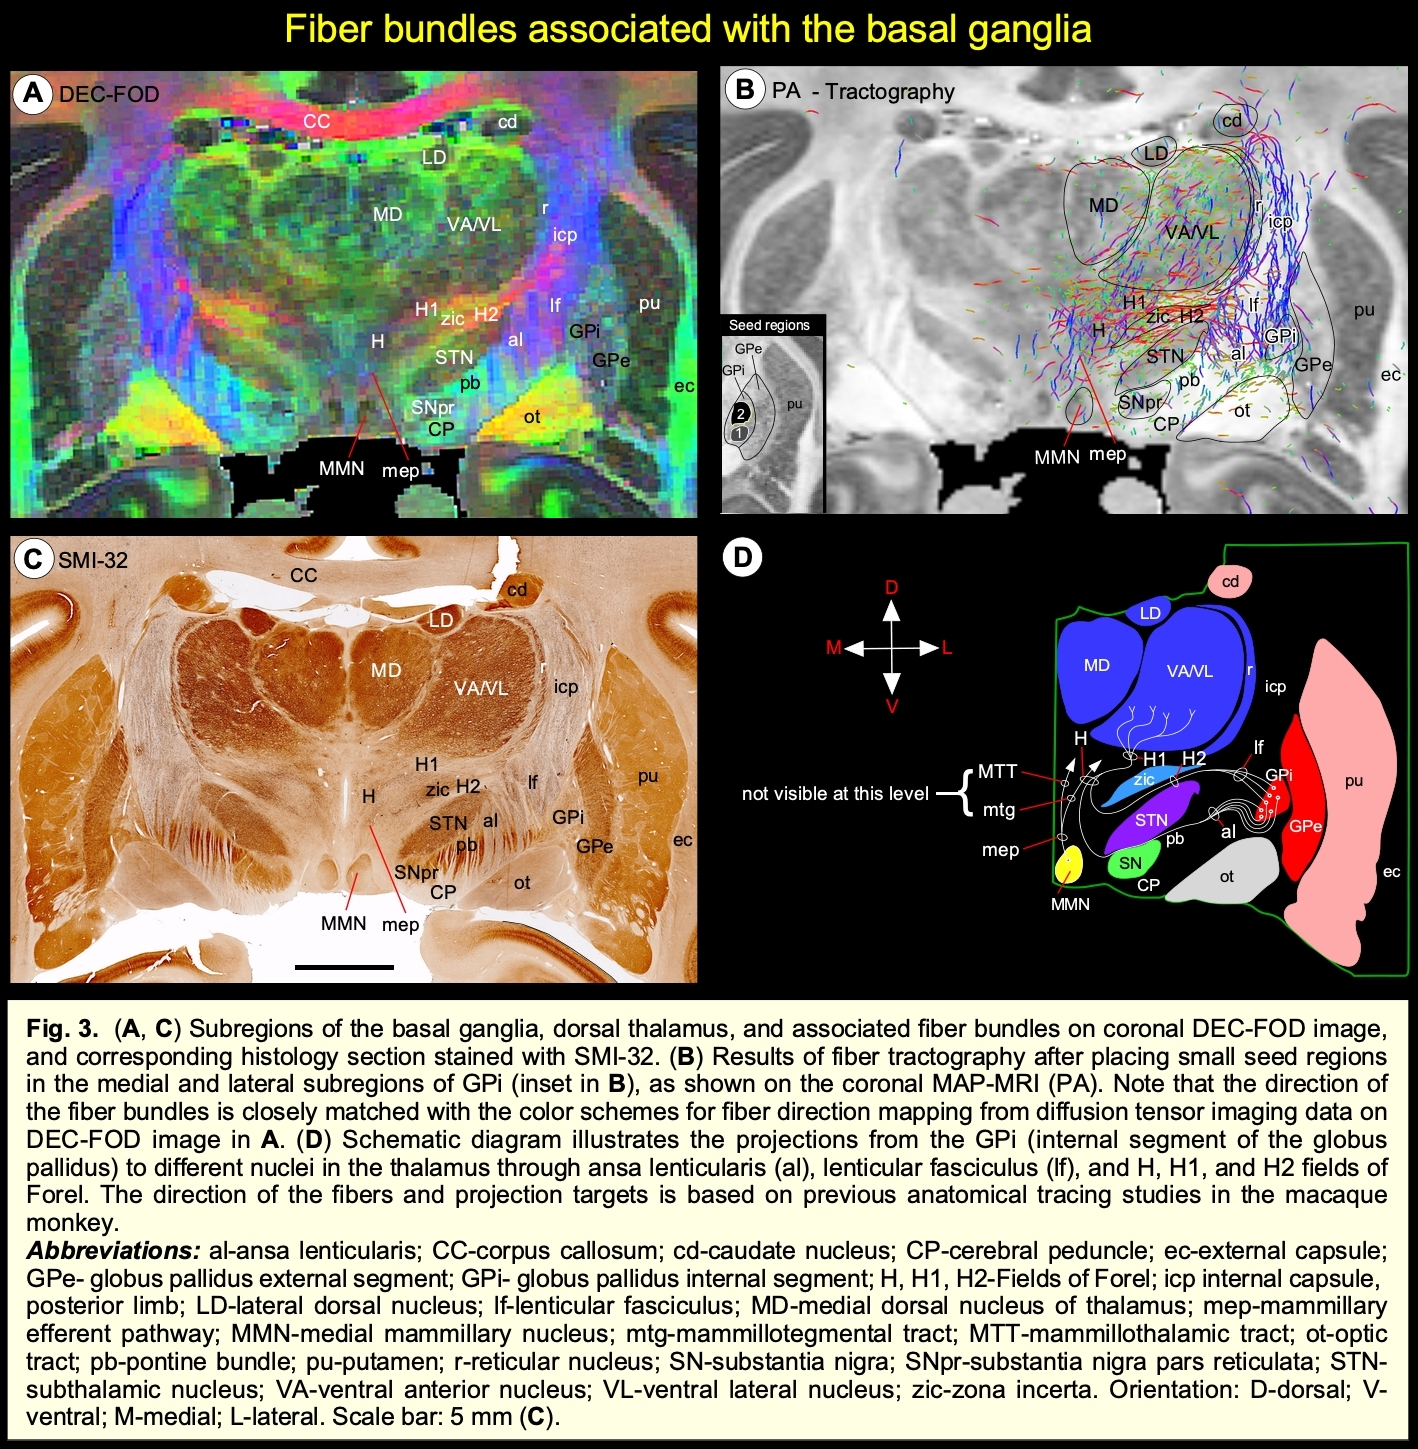
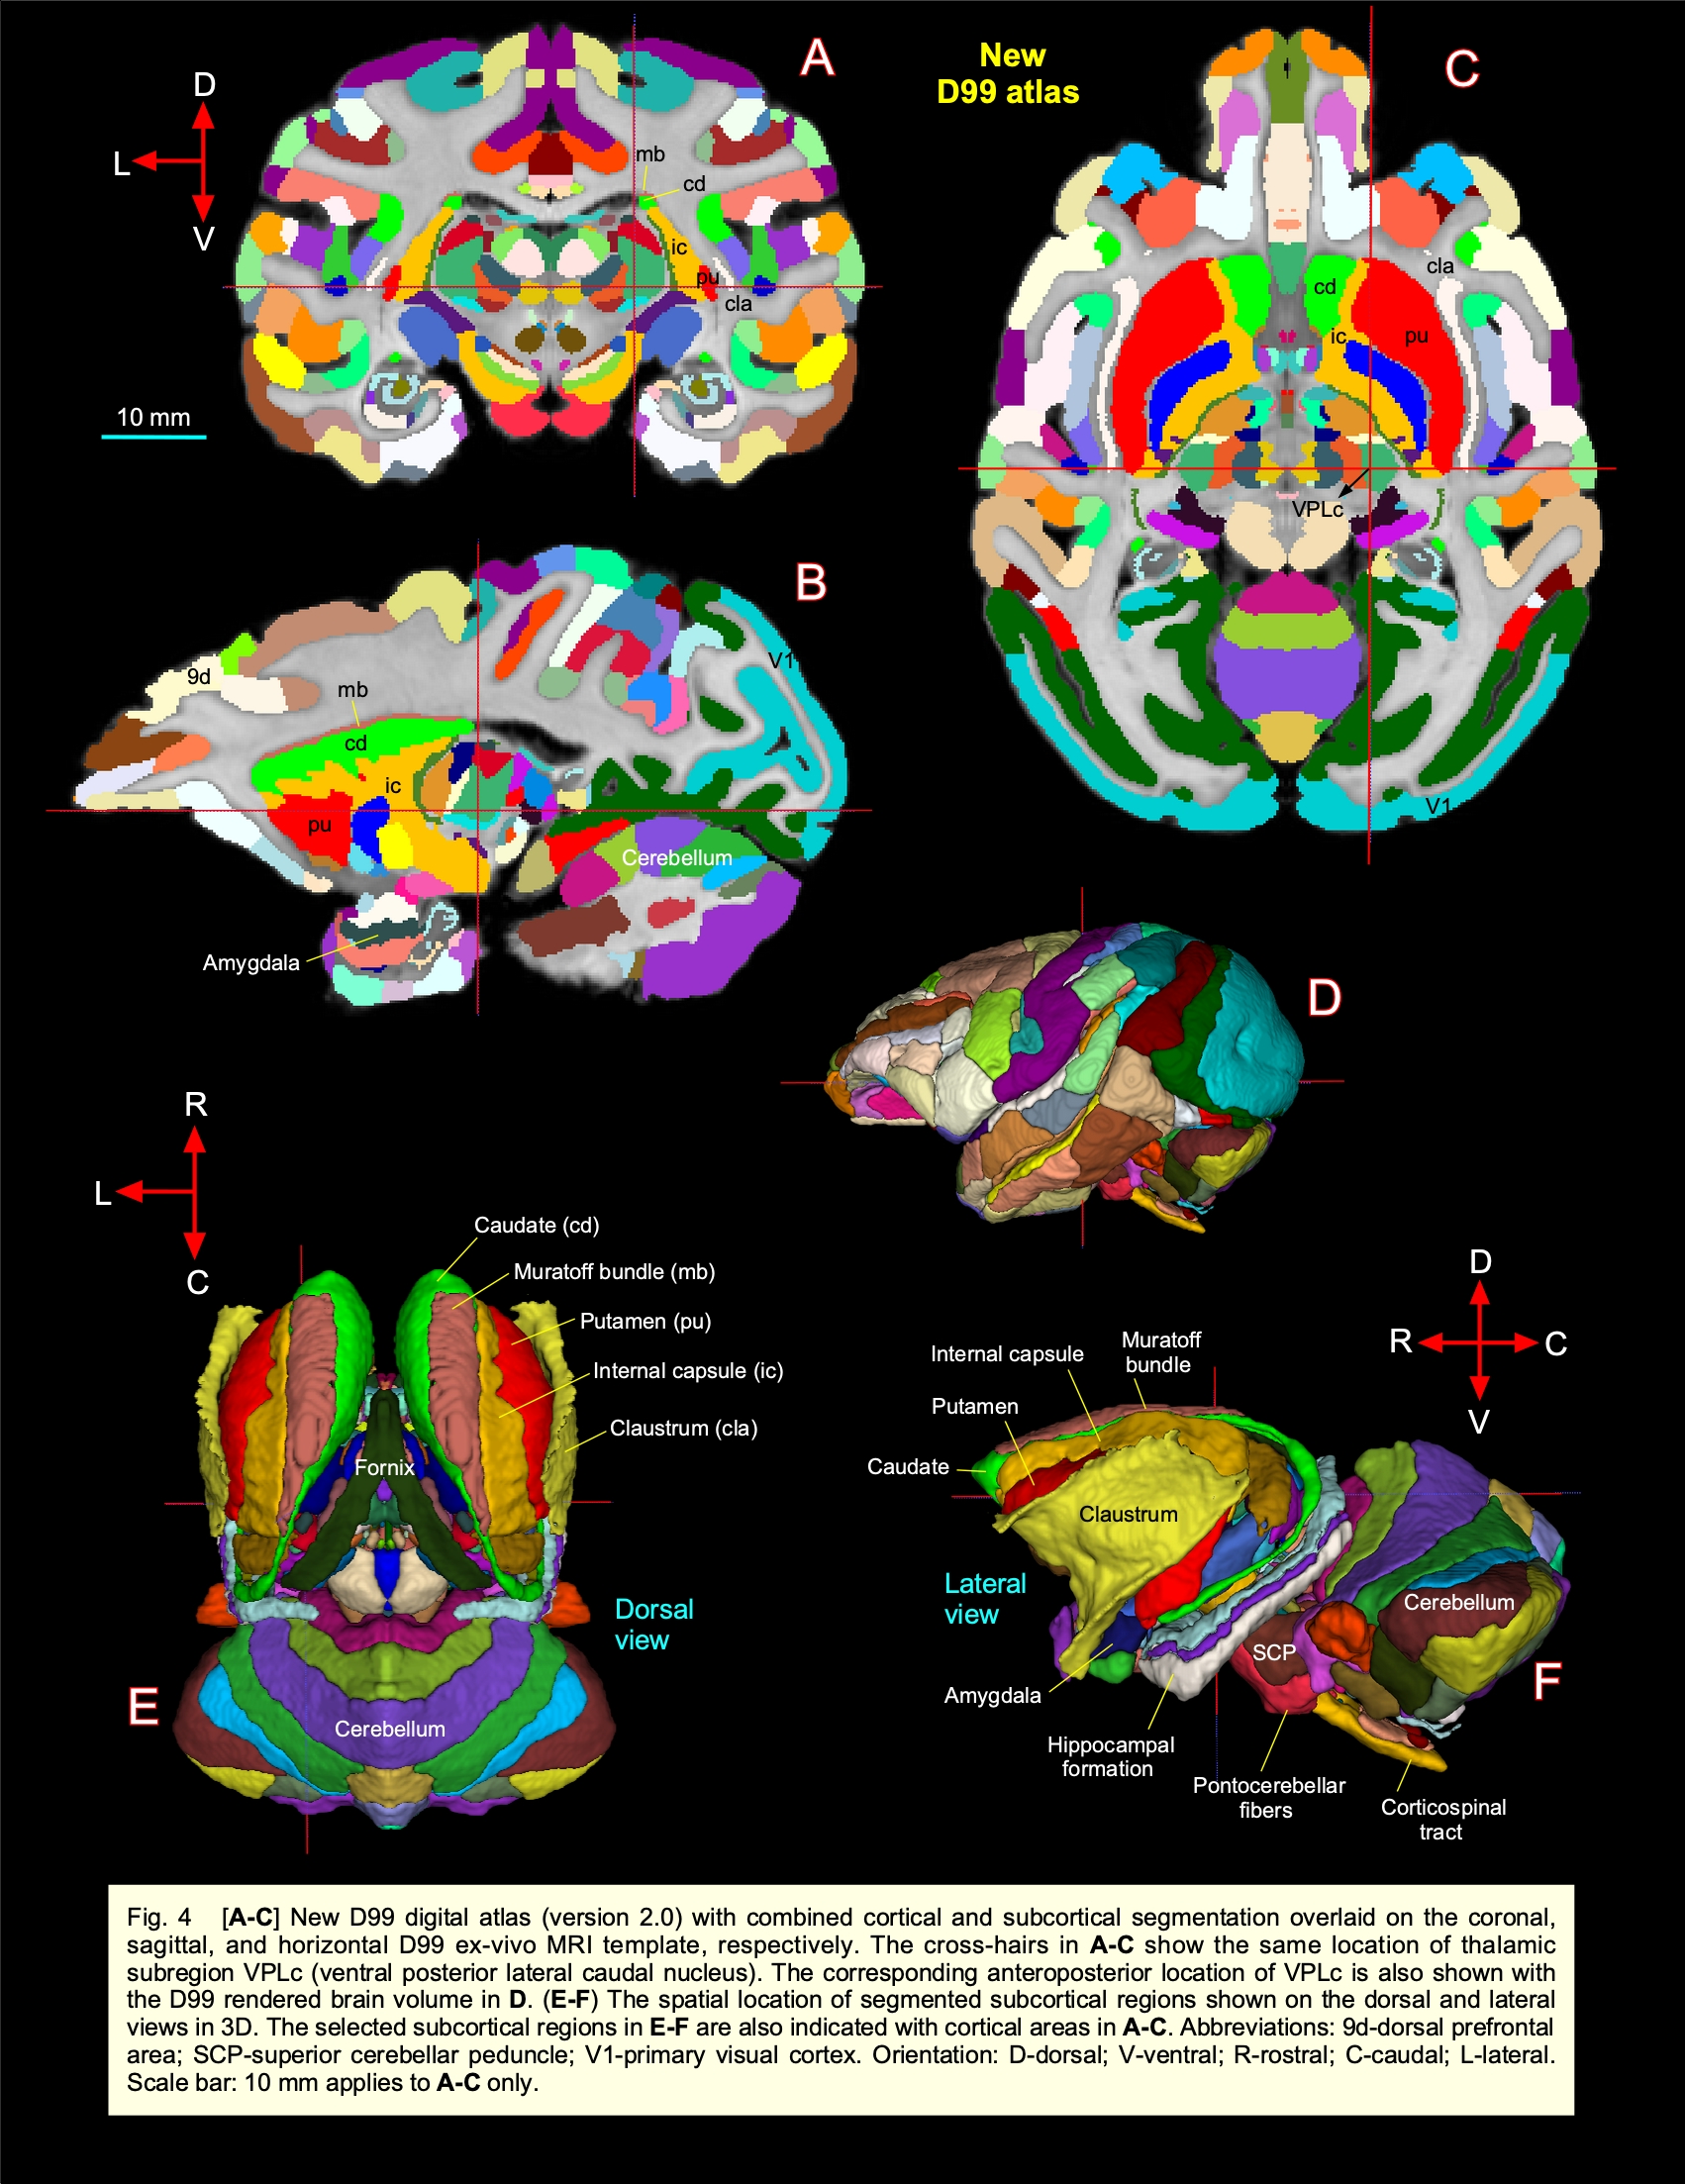
DTI/MAP-MRI and other MRI parameters showed different gray and white matter contrast outside the cerebral cortex. In particular, PA or PA with fiber orientation distribution functions (fODFs) and the corresponding direction encoded color (DEC) map 5, RD, NG, RTAP, as well as T2-weighted and MTR images revealed sharp boundaries and high contrast in the deep brain structures, resulting in a clear demarcation of anatomical structures such as nuclei, and fiber tracts in subcortical regions. We delineate many sub-nuclei in the dorsal thalamus, epithalamus, and geniculate region (e.g., Fig. 1; LD-lateral dorsal, MD-mediodorsal, VPI/VPM-ventral posterior inferior and medial nuclei, cnMD-centromedian, PL/PM-lateral and medial pulvinar, MGd/v-medial geniculate regions, Hm/Hl-habenular nuclei); subregions of basal ganglia/red nucleus (Fig. 2; cd-caudate, pu-putamen, GP-globus pallidus, SN-substantia nigra, STN-subthalamic nucleus), and associated fiber tracts (Fig. 3; al-ansa lenticularis, lf-lenticular fasciculus, and Forel’s H Field) that link basal ganglia with specific sub-nuclei in the thalamus. All qualitative findings observed in MRI were confirmed using matched histological sections with multiple stains. Moreover, the anatomical details that are evident in MAP-MRI parameters are invisible in conventional T1-weighted MRI.We also created a subcortical atlas from the segmented subcortical regions and registered it to a standard D99 cortical template 6, thereby integrating the segmentation of both cortical and subcortical areas into the same 3D volume (Fig. 4). This new atlas is designed to provide a practical standard template for macaque neuroanatomical, functional, and connectional imaging studies. Finally, we demonstrate how to apply the updated D99 atlas to estimate the histological boundaries of cortical and subcortical areas in multiple in vivo macaque MRI datasets. The current atlas, template MRI data sets, surfaces, and user scripts for aligning individual subjects to this template are publicly available.
DISCUSSION
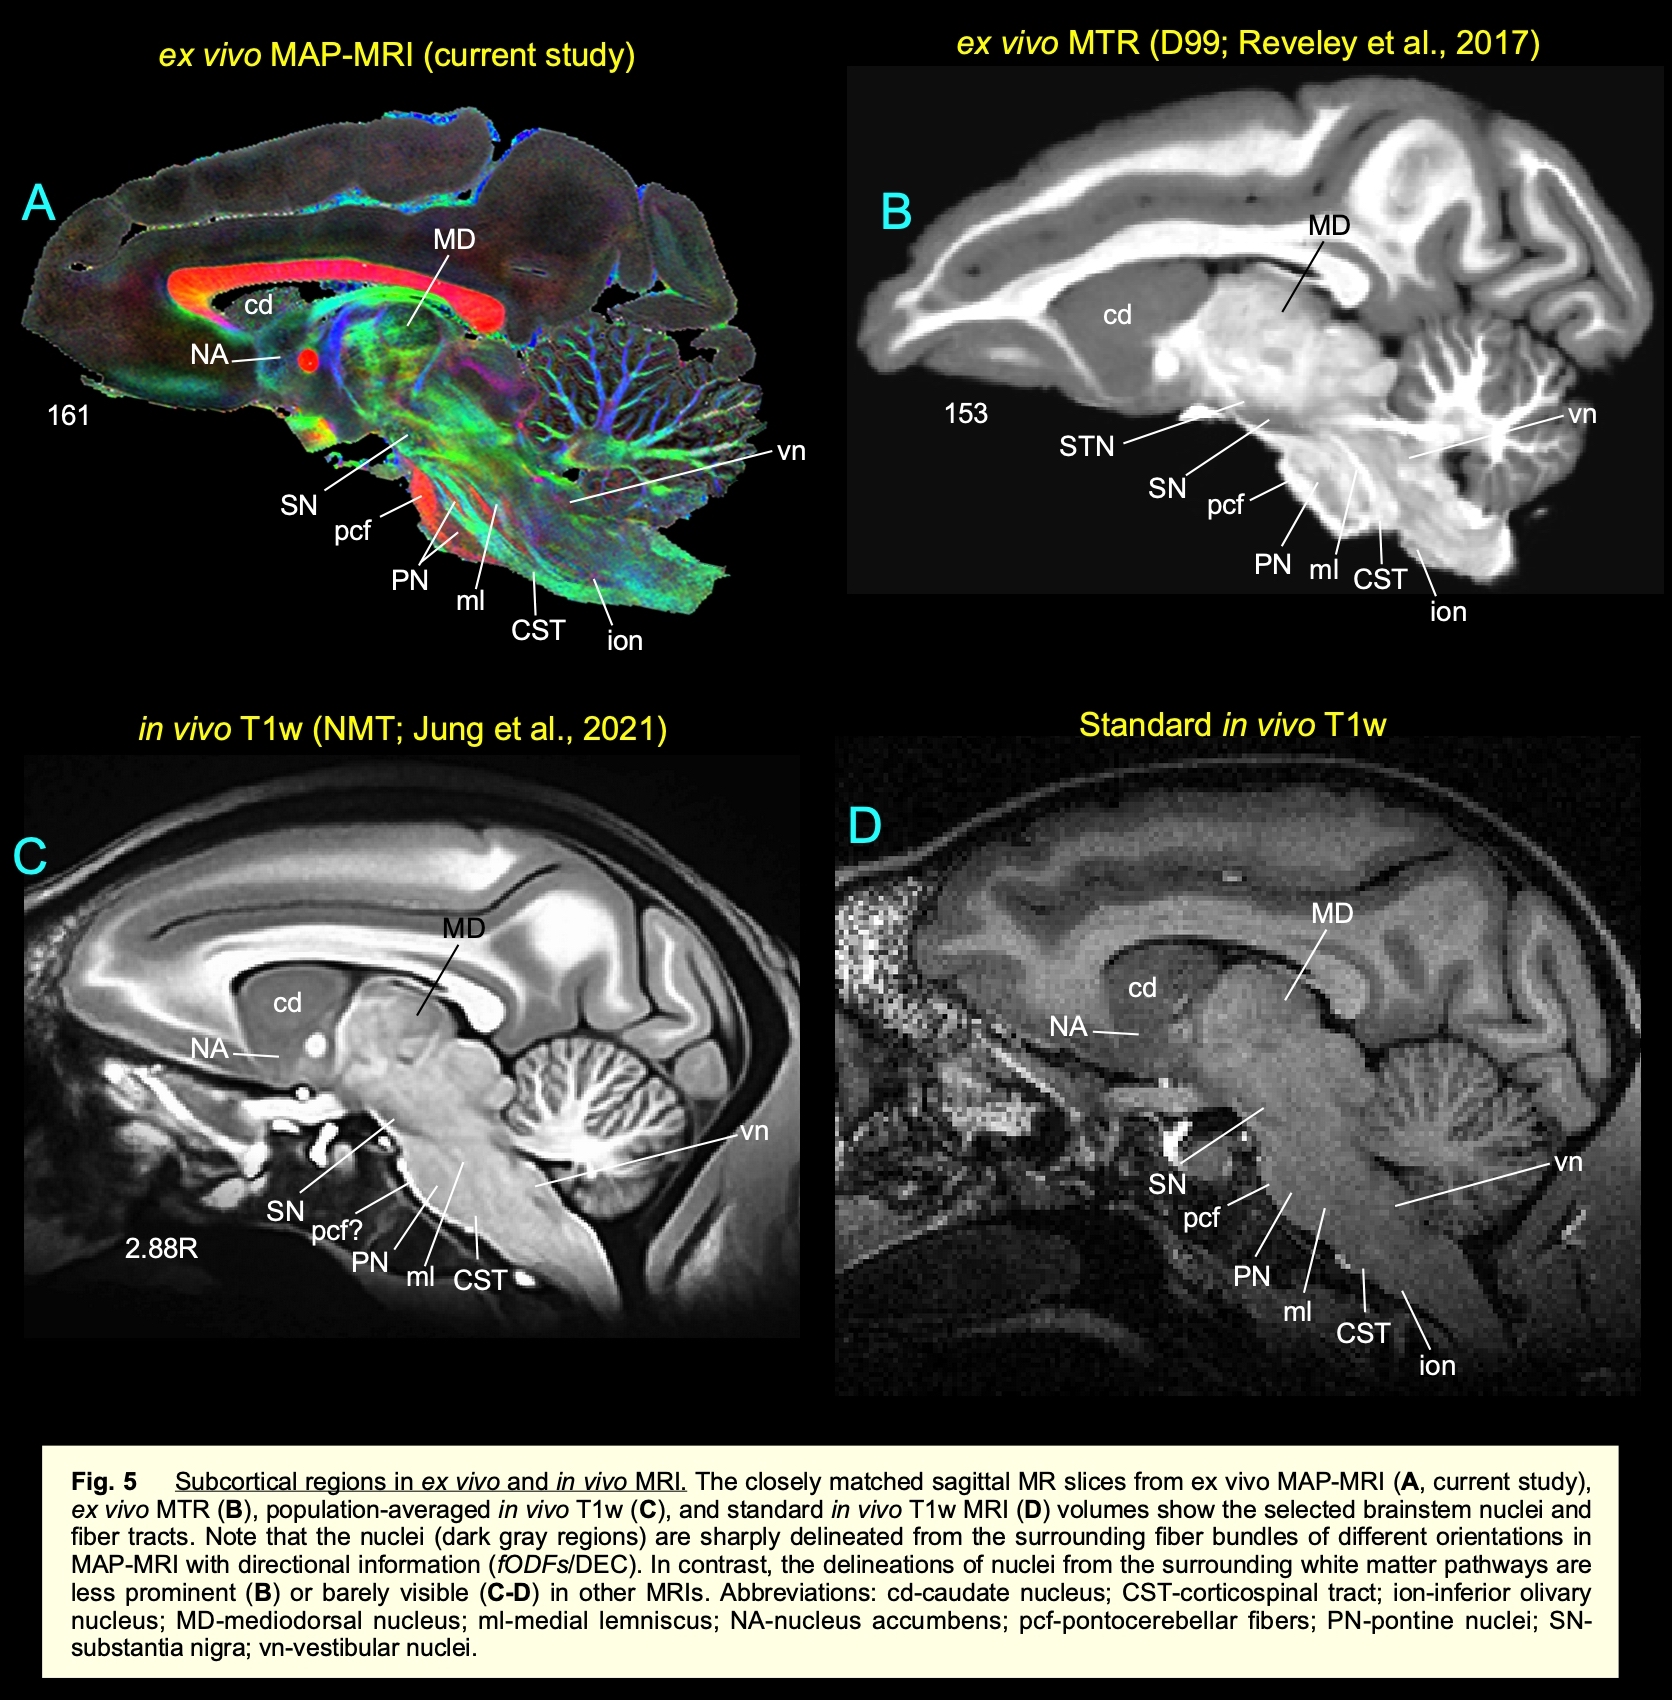
High-resolution DTI/MAP-MRI provides new microstructural parameters and directional information (fODFs/DEC) that can complement multiple histological stains. Collectively, these are crucial in delineating nuclei and fiber tracts of different sizes and orientations in the deep brain structures (e.g., pontocerebellar fibers from the pyramidal tract, medial lemniscus, and pontine nuclei; Fig. 5). Many deep brain targets and their subregions are less prominent or spatially not distinguishable from neighboring structures with a single MRI parameter, or a population-averaged anatomical MRI volume (see Fig. 5) 7. The most important unique feature of this study is the strict adherence to an MRI scan with adjacent and matched histology sections from the same brain. As a result, the alignment accuracy between the areal boundaries and the gross anatomical features is optimized for the identification of regions-of-interest in this brain specimen (e.g., Figs. 1-3). Our high-dimensional DTI/MAP parameters and T2w images also revealed microarchitectural details within the subcortex (e.g., striatum; Fig. 2) that can be comparable to the neurochemically defined compartments called Patch/striosomes and matrix 8,9. The locations of some of the gray and white matter regions in macaque monkeys are comparable to those in humans 10, 11. Taken together, the MAP-MRI enables the construction of high-resolution atlases of deep brain structures that could improve neurosurgical navigation and electrode placement in DBS studies with macaque models of psychiatric or neurological disorders.CONCLUSION
The high-resolution mapping of subcortical regions using MAP-MRI combined and correlated with histology can elucidate structures that were previously invisible radiologically, providing a readily usable anatomical standard for region definition of subcortical targets in human and non-human primates. This multi-modal mapping offers a roadmap towards identifying salient brain areas in vivo in future neuroradiological studies.Acknowledgements
This work was supported by the Intramural Research Program of the Eunice Kennedy Shriver National Institute of Child Health and Human Development, the Intramural Research Program of the National Institute of Neurological Disorders and Stroke, “Connectome 2.0: Developing the next generation human MRI scanner for bridging studies of the micro-, meso- and macro-connectome”, NIH BRAIN Initiative 1U01EB026996-01 and the CNRM Neuroradiology/Neuropathology Correlation/Integration Core, 309698-4.01-65310, (CNRM-89-9921). We thank the Microscope Imaging Core (MIC) at NICHD and NIMH for help with the high-resolution imaging of histology sections.References
1. Özarslan E, Koay CG, Shepherd TM, Komlosh ME, İrfanoğlu MO, Pierpaoli C, Basser PJ. (2013), Mean apparent propagator (MAP) MRI: a novel diffusion imaging method for mapping tissue microstructure. NeuroImage. 2013; 78:16-32.
2. Avram A, Sarlls JE, Barnett AS, Özarslan E, Thomas C, Irfanoglu MO, Hutchinson E, Pierpaoli C, Basser PJ. Clinical feasibility of using mean apparent propagator (MAP) MRI to characterize brain tissue microstructure. NeuroImage. 2016; 127:422-434.
3. Tournier JD, Calamante F, Connelly, A. MRtrix: diffusion tractography in crossing fiber regions. International journal of imaging systems and technology. 2012; 22:53-66.
4. Saleem KS, Logothetis NK. A combined MRI and histology atlas of the rhesus monkey brain in stereotaxic coordinates. 2012; Academic Press.
5. Pajevic S, Pierpaoli C. Color schemes to represent the orientation of anisotropic tissues from diffusion tensor data: application to white matter fiber tract mapping in the human brain. Magn Reson Med.1999; 42:526-540.
6. Reveley C, Gruslys A, Ye FQ, Glen D, Samaha J, Russ BE, Saad Z, Seth AK, Leopold DA, Saleem KS. Three-Dimensional Digital Template Atlas of the Macaque Brain. Cereb Cortex. 2017; 27:4463-4477.
7. Jung B, Taylor PA, Seidlitz J, Sponheim C, Perkins P, Ungerleider LG, Glen D, Messinger A. A comprehensive macaque fMRI pipeline and hierarchical atlas. Neuroimage. 2021; 235:117997.
8. Brimblecombe KR, Cragg SJ. The Striosome and Matrix Compartments of the Striatum: A Path through the Labyrinth from Neurochemistry toward Function. ACS Chem Neurosci. 2017; 8:235-242.
9. Crittenden JR, Graybiel AM. Basal Ganglia disorders associated with imbalances in the striatal striosome and matrix compartments. Front Neuroanat. 2011; 5: 59.
10. Straub S, Benjamin R, Knowles BR, Flassbeck S, Steiger R, Ladd ME, Gizewski ER. Mapping the human brainstem: Brain nuclei and fiber tracts at 3 T and 7 T. NMR in Biomedicine. 2019; 32:e4118.https://doi.org/10.1002/nbm.4118.
11. Tang Y, Sun W, Toga AW, Ringman JM, Shi Y. A probabilistic atlas of human brainstem pathways based on connectome imaging data. Neuroimage. 2018; 169:227-239.
Figures