2008
Dual Mode Acousto-optic RF Safety Sensor for Electric Field and Temperature Measurement at 1.5T MRI1Mechanical Engineering, Georgia Institute of Technology, ATLANTA, GA, United States, 2Division of Intramural Research, National Heart Lung and Blood Institute, National Institutes of Health, Bethesda, MD, United States, 3Institute of Biomedical Engineering, Bogazici University, Istanbul, Turkey, 4Wallace H. Coulter Department of Biomedical Engineering, Georgia Institute of Technology, Atlanta, GA, United States, 5Department of Radiology and Imaging Sciences, Emory University, Atlanta, GA, United States
Synopsis
Electric field and temperature sensors are essential tools for RF safety assessment of implants during magnetic resonance imaging. In this work, an acousto-optic sensor was used for both local tangential electric field and temperature measurements. The inherent electric field sensitivity of the piezoelectric crystal mechanically coupled to a fiber Bragg grating provides the electric field information while the thermal sensitivity of FBG is used for temperature measurement for dual mode sensing. The sensor was used to measure the electric field concentration around a reference implant with high SNR as well as the temperature rise at the tip of the implant.
INTRODUCTION
One of the most crucial magnetic resonance (MR) safety concerns is excessive heating of metallic implants induced by the deposited high radio frequency (RF) energy. Current standards for RF-heating assessment of medical implants require temperature measurements (ASTM F2182-19e2) and electric (E) field measurements (ISO/TS 10974:2018). In this work, we present an acousto-optic modulator-based dual mode sensor platform for both temperature and electric field measurements around potential hotspots for RF safety assessment of implants.METHODS
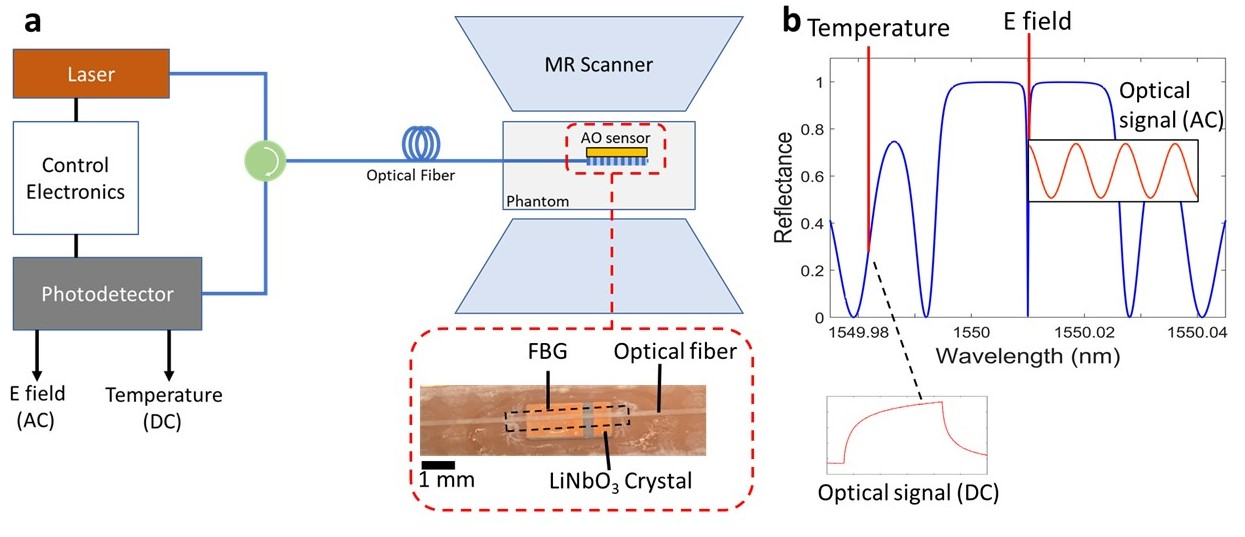
The acousto-optic (AO) sensor consists of a piezoelectric transducer mechanically coupled to a fiber Bragg grating (FBG) at the distal end of an optical fiber1. E field sensing relies on the inherent E field sensitivity of piezoelectric crystals whereas temperature sensing relies on the inherent sensitivity of FBGs to ambient temperature change2. A schematic overview of the measurement set-up and a close-up image of the AO sensor are shown in Figure 1a. Optical read out is achieved through side slope detection method. An optical receiver and a narrow linewidth laser are used for probing the FBG at a wavelength on a slope in the reflection spectrum. The central notch was used for E field detection, as it provides the highest sensitivity, whereas one of the side lobes was used for temperature measurement for increased range (Figure 1b). AC coupled photodetector output is monitored for time-domain E field measurement, whereas DC coupled photodetector output is monitored for slow changing temperature measurement. In this particular sensor, a π-phase shifted FBG sensor was used with 0.4pm bandwidth and central wavelength of 1550nm (Teraxion Inc., Quebec, Canada) embedded in a 125μm diameter optical fiber. A 140μm thick 36o Y-cut LiNbO3 piezoelectric crystal with 1mmx5mm lateral size (Boston Piezo Optics Inc., MA, USA) was used around its third harmonic resonance (63 MHz) to match the Larmor frequency at 1.5T. The AO sensor was tested in a gel phantom per ASTM F2182-19e2 standard, using a 1.5 T scanner (Magnetom Espree, Siemens Healthineers, Erlangen, Germany). Measurements were taken near the tips and middle of the reference implant (1⁄8in.×10cm titanium rod), which was oriented parallel to the long side of the phantom and placed 3cm away from the phantom wall. E field measurements were performed using a gradient echo (GRE) sequence (flip angle, 45°; TR, 24.78ms; TE, 1.6ms; slice thickness, 7mm; bandwidth, 651Hz/pixel and matrix size, 192×192), whereas the heating experiment was conducted using a bSSFP sequence (flip angle, 66°; TR, 31.79ms; TE, 0.96ms; slice thickness, 10mm; bandwidth, 977Hz/pixel and matrix size, 128×128). Temperature response of the AO sensor was characterized in a temperature-controlled water bath and reference measurements were performed using a J type thermocouple (Extech Instruments, NH, USA).RESULTS
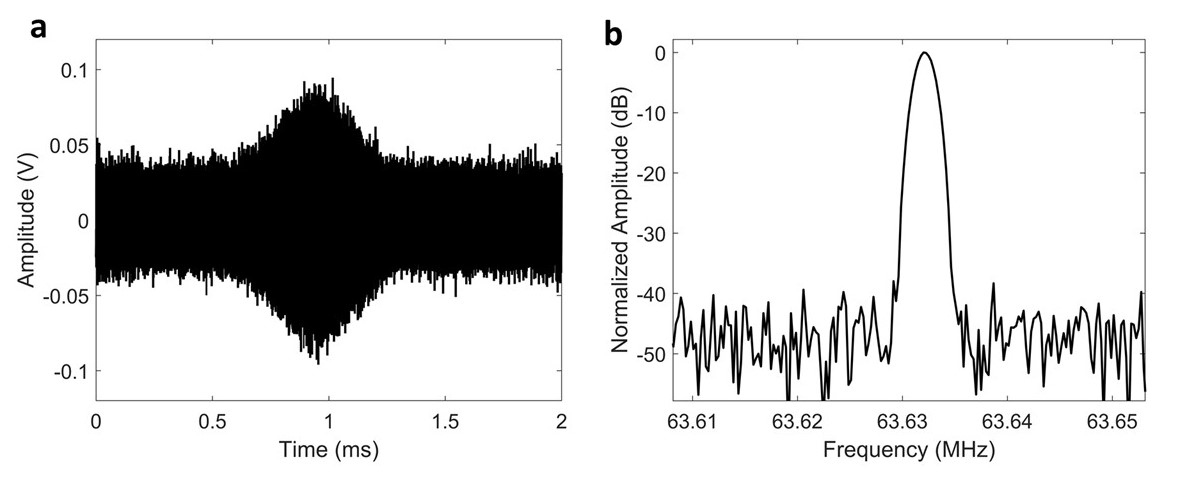
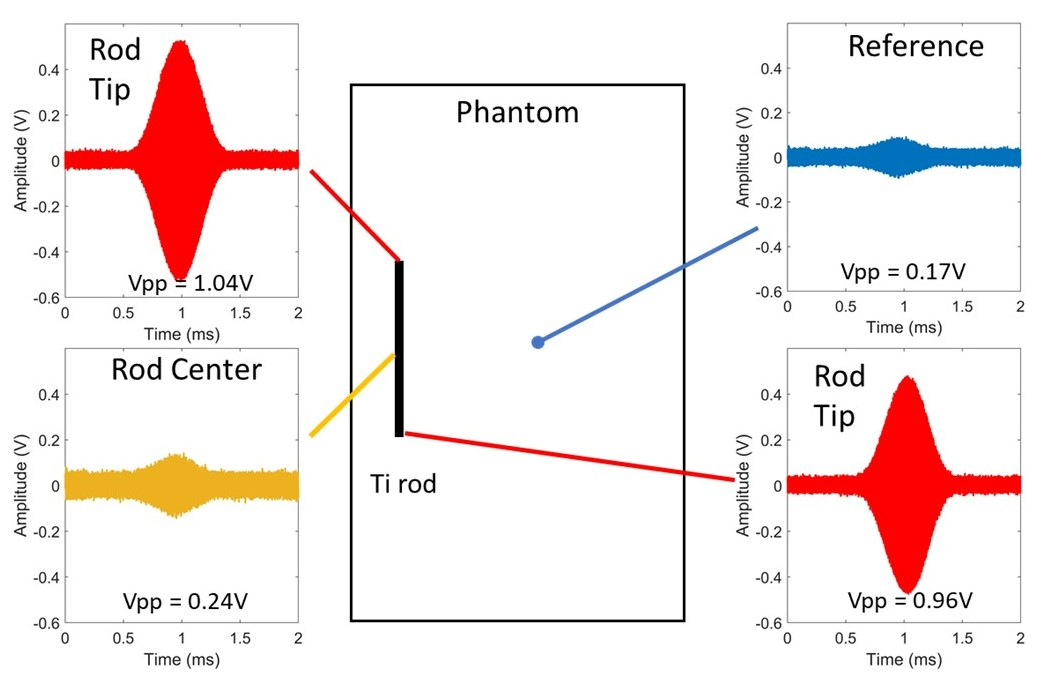
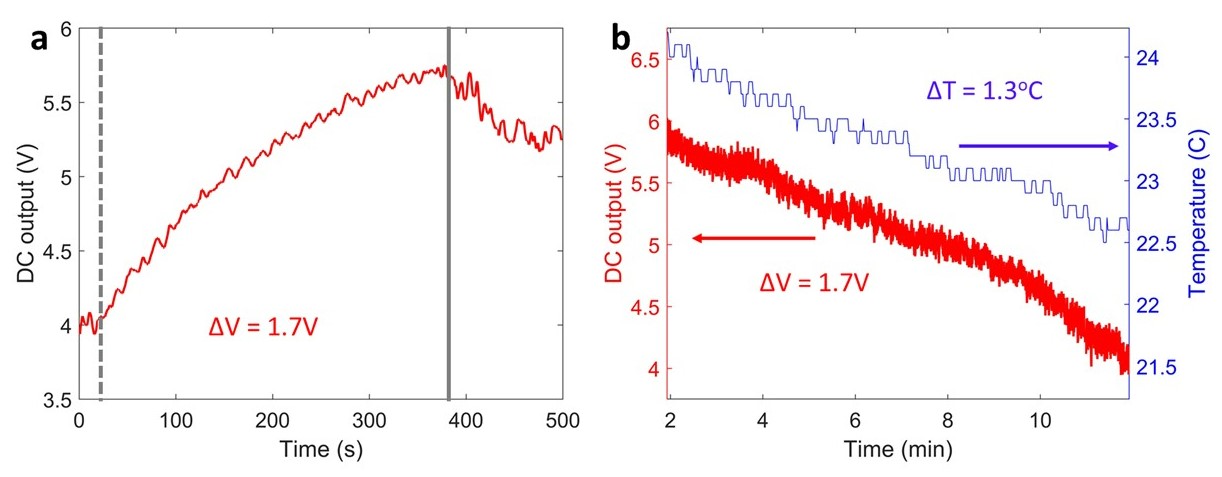
Time-domain E field signal measurement at the geometric center of the phantom using the AO sensor for the GRE sequence is given in Figure 2a. Frequency spectrum of the same signal shows an SNR over 40dB at a flip angle of 45° (Figure 2b). E field measurements at various locations of the phantom including near the tips and the midpoint of the Ti rod as well as away from the Ti rod at a reference point are shown in Figure 3. E field was elevated slightly at the midpoint (0.24V) and significantly at the tips (0.96V and 1.04V) compared to the reference point (0.17V), as predicted. Temperature rise at the tip of the Ti rod was measured by probing the side lobe of the FBG. DC output voltage of the photodetector increased from 4V to 5.7V during a 6-minute-long high SAR (bSSFP) sequence (Figure 4a). A comparison between the AO sensor and thermocouple is given in Figure 4b. Temperature change of 1.3oC was measured for the same voltage range observed during the heating test. Thermal sensitivity of the AO sensor is calculated 1.3V/oC with an accuracy of ±0.11oC in this particular configuration.DISCUSSION
The AO sensor was able to capture the E field elevation around a reference implant in a phantom study with high SNR. SNR of the AO sensor is more than sufficient for E field mapping purposes, whereas temperature measurement accuracy is adequate for the ASTM standard with limited temperature range. Although temperature and E field measurements were not taken simultaneously in this experiment, simultaneous measurement can be achieved by adding wide range wavelength tracking capability to the read-out electronics. The E field can be still measured through the side slope, whereas temperature can be measured by tracking the slow drift in the central wavelength with greater accuracy and dynamic range. In this study, AO sensor size was limited by the piezoelectric crystal, which can be decreased by using a smaller crystal or implementing a thin piezoelectric film coating over the FBG.CONCLUSION
We performed proof-of-principle experiments on a dual mode acousto-optic based RF safety sensor to measure both electric field and temperature.Acknowledgements
Research reported in this abstract was supported by National Institute of Biomedical Imaging and Bioengineering of the National Institutes of Health under award number 1R01EB029331. The content is solely the responsibility of the authors and does not necessarily represent the official views of the National Institutes of Health.References
1. Yaras YS, Yildirim DK, Kocaturk O, Degertekin FL. Sensitivity and phase response of FBG based acousto-optic sensors for real-time MRI applications. OSA Contin. 2020;3:447-458.
2. Rao YJ, Webb DJ, Jackson DA , et al. In-fiber Bragg-grating temperature sensor system for medical applications. J Light Technol. 1997;15:779-785.
Figures