2003
3D MRI characterization of 3D printed tumor tissue models using a plastronic MR-Bioreactor : Preliminary results1Université de Lyon, INSA Lyon, Université Claude Bernard Lyon 1, Ecole Centrale de Lyon, CNRS, Ampère UMR5005, Villeurbanne, France, 23d.FAB, Univ Lyon Université Lyon1 CNRS, INSA, CPE-Lyon ICBMS UMR 5246, Villeurbanne, France
Synopsis
Tissue engineering for regenerative medicine have been developing for a few decades now and the number of applications is increasing to tackle the shortage of organ donors. To date, only few systems can allow both monitoring and 3D characterization of tissue constructs during their growth. In this study, we decided to focus on following the Apparent Diffusion Coefficient (ADC) known to be a marker of cell density and built a MR-Bioreactor to probe the ADC of a growing tissue. In this preliminary work, we were able to follow the cell density of a tumor tissue model using our dedicated MR-bioreactor.
Introduction
Tissue engineering for regenerative medicine have been developing for a few decades now and the number of applications is increasing to tackle the shortage of organ donors. From cartilage to skin, a wide range of tissues are currently being studied with the goal of restoring or replacing damaged tissues 1. While massive progress has been achieved to produce 3D printed constructs, only few systems can allow both monitoring and 3D characterization of tissue constructs during their growth 2,3. Despite a lower spatial resolution compared to optical modalities, Magnetic Resonance Imaging (MRI) allows non-destructive 3D characterizations of soft tissues based on multiscale parameters that are key in assessing tissue development 4,5. In this study, we decided to focus on characterizing the Apparent Diffusion Coefficient (ADC) known to be a marker of cell density 6 and built a MR-bioreactor to probe the ADC of a growing tissue 5,7. Performing MR characterization of growing tissues is challenging because it requires to couple an imaging apparatus and a bioreactor which are usually not MR-compatible. To our knowledge, only one group tackled this issue by building a dedicated MR-compatible bioreactor3 to be used with a commercial surface MR coil. Generally, those coils are large (~1-10cm) compared to engineered tissues (~0.1-5cm) and thus do not allow optimal MRI conditions. In addition to that, using such a setup consisting in two devices adds complexity to an already complex modality, especially for non-experts. The resulting poor integration of the bioreactor and the MR coil can result in non-reproductible measurements. Hence, we decided to pursue our previous work 2 and propose here an improved MR-bioreactor for ADC assessment of a 3D printed tumor tissue model.Method
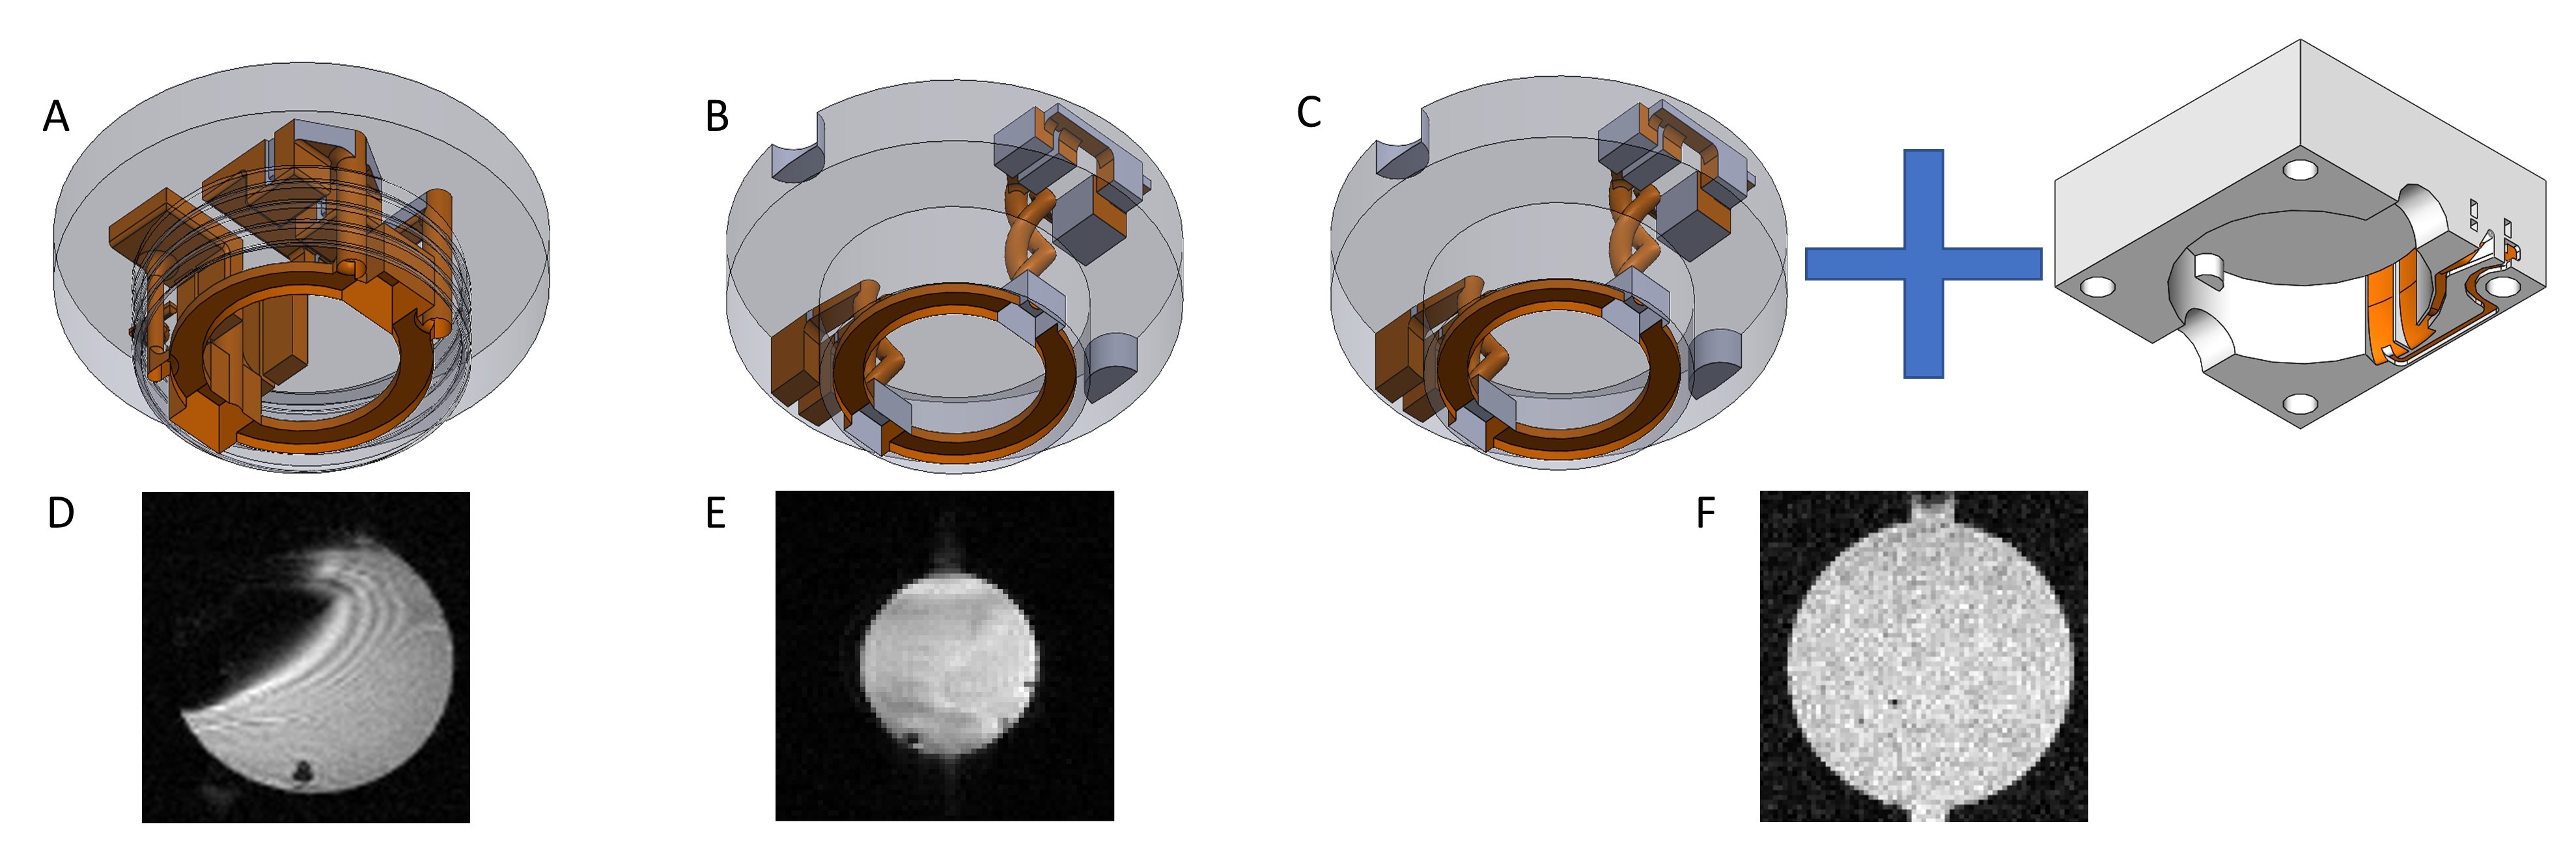
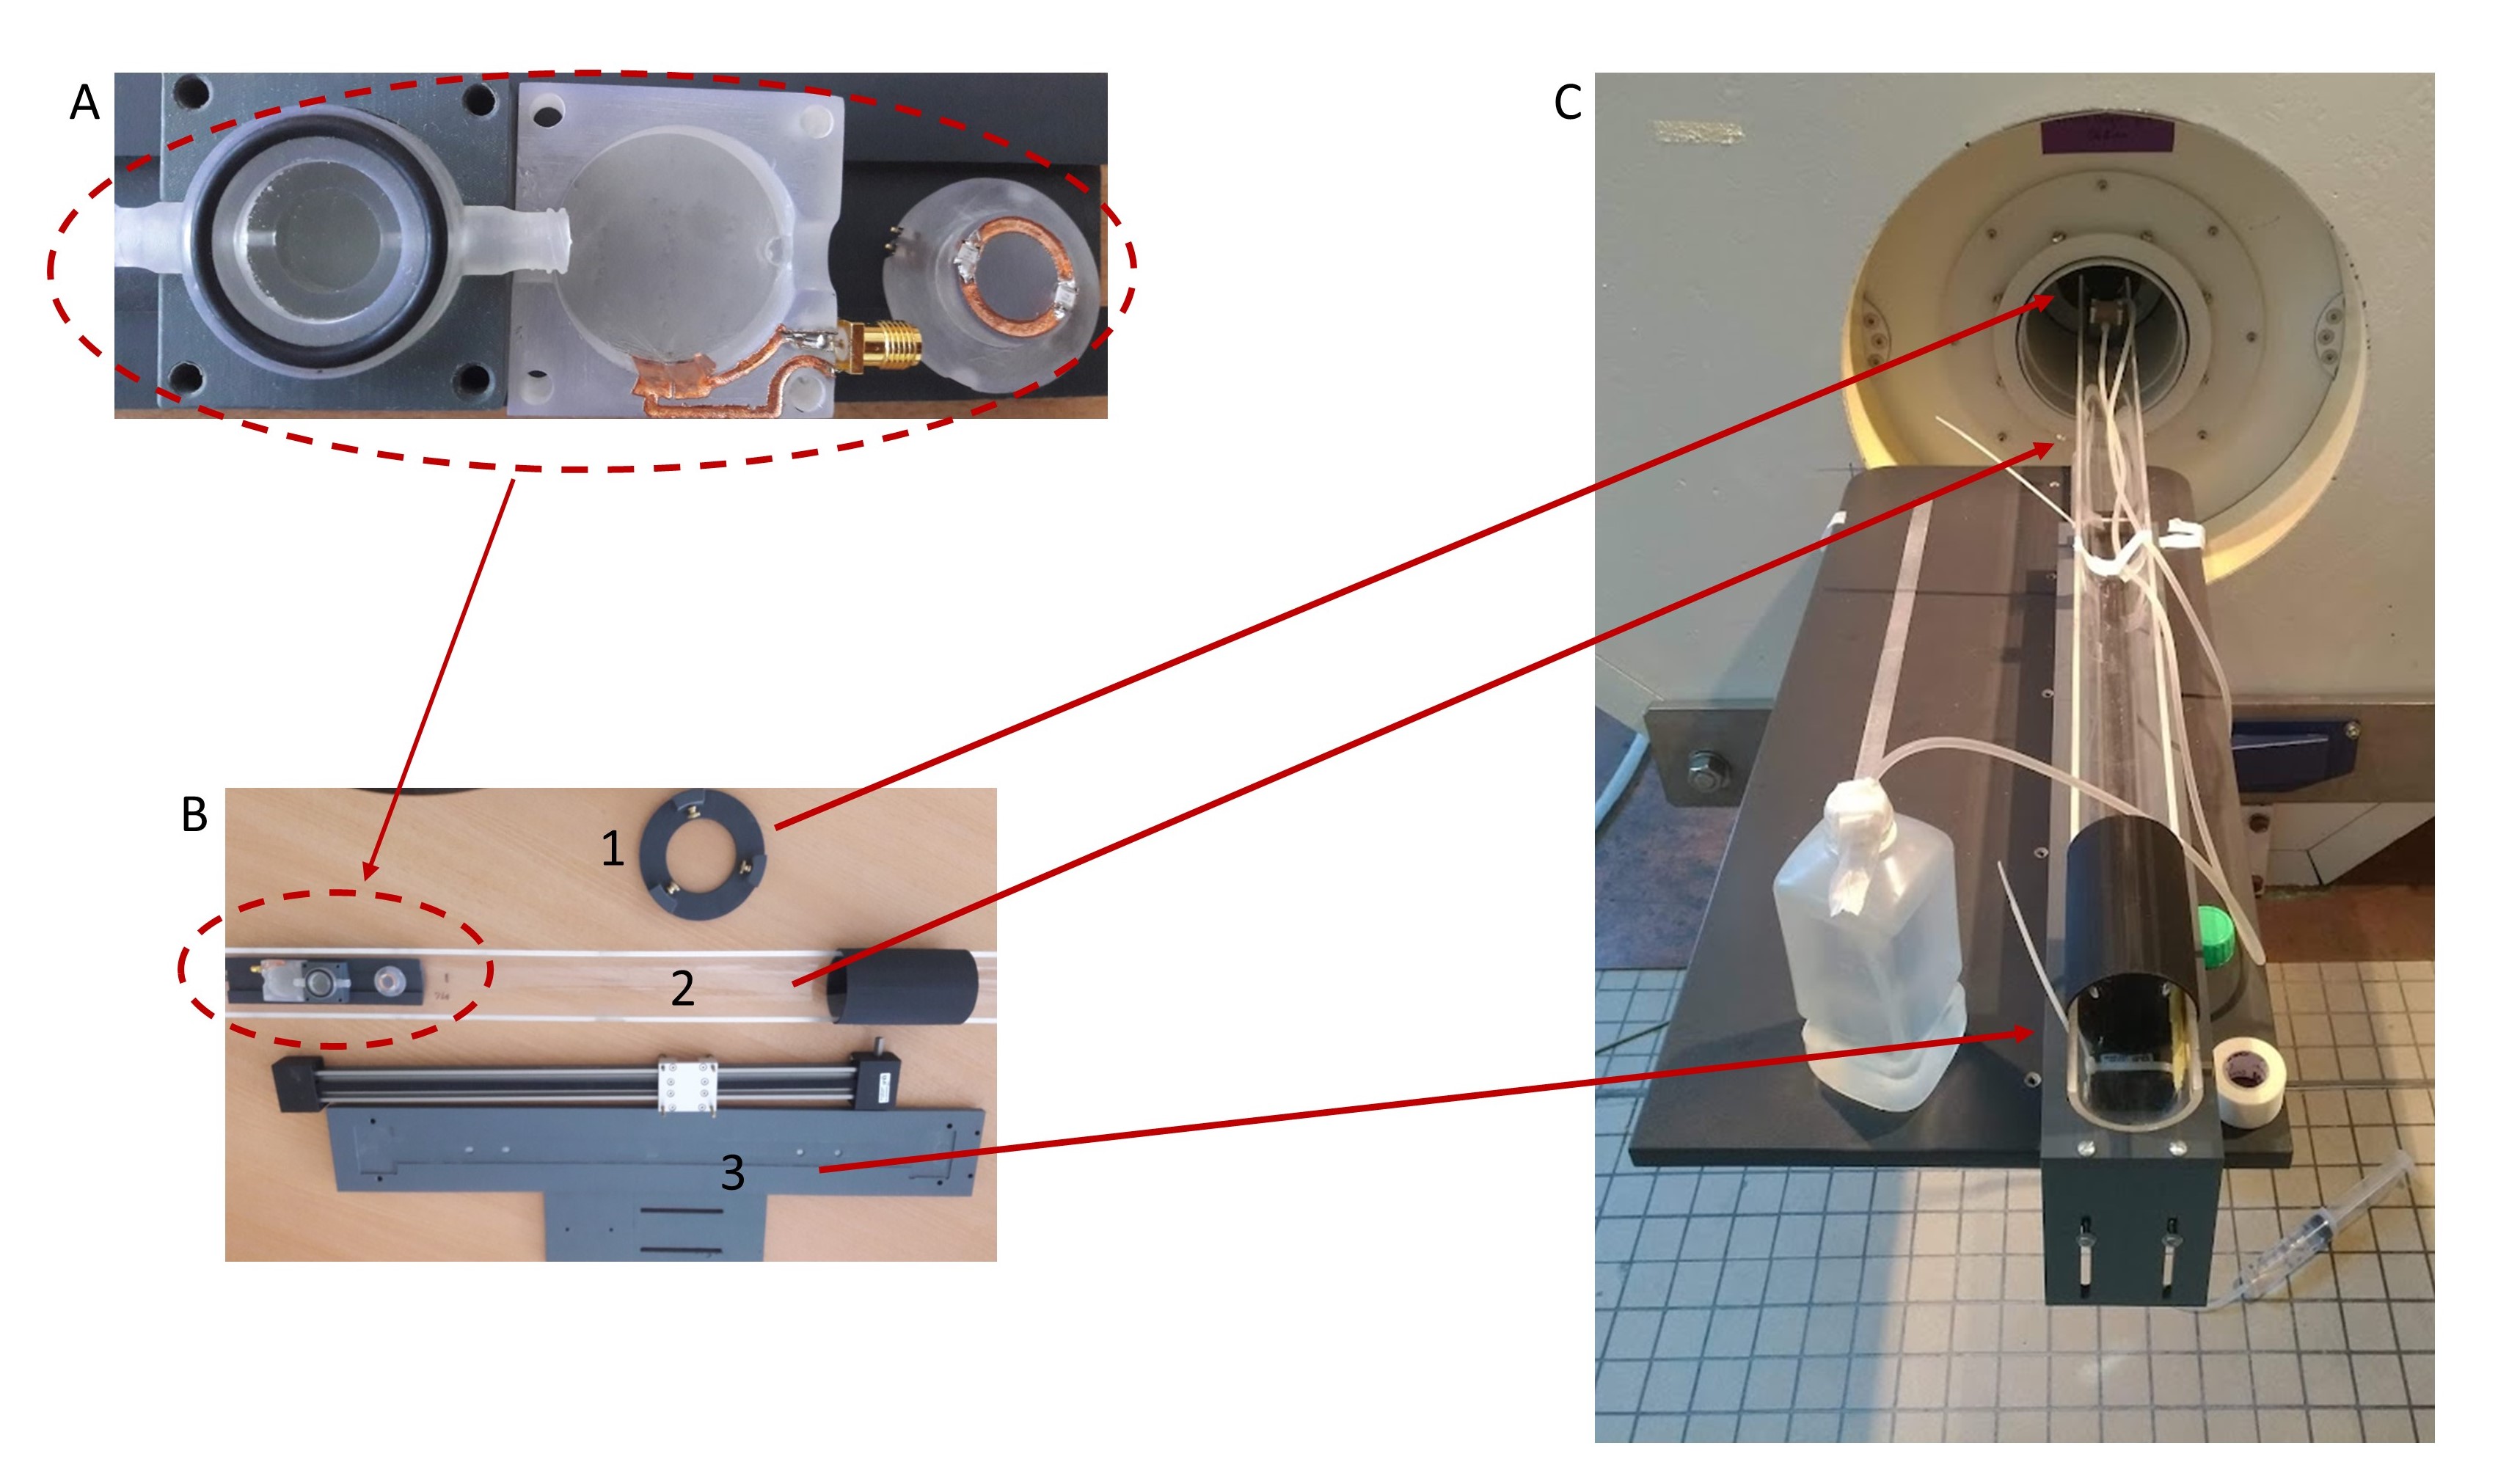
Based on our previous work based on plastronic techniques 2,8, both the electrical and mechanical aspects of our MR-bioreactor were improved.The coil geometry and the passive decoupling scheme remained unchanged but two electrical connections needed to be modified. First, the connection between the coil and the decoupling circuit integrated within the top cap has been made using a pair of twisted vias in order to avoid parasitic loops leading to imaging artifacts (figure 1a,1b). Second, the connection between the MR-bioreactor and the scanner has been displaced to an external 3D printed cover to reduce the mechanical load on the MR-bioreactor copper tracks (figure 1c). The connection between this cover and the MR-bioreactor is made using shield fingers (figure 5a).
Mechanical stability and hence measurement repeatability of the experiments were improved with a bench support designed specifically for our imaging platform (figure 5b,5c).
The imaging platform we used was equipped with a 7 T Bruker MRI Scanner running ParaVision 5.1 and a transmitting 72mm birdcage.
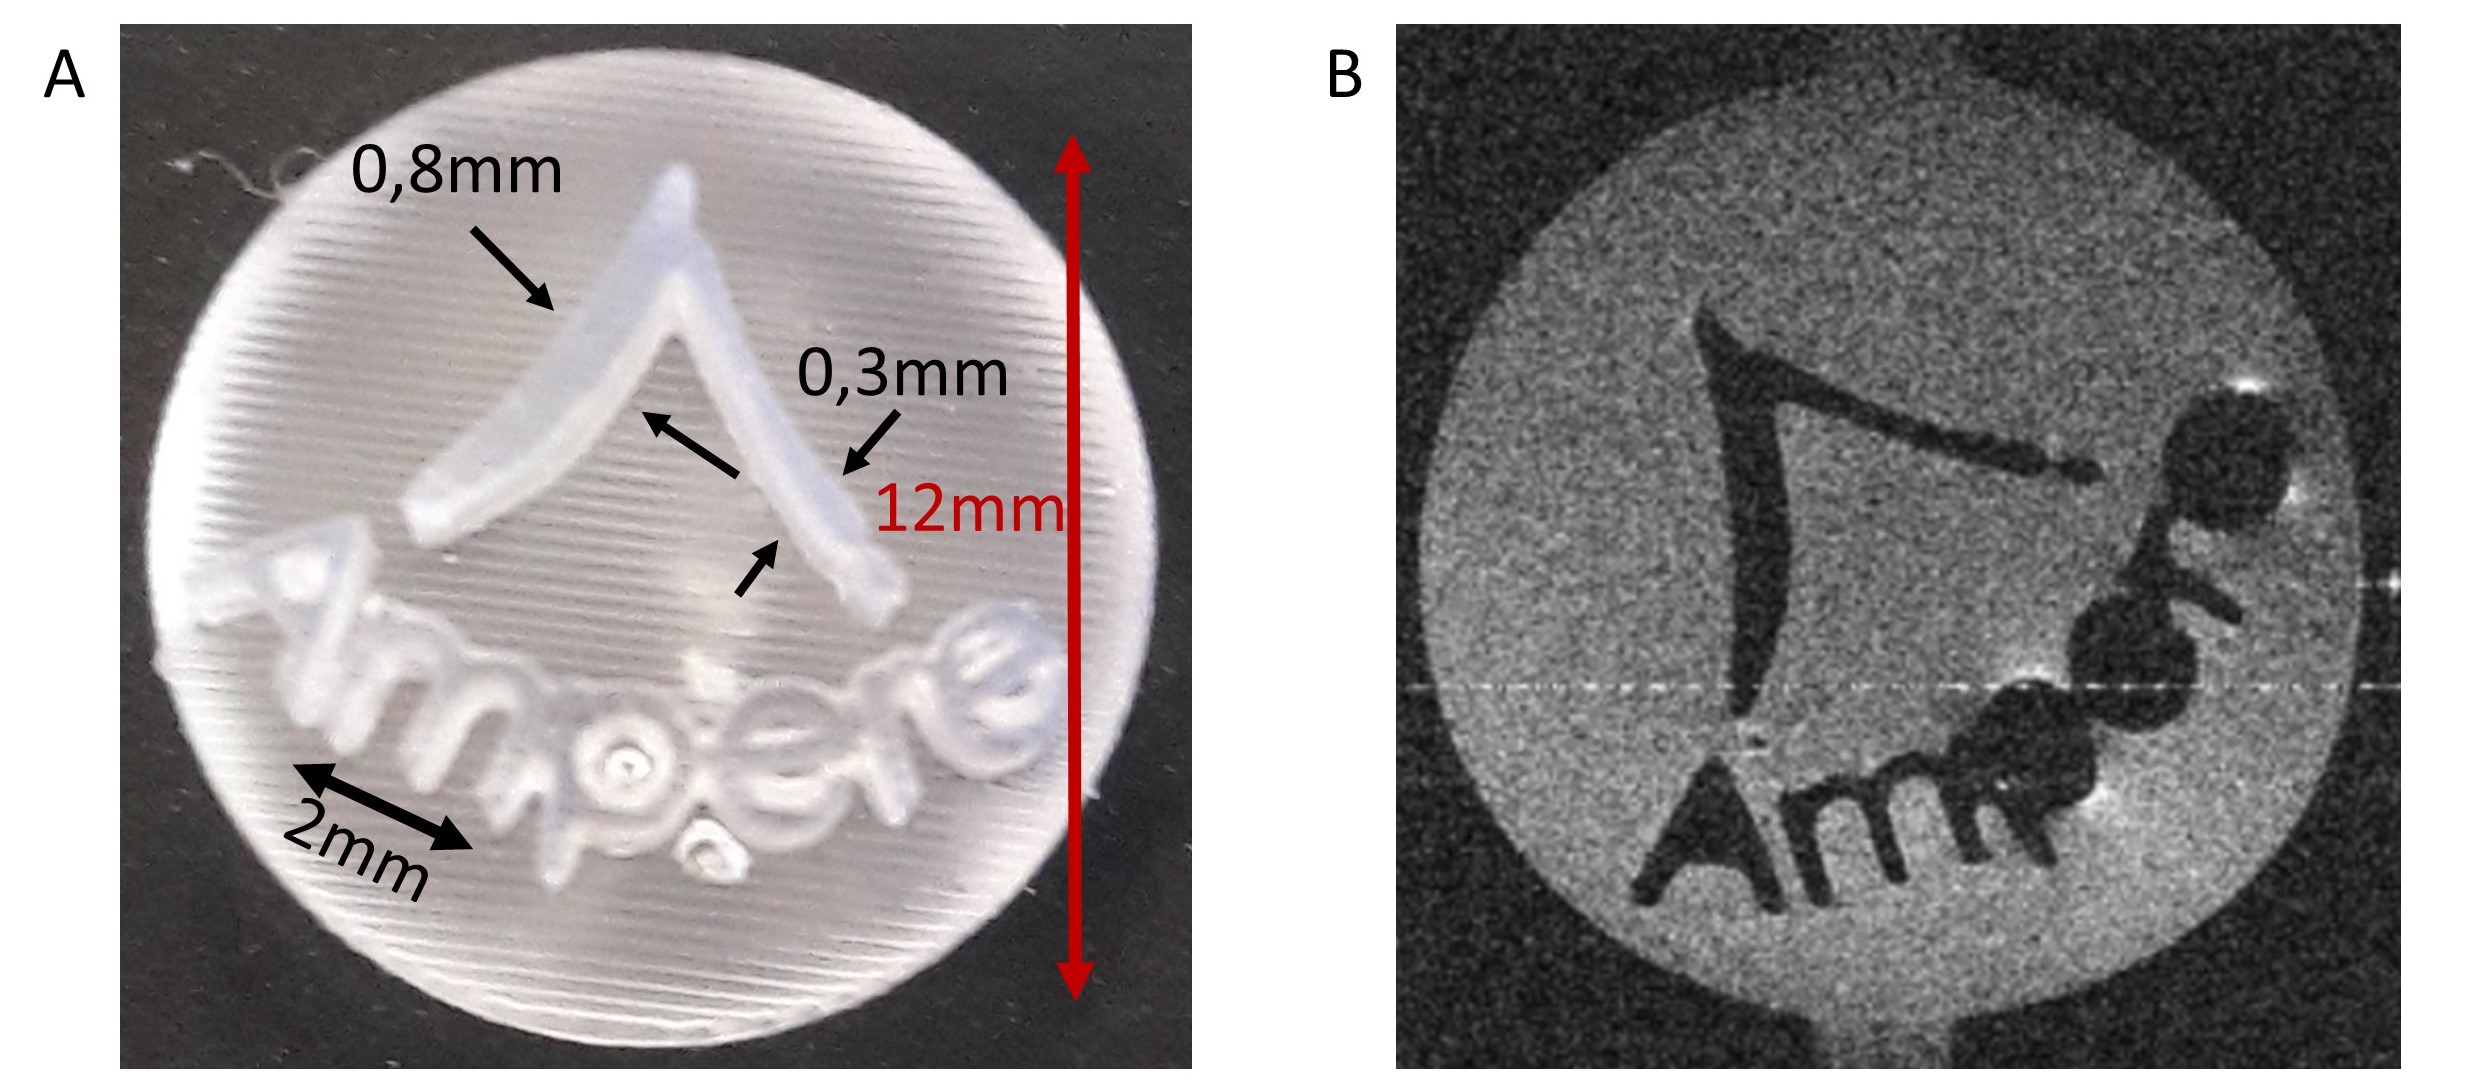
To illustrate the ability of our MR-bioreactor to obtain morphological images of small samples we 3D printed the logo of our laboratory and filled the MR-bioreactor with a 0.9% sodium chloride solution.
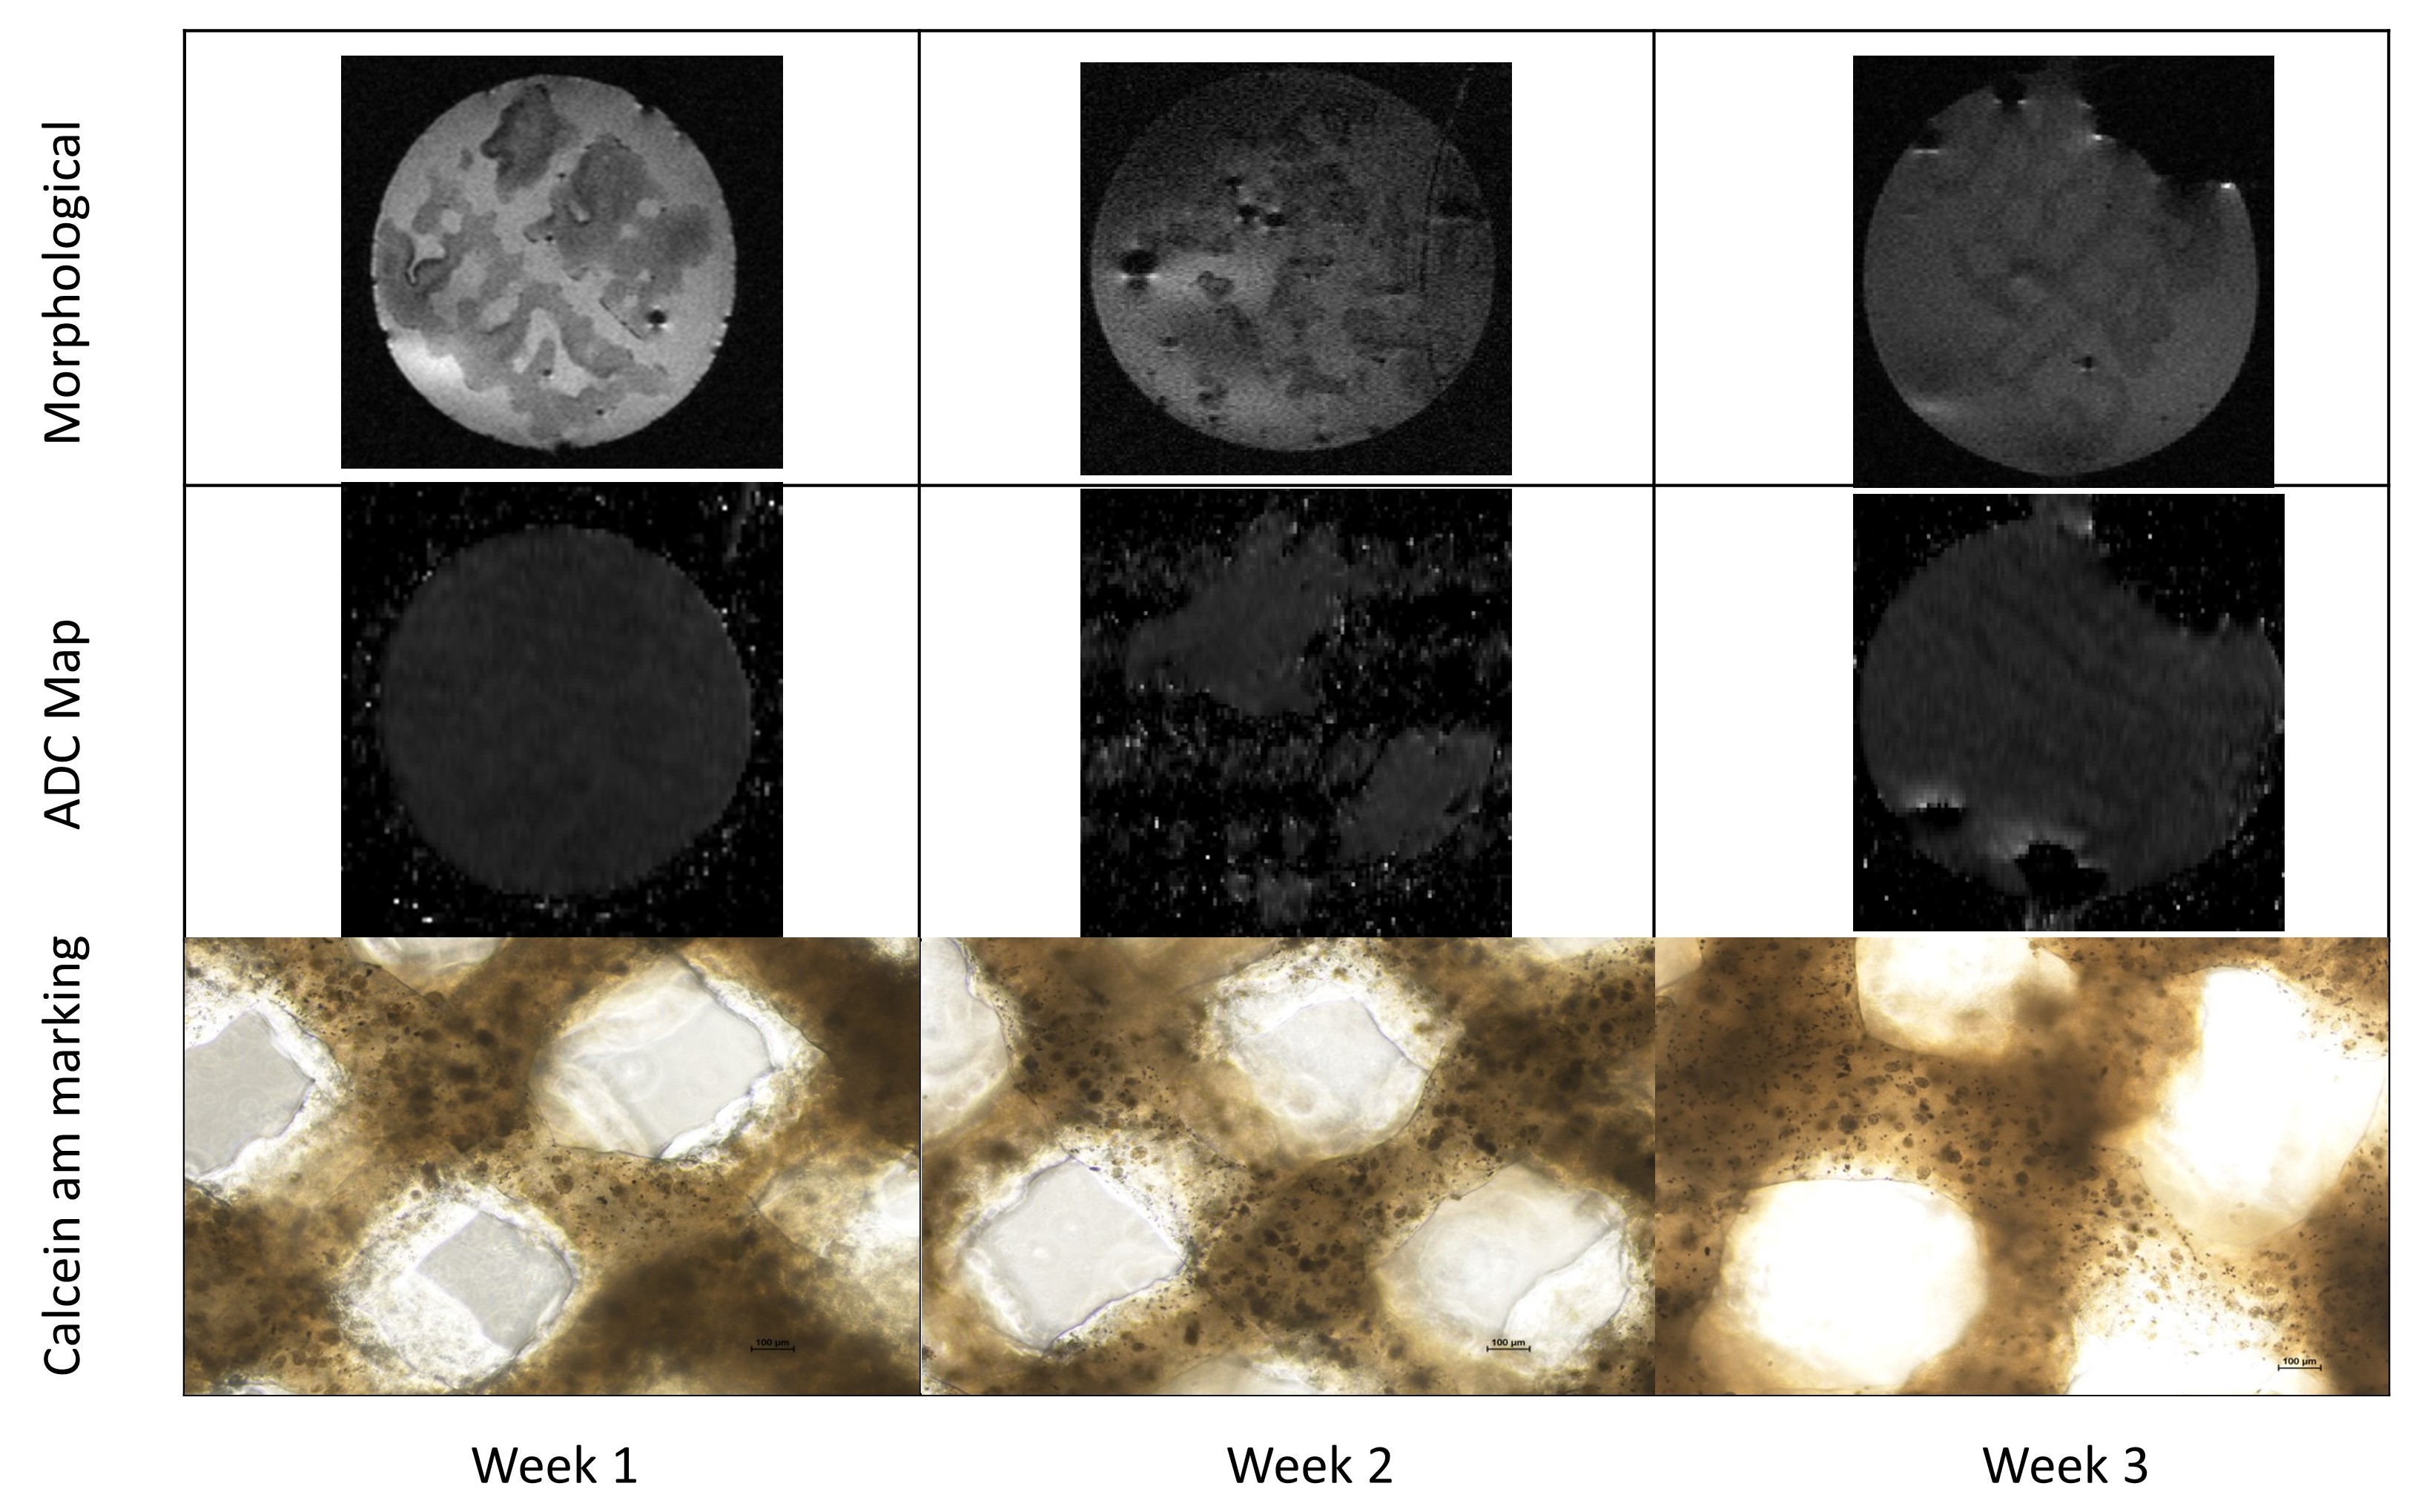
3D printed tissue models were provided by 3d.FAB platform. At time t=0, 3 tissues samples were printed and put inside a 37°C 5% CO2 dedicated incubator. The tissues samples were 80% porous hydrogel scaffolds containing HT29 cells and fibroblasts (CAF). Each week, one sample was placed in our MR-Bioreactor for MRI characterization. After the MRI experiment, a calcein-am marking of living cells was performed on the sample.
During the experiments, tissues were immersed in a 0.9 % sodium chloride solution to ensure tissue viability during the acquisition time. Fluid circulation was also needed for removing air bubbles.
The samples were imaged using three acquisition sequences:
- Two morphological sequences. One axial and one coronal Turborare T2 (Repetition time (TR)=3700ms, Echo time (TE)=20ms, 16 averages, Field-of-view(FOV)=1.92*1.92, 256² matrix, 400 microns slice thickness)
- One quantitative EPI ADC diffusion sequence (TE=19.39ms, TR=5250ms, 8 segments, 8 averages, FOV=1.92*1.92, 128² matrix, b=0 100 200 300 500 750 1000 s/mm²) in order to quantify the ADC.
Results
Figures 1a,1b demonstrate the artefact suppression using our twisted vias. Moreover, figures 1b,1c shows how having an additional connection with a connected cover between the MR-bioreactor and the terminal can be detrimental to the SNR.A 40µm in plane resolution image of the logo of our laboratory can be seen figure 2.
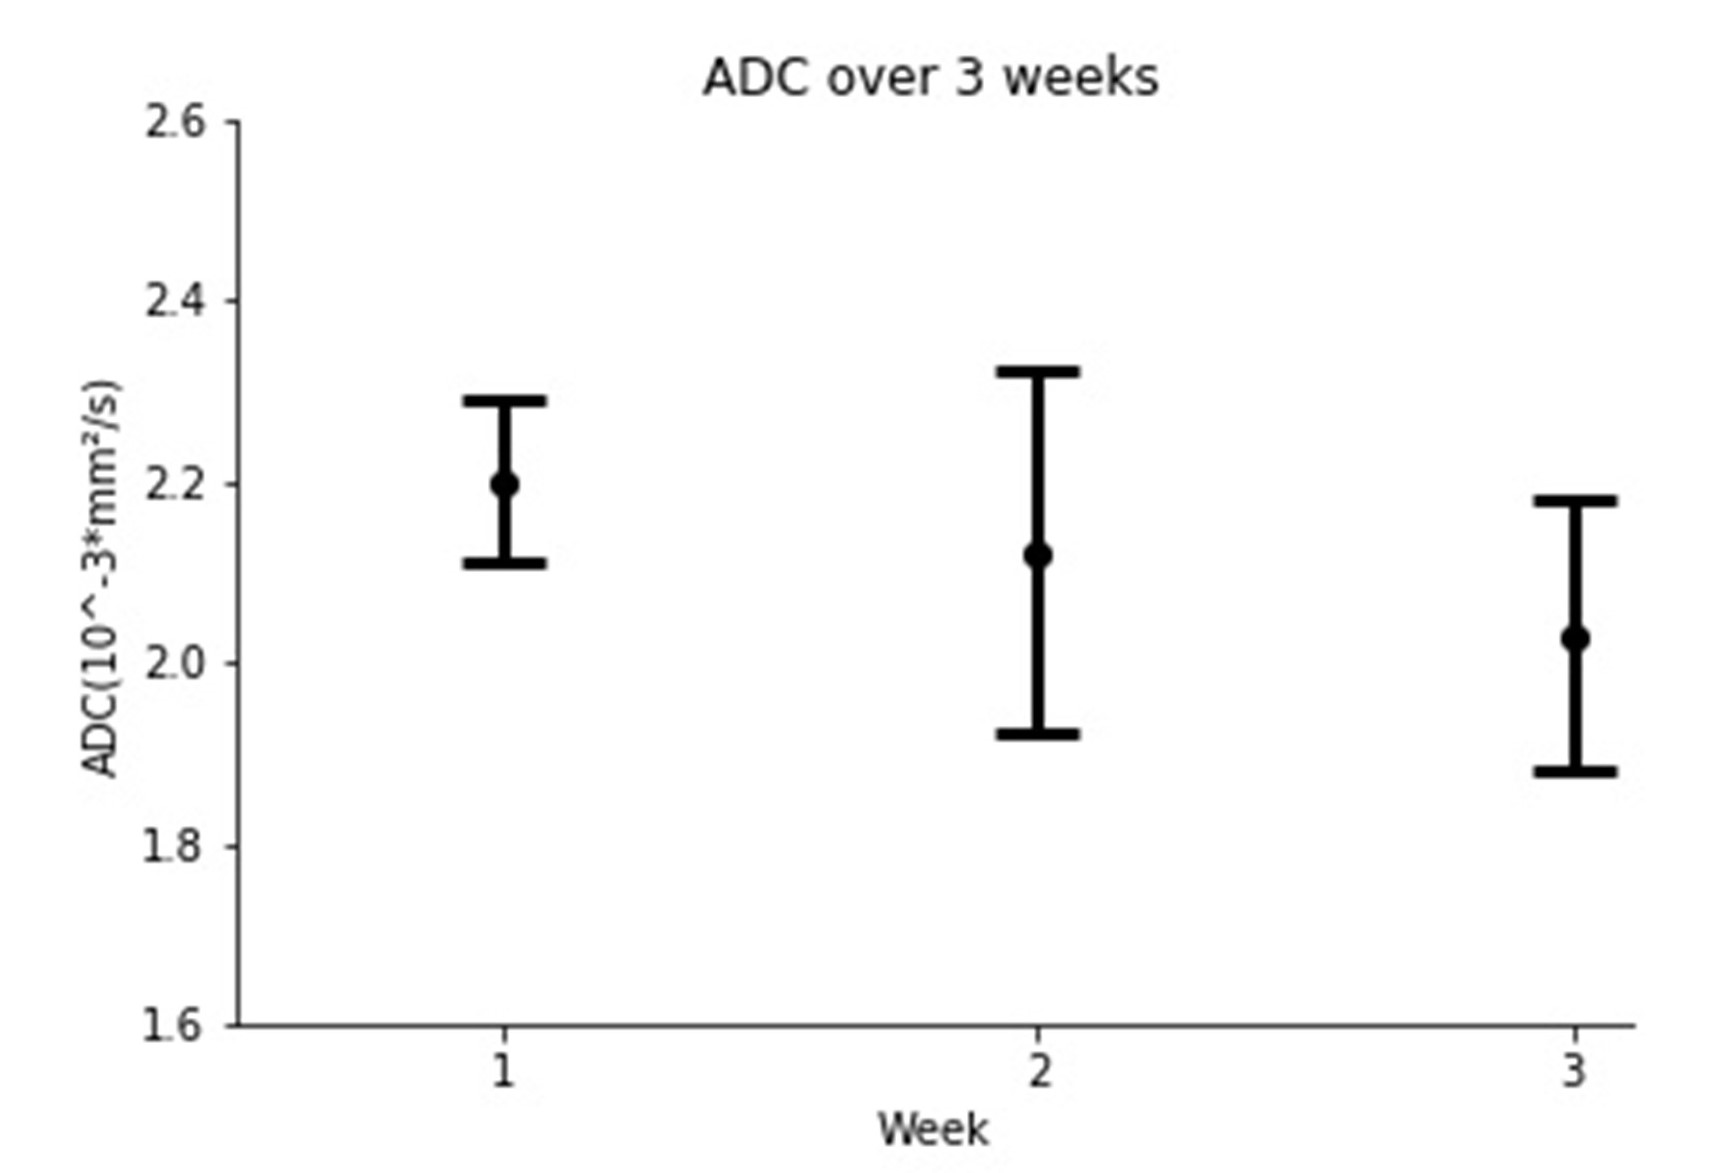
A decreasing tendency of the ADC over the three weeks can be seen figure 3. On figure 5, the calcein AM marking of the living cells illustrate an increasing number of cells which is in agreement with the results shown by the ADC.
Conclusion
In this preliminary work, we were able to follow the cell density of our tissues. An analytical model 9 along with a higher sampling rate would allow to derive the proliferation and cell motility from our measurements. However, that would necessitate to have a more precise positioning of the sample with no displacement or deformation which is challenging due to samples’ mechanical properties and fluid circulation. In any case, those results are the first steps towards in vitro 3D tumor tissue model characterization.Acknowledgements
This work was supported by a grant from the Agence National de la Recherche (Estimate Project N° ANR-18-CE19-0009-01). The financial support provided by Ingénierie@Lyon, member of the Carnot Institutes Network (Metafab 3D project) for the postdoctoral scholarship of Dr T. Gerges is also acknowledged. Moreover, the role of CERMEP - Imagerie du vivant and especially Radu Bolbos and is acknowledged.References
1. Langer, R. & Vacanti, J. Tissue engineering. Science 260, 920–926 (1993).
2. Gnanago, J.-L. et al. Compact MRI bioreactor for real-time monitoring 3D printed tissue-engineered constructs. in Proceedings of the 29th International Society in Magnetic Resonance for Medecine Annual Meeting 3122 (2021).
3. Othman, S. F., Wartella, K., Khalilzad Sharghi, V. & Xu, H. The e -Incubator: A Magnetic Resonance Imaging-Compatible Mini Incubator. Tissue Engineering Part C: Methods 21, 347–355 (2015). 4. Frese, J. et al. Nondestructive monitoring of tissue-engineered constructs. Biomedical Engineering / Biomedizinische Technik 59, (2014).
5. Magnetic resonance imaging in tissue engineering. (Wiley Blackwell, 2017).
6. Padhani, A. R. et al. Diffusion-Weighted Magnetic Resonance Imaging as a Cancer Biomarker: Consensus and Recommendations. Neoplasia 11, 102–125 (2009).
7. Kotecha, M., Schmid, T. M., Odintsov, B. & Magin, R. L. Reduction of water diffusion coefficient with increased engineered cartilage matrix growth observed using MRI. in 2014 36th Annual International Conference of the IEEE Engineering in Medicine and Biology Society 3913–3916 (IEEE, 2014). doi:10.1109/EMBC.2014.6944479.
8. Gerges, T. et al. 3D Plastronics for Smartly Integrated Magnetic Resonance Imaging Coils. Front. Phys. 8, 240 (2020).
9. Ellingson, B. M. et al. Spatially quantifying microscopic tumor invasion and proliferation using a voxel-wise solution to a glioma growth model and serial diffusion MRI: Image Maps of Tumor Invasion and Proliferation. Magn. Reson. Med. 65, 1131–1143 (2011).
3d.Fab Platform http://fabric-advanced-biology.univ-lyon1.fr/
Figures