2000
A Calibration and Compensation Method for Dynamic Range Recovery of Low-Power SiGe Pre-Amplifiers.1Electrical Engineering, Stanford University, Stanford, CA, United States, 2GE Healthcare, Aurora, CO, United States, 3Radiology, Stanford University, Stanford, CA, United States
Synopsis
Power consumption reduction is key when exploring wireless MRI arrays. An alternative low-power (5.7mW) SiGe pre-amplifier is presented and its impact on imaging performance evaluated in a benchtop setting. The reduction in power results in a more extreme non-linearity that introduces distortion into the images. It is possible to calibrate and compensate for this distortion through receive-only methods. Applying this compensation to the distorted images results in a restoration of image quality with resulting RMSE comparable to industry standard amplifiers representing a potential power reduction up to 30x.
Motivation
Translation of MRI hardware to power limited settings such as wireless systems will require significant power consumption reduction. Industry standard pre-amplifiers like those based around the ATF34143 have potential bias currents between 30mA to 60mA1. Silicon Germanium based amplifiers such as one built around the BFP840ESD (Infineon Technologies) [Figure 1A] are a promising alternative, possessing high gain and low noise figure at bias currents less than 5mA2. Decreasing bias current results in reduced linearity, i.e input and output third order intercept points [Figure 1B]. Image distortion caused by this non-linearity must be compensated. By leveraging the pre-scan period with proposed hardware for pilot tone insertion3, and applying system linearization techniques, is it possible to achieve this power reduction while maintaining image quality?System Linearization
Linearization relies on either having access to both system inputs and outputs4, or relying on distorted outputs and known signal characteristics5. Accessing signals incident to the pre-amplifier requires additional receiver hardware beyond replacing the pre-amplifier, thus we concentrate on receive-only methods. For a receive chain characterized by some non-linearity F, we seek a second non-linearity, G, that when cascaded with F produces a linear response [Figure 2A]. After transmitting a series of calibration signals which produce the input to the receive chain $$$x(t)$$$, the distorted outputs s[n] are collected. From these distorted outputs, the desired linear outputs of G, $$$y[n]$$$, are constructed. This time-domain input-output relationship is used to identify the coefficients of the system G. Calibration signals are stepped in amplitude to achieve N peak input powers and rotated in the complex plane P times resulting in NP distorted output signals $$$s[n]$$$. The incident signals $$$x(t)$$$ are unknown, but their bandwidth and the ratio of peak transmit powers are known. Peak baseband magnitude is plotted against the square root of peak transmit power, $$$α$$$. The monotonic increasing linear region of this curve is identified. A fit is performed on the linear region. Recorded waveforms from the linear region are combined according to Maximal Ratio Combining6 to create a high-SNR reference waveform, $$$r$$$. For each waveform $$$s_i[n]$$$ in the non-linear region $$$r[n]$$$ is scaled to create the desired linear output $$$y_i[n]$$$ [Figure 2B]. Three structures were explored for G: Complex Lookup Tables, Polynomial, and Memory Polynomial. A Memory Polynomial contains both delayed and higher order terms. For both polynomial methods, coefficients of G were identified via weighted least squares by structuring the systems in the form $$$y=Sg$$$. Here y is the vertical concatenation of the NP synthesized linear outputs. S is a vertical concatenation of NP matrices whose rows contain delayed and higher order forms of $$$s[n]$$$ and whose columns are the time domain signals of those permuted forms. Lastly, $$$g$$$ is a vector of coefficients of the system G.Experimental Methods
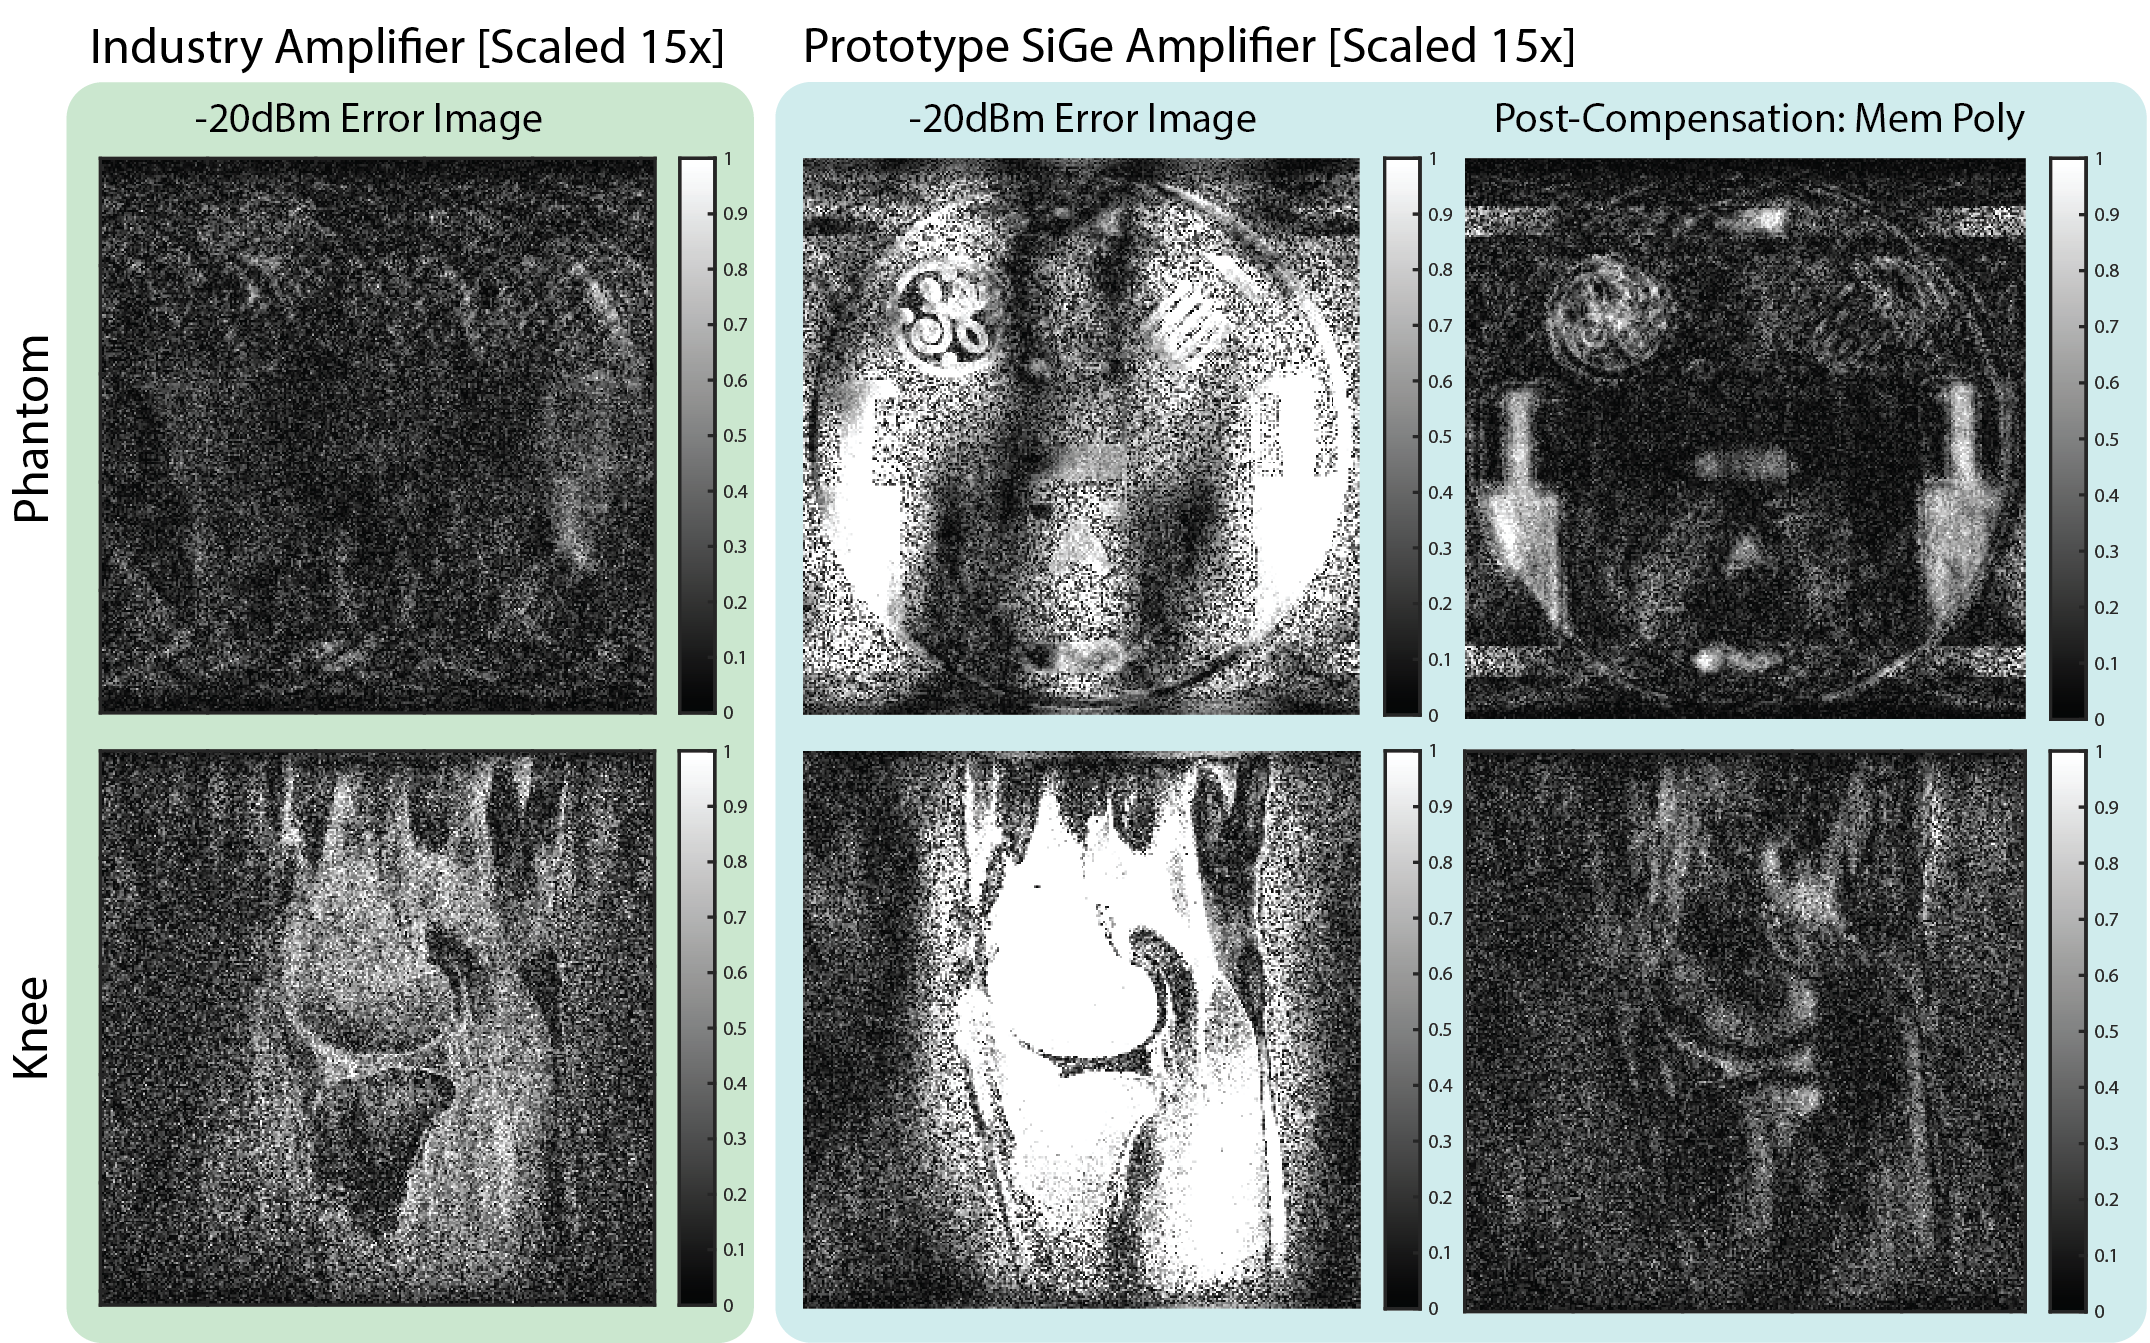
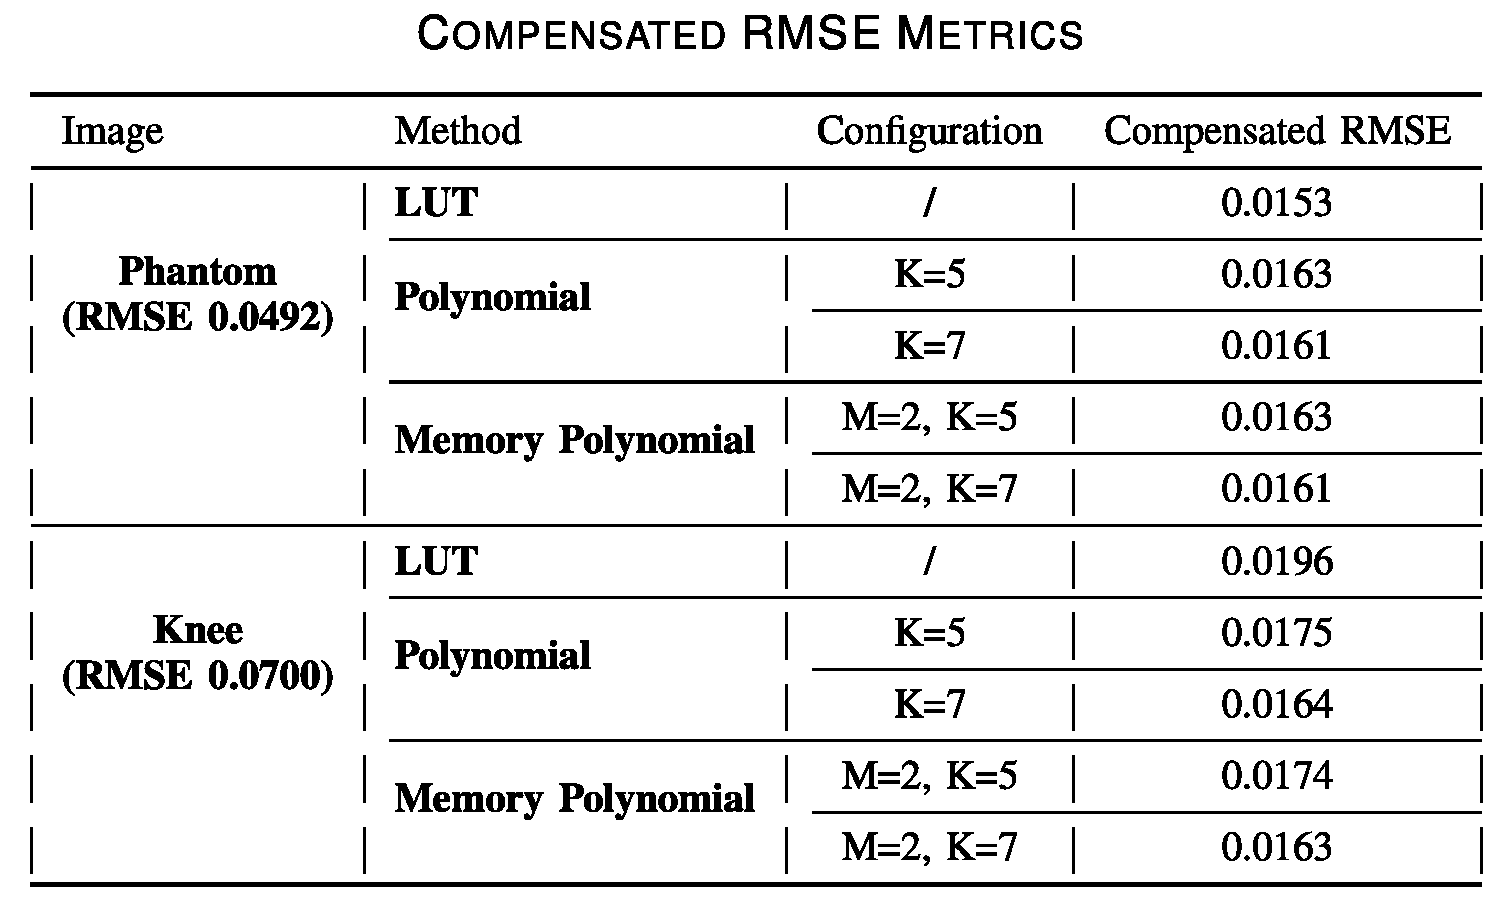
Signals were applied to the example amplifier alongside MRI relevant blocks: an active mixer, IF bandpass filter, additional gain, and data acquisition. Components are shown in [Figure.3]. Signals were generated on a PC and copied to an arbitrary waveform generator. A 20dB attenuator was placed on the combined I&Q output. Peak power was swept from -25dBm to 0dBm (-45dBm to -20dBm after attenuation) in 1dB increments and phase from pi/4 to 7pi/4 in increments of pi/2 for 104 calibration signals of length 7.6ms. Pseudo-k-space data was applied line by line for 256x256 knee and phantom datasets of length 5.1ms per line. Image peak powers of -40, -30, -25, and -20dBm were explored. The example amplifier possesses gain of 16.9dB, Noise Figure ranging 0.9 to 1.3dB based on measurement method, power consumption of 5.7mW, and P.3dB of -35dBm. Following the proposed calibration, the compensator G was applied to both -20dBm knee and phantom datasets for all three compensator structures. For the polynomial based methods, degree orders of five and seven and memory depths of one and two were applied. Error images [Figure 4] are the difference of normalized -40dbm and -20dBm magnitude images. In addition, input normalized root-mean-square-errors [Figure 5] were calculated for all compensator configurations.Results
Comparing the compensated error images to the error images produced by a reference amplifier (WanTcom WMA1R5A), shown in [Figure 4], the amplifier without any compensation introduces significant error into the images. As the knee dataset contains more clinically relevant features, it will be used as a standard to judge the efficacy of the compensator. Following compensation by a memory polynomial of memory depth two and degree order seven, artifacts are corrected such that the only remaining errors are close to the noise floor of the image. Performance is superior in the knee case, likely given the large amount of low-spatial-frequency information present. The phantom image possesses a significant amount of high-spatial frequency content that may be more difficult to correct with this method. Input-normalized RMSEs for all compensator configurations are shown in [Figure 5]. The reference amplifier produces RMSE of 0.0246 and 0.0468 for the phantom and knee datasets, respectively. The compensated errors compare favorably to the industry reference amplifier with the memory polynomial of memory depth two and degree order seven resulting in the largest error reduction for the knee dataset. This encourages the investigation of low-power SiGe amplifiers for wireless arrays.Acknowledgements
This work was supported by NIH Grants U01EB029427, U01EB026412-01A1, R01EB01924105, U01EB026412-01A1, and research support from GE Healthcare.References
[1] BFP840ESD SiGe:C NPN RF Bipolar Transistor, Infineon Technologies,September 2018.
[2] ATF-34143: Low Noise Pseudomorphic HEMT in a Surface Mount Plastic Package, Avago Technologies, July 2008.
[3] E. Solomon, D. S. Rigie, T. Vahle, J. Paˇska, J. Bollenbeck, D. K.Sodickson, F. E. Boada, K. T. Block, and H. Chandarana, “Free-breathing radial imaging using a pilot-tone radiofrequency transmitter for detection of respiratory motion,”Magnetic Resonance in Medicine,vol. 85, no. 5, pp. 2672–2685, 2021.
[4] D. R. Morgan, Z. Ma, J. Kim, M. G. Zierdt, and J. Pastalan, “A Generalized Memory Polynomial Model for Digital Predistortion of RF Power Amplifiers,”IEEE Transactions on Signal Processing, vol. 54,no. 10, pp. 3852–3860, 09 2006.
[5] R. Vansebrouck, C. Jabbour, O. Jamin, and P. Desgreys, “Fully-Digital Blind Compensation of Non-Linear Distortions in Wideband Receivers,” IEEE Transactions on Circuits and Systems I: Regular Papers, vol. 64,no. 8, pp. 2112–2123, 2017.
[6] A. Goldsmith, “Wireless Communications,” 2005, pp. 204–227.
Figures
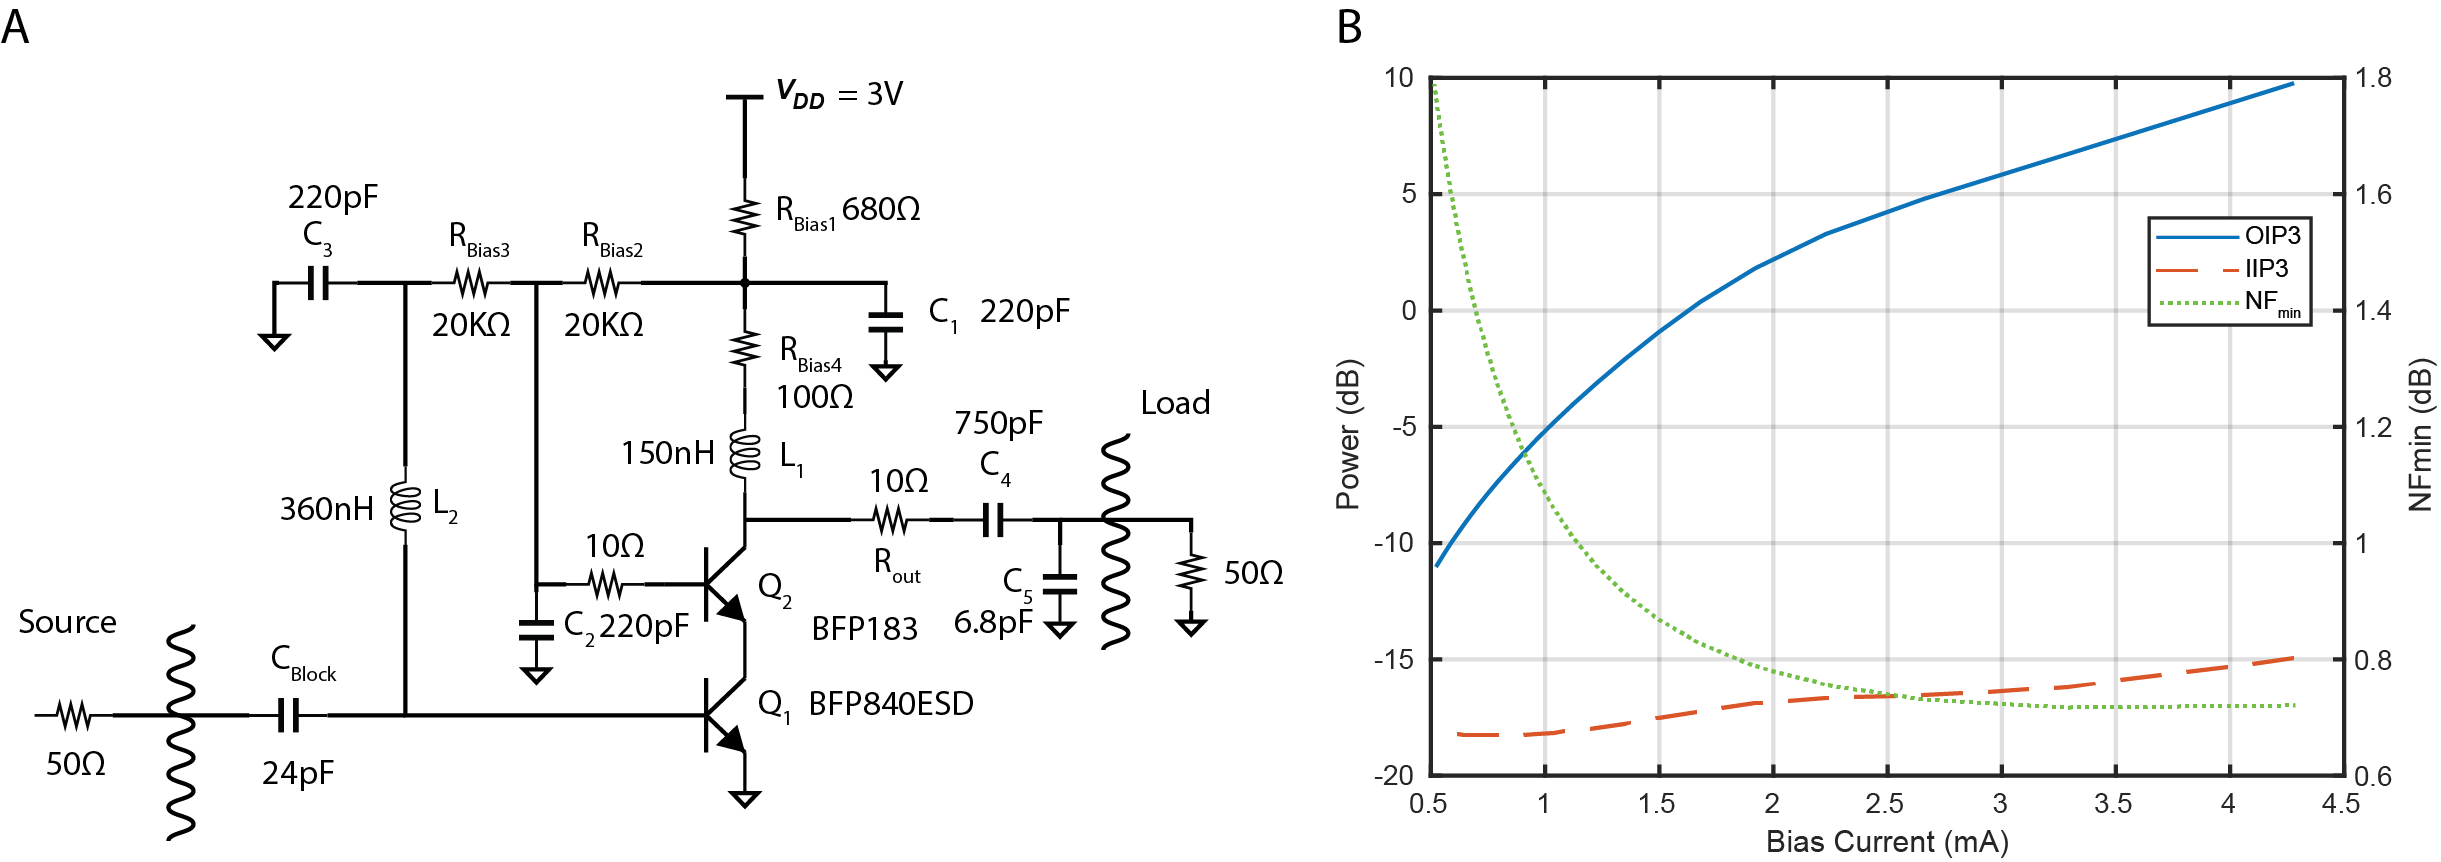
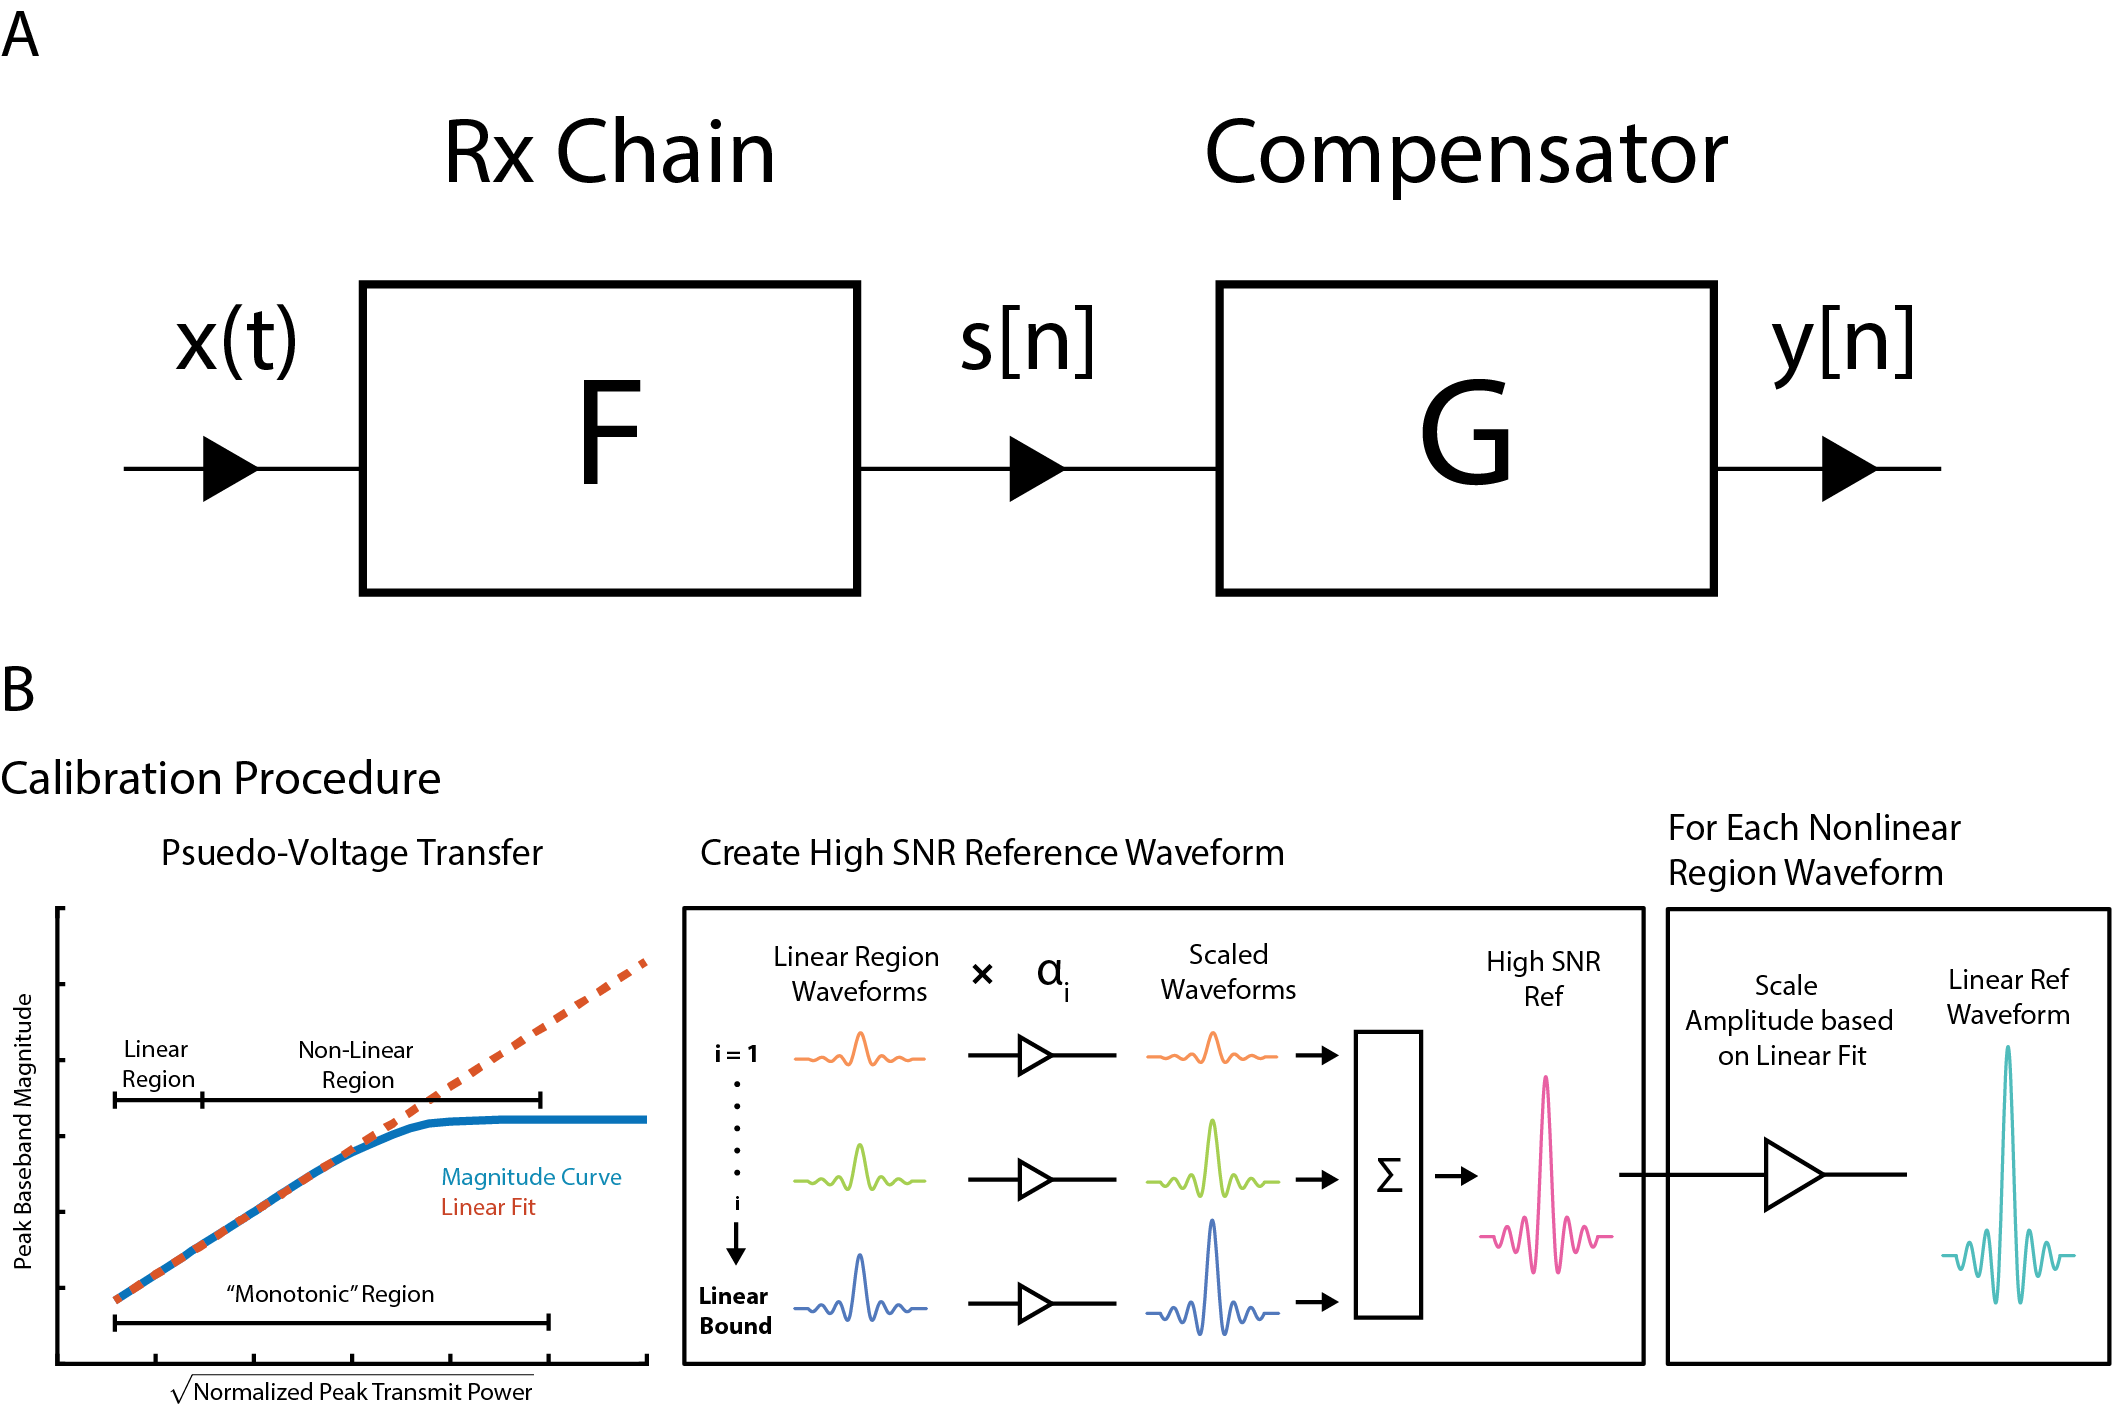
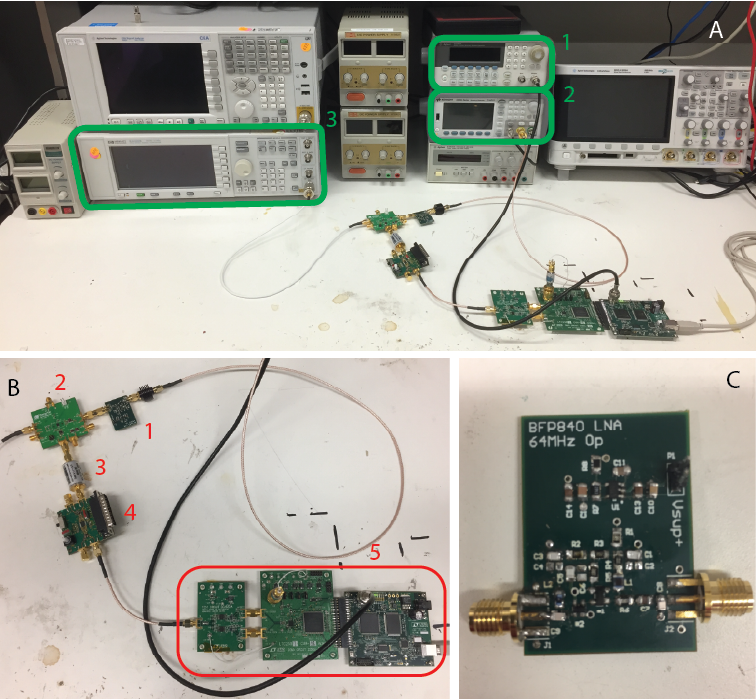
Figure 3: A) 1. Pulse Generator triggers ADC acquisition 2. Arbitrary Waveform Generator generates RF pseudo coil signal from baseband IQ data 3. RF Signal Generator generate local oscillator signal (53.3MHz). B) Receive Chain: 1. 1.9mA SiGe Pre-amp 2. PE4151 Active Mixer evaluation board 3. Minicircuits SBP-10.7+ bandpass filter 4. AD8369 Variable Gain Amplifier 5. Data Acquisition System: DC2622A Driver, LT2387-18 Eval Board, and DC718C Data Acquisition Board C) 1.9mA SiGe Amplifier.