1998
Simultaneous molecular 68Ga-PRDG2 and perfusion PET-MR imaging in a patient with sickle cell disease
Chan Hong Moon1, Carolyn Anderson1,2,3,4,5, Sina Tavakoli 5,6, Tiffany Pham 6, Lydia Perkins5, Lynda Little-Ihrig5, Neal Mason1, Xiaoyuan Chen7, Charles Laymon1,2, Mark Gladwin5, and Enrico Novelli 3,5
1Department of Radiology, University of Pittsburgh, Pittsburgh, PA, United States, 2Department of Bioengineering, University of Pittsburgh, Pittsburgh, PA, United States, 3Department of Pharmacology and Chemical Biology, University of Pittsburgh, Pittsburgh, PA, United States, 4Department of Chemistry, University of Pittsburgh, Pittsburgh, PA, United States, 5Department of Medicine, University of Pittsburgh, Pittsburgh, PA, United States, 6Gilead Sciences, Foster City, CA, United States, 7National Institute of Biomedical Imaging and Bioengineering, National Institutes of Health, Bethesda, MD, United States
1Department of Radiology, University of Pittsburgh, Pittsburgh, PA, United States, 2Department of Bioengineering, University of Pittsburgh, Pittsburgh, PA, United States, 3Department of Pharmacology and Chemical Biology, University of Pittsburgh, Pittsburgh, PA, United States, 4Department of Chemistry, University of Pittsburgh, Pittsburgh, PA, United States, 5Department of Medicine, University of Pittsburgh, Pittsburgh, PA, United States, 6Gilead Sciences, Foster City, CA, United States, 7National Institute of Biomedical Imaging and Bioengineering, National Institutes of Health, Bethesda, MD, United States
Synopsis
Sickle cell disease (SCD) causes vaso-occlusion, ischemia, and end-organ infarction that causes acute pain episodes, also known as vaso-occlusive crises (VOC). Understanding the mechanism underlying VOC is critical to identify patients at risk and for accurate diagnosis while in VOC. PET imaging with the probe 68Ga-PRGD2 that binds integrin αvβ3 identified areas of increased binding of sickle RBC to the endothelium in VOC. Simultaneous PET-MR imaging could provide additional information on tissue changes associated with VOC. Thus, we imaged a patient with SCD with 68Ga-PRGD2 in combination with MRI by using PET-MR 3T scanner.
Introduction
Sickle cell disease (SCD) is caused by the polymerization of a mutated hemoglobin molecule (HbS) upon deoxygenation. The polymerized HbS distorts red blood cells into sickle-shaped cells which causes a cascade of proinflammatory events that lead to hyperadhesion of red blood cells onto the endothelium. These processes collectively result in sudden pain episodes referred to as vaso-occlusive crises (VOC) [1]. Novelli et al demonstrated dynamic PET imaging of integrin αvβ3 with 68Ga-PRGD2 probe could successfully image hyperadhesion associated with VOC in a SCD patient [2]. On the other hand, blood flow plays a critical role in VOC as fast-moving red blood cells are better able to escape the venous microcirculation before HbS polymerization ensues [3]. Simultaneous PET-MR scan facilitates physiological and molecular as well as structural imaging at coregistered imaging spaces. In this study, 68Ga-PRGD2 PET and MR images were acquired simultaneously from a SCD patient at baseline and in VOC by using PET-MR 3T scanner. We compared the blood activity and perfusion/flow measurements in femoral vessels at between baseline and VOC condition.Methods
The study included a female patient (29 year old) with homozygous SCD (HbSS, sickle cell anemia). The study was approved by the IRB and the participant provided informed consent. The scans were performed using a PET-MR 3T scanner (Biograph mMR, Siemens Healthineers) at baseline and in VOC. The subject was set in head-first and supine position, and spine coils and body matrix coil were installed for thigh imaging. The 68Ga-PRGD2 tracer was injected at a dose of 93 and 114 MBq at baseline and in VOC, respectively, and PET data acquired for 90min. PET reconstruction is described in Novellie et al [2]. MR images were simultaneously acquired during PET acquisition. MR protocol incudes T1 (TR/TE 600/20 ms, pixel resolution 0.8-mm and slice thickness 5 - 8 mm, axial and coronal views), T2 with fat saturation (TR/TE 5271/85 ms) and STIR (TR/TE/TI 6000/39/200 ms, pixel resolution 1×1×8 mm3); acceleration factor 2 applied for all. Intravoxel incoherent motion (IVIM) diffusion weighted imaging was applied to acquire perfusion/flow in vessels of thigh [4] with b-values of 0, 5, 10, 15, 20, 50, 100, 150, 200, 300 and 600 s/mm2 at 3×3 mm2 pixel resolution and 7 mm slice thickness. Biexponential curve fit was applied to measure the perfusion fraction following Sb/S0 = (1-f)*exp(-b*D) + f*exp(-b*[D+PD]), where, f(perfusion fraction,%), D (diffusion coefficient, 10-3 mm2/sec), PD (pseudo diffusion coefficient, 10-3 mm2/sec). Both PET and MR images were converted to an analyze format for post-processing and analysis. PET activity changes were measured in ROI of bone, vessels and rectus femoris; the bone region was segmented based on the T1 image by using region growing to include whole imaging volume, and muscle’s and vessels’ ROI was selected in a representative slice of the middle of the thigh. To minimize partial volume artifacts in the PET image, particularly in vessels due to the small size compared to effective resolution of the PET image, > 5 mm, maximum pixel’s intensities within the ROIs were selected; otherwise, the intensity values within the ROIs were all averaged.Results
Targeted ROI regions (vessel, fat, muscle & bone) in the thigh could be well delineated by using T1 and STIR MR images (Fig. 1A,1B). Dynamic features of 68Ga-PRGD2 PET signal were well described in 90min PET scan – including peak blood concentration of 68Ga-PRGD2; post-peak of tracer in the blood; tracer accumulation phases in the tissue (Fig. 1C). High 68Ga-PRDG2 signals were found in the regions of bone and vessel which are well co-registered to the MR anatomy, and high perfusion or flow was observed in vessel – but no significant diffusion coefficient (Fig. 2). The perfusion in the vessel was decreased during VOC compared to baseline (Fig. 3C vs. D). The 68Ga-PRDG2 PET signal in the vessel seemed to increase during VOC (Fig. 3A vs. B) – but it was not clear whether this was because of the different dose of tracer injected or it is transient feature. For further analysis, the PET time-course data in the bone and vessel was normalized to that in the muscle; the normalized 68Ga-PRDG2 signal in the vessel decreased while that in the bone increased – mirroring changes of perfusion by MR in the vessel (Fig. 4).Discussion/Conclusions
Simultaneous 68Ga-PGRD2 PET-MR imaging successfully demonstrated hyperadhesion associated with VOC in the femoral bone, and also reduced perfusion/flow in the vessel. Although a transiently higher initial blood pool 64Ga-PRGD2 activity was found in the vessels in VOC, the activity decreased to a lower level than baseline, which is consistent with perfusion/flow decrease in the vessels. It is unclear whether the PET and MR signal sources originate from the femoral artery or vein due to the current PET and MR imaging resolution. It is possible the vaso-occlusion in bone/tissue capillary beds could cause reduced blood inflow to the vascular bed we imaged or reduced blood outflow. Further evaluation of IVIM perfusion MR measurements will need to be validated by comparison with standard dynamic contrast MRI.Acknowledgements
This work was supported by University of Pittsburgh Heart Lung and Blood Vascular Medicine Institute P3HVB grant, 3R21CA180211-02S1, and funding from The Pittsburgh Foundation.References
1. Sundd et al, Annu Rev Pathol (2019); 2. Novelli et al, Bjr Case Reports (2020); 3. Veluswamy et al, J Clin Medicine 2019; 4. Le Bihan, NeuroImage (2017)Figures
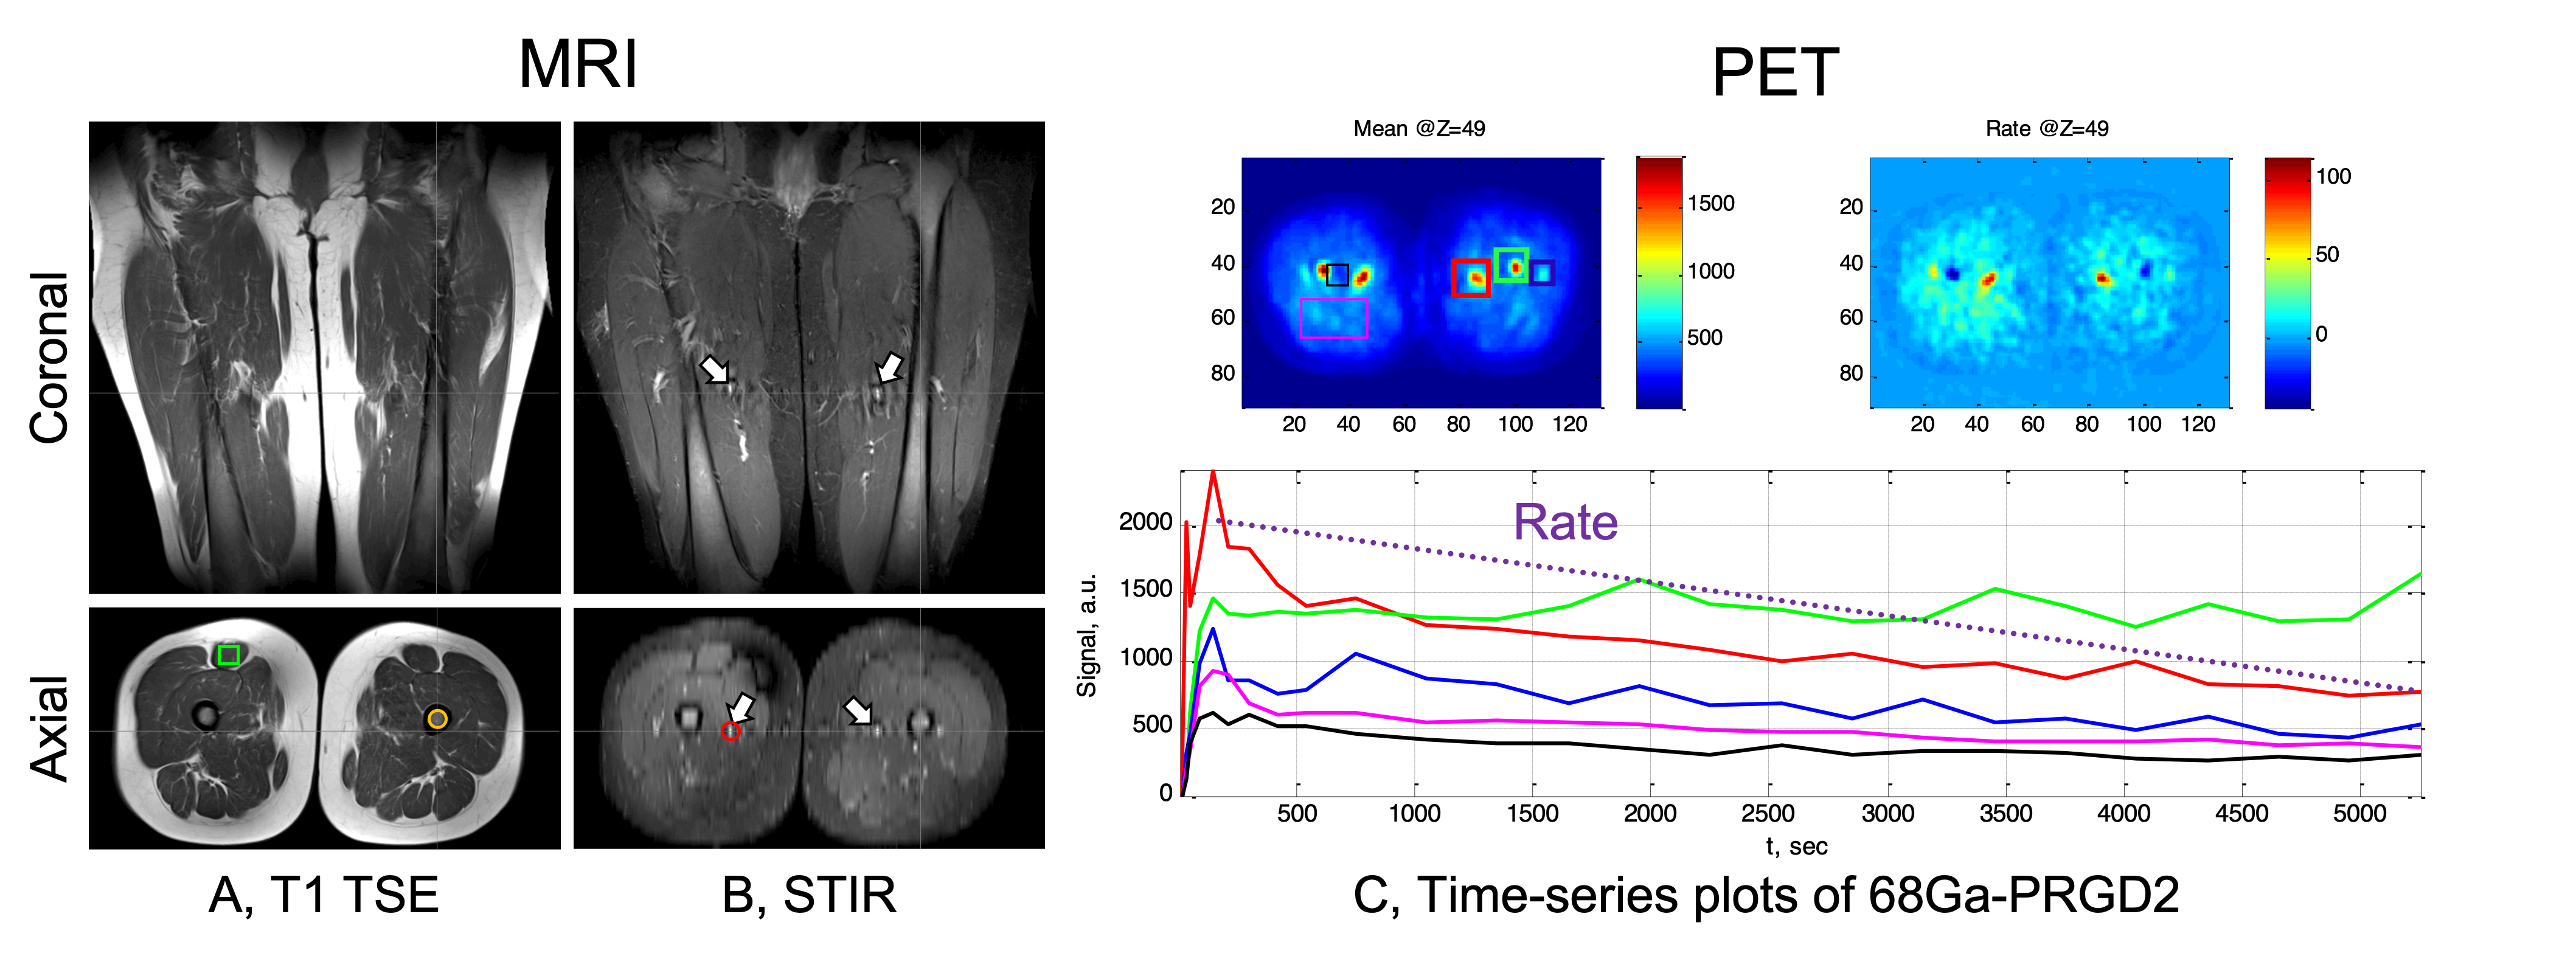
Fig. 1 Structural anatomy MR images – T1 TSE (A) and STIR (B). T1 image generally shows overall good anatomical features such as fat, muscle and bone, while STIR shows highly contrasted vessels to surrounding muscles (see white arrows in B). Exemplary ROIs of rectus femoris muscle (green box), bone (orange circle) and vessel (red circle) are marked. Dynamic change of 68Ga-PRGD2 PET signal over 90 min at different ROIs (C). Various dynamic features can be generated from the curve, for example, accumulation or accumulation rate (see two insets).
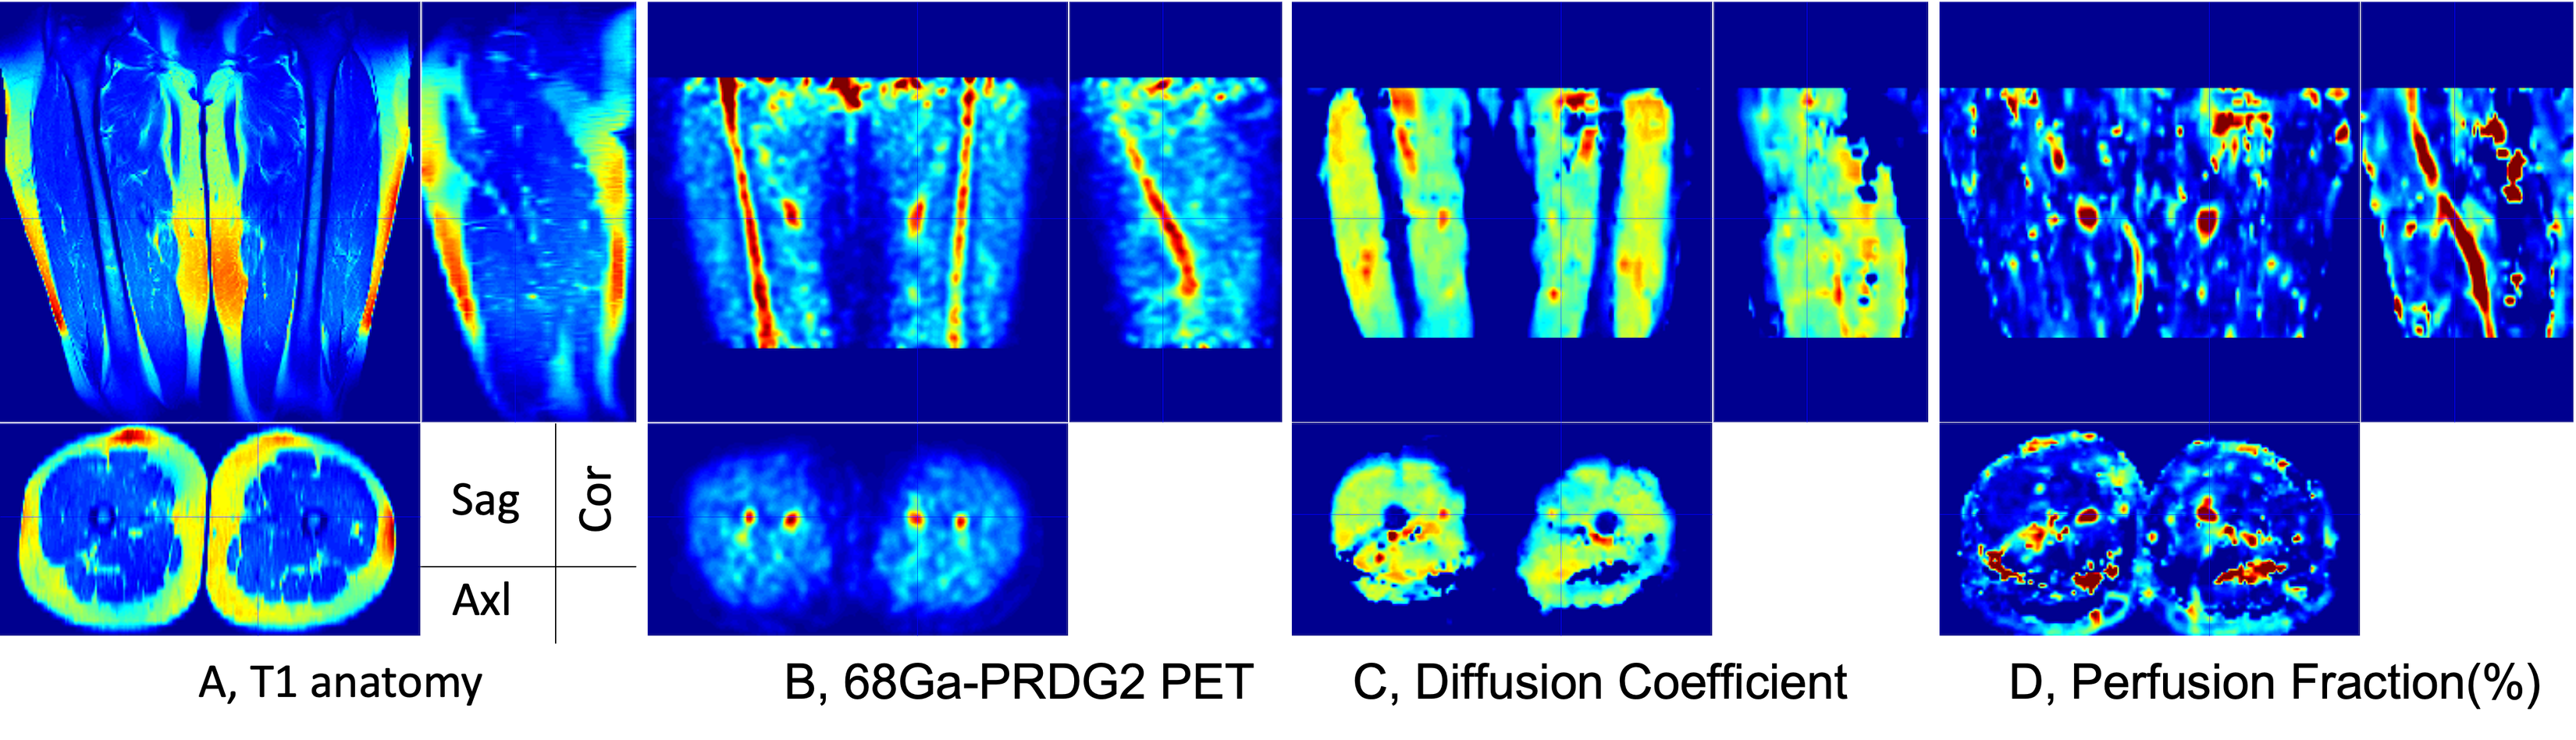
Fig. 2 PET-MR images from one SCD patient – T1 anatomy (A), 68Ga-PRGD2 PET (B), diffusion (C), and perfusion image (D). Note that high 68Ga-PRGD2 regions are bone and vessels, and high perfusion is observed in the vessel – but no significant diffusion is found.
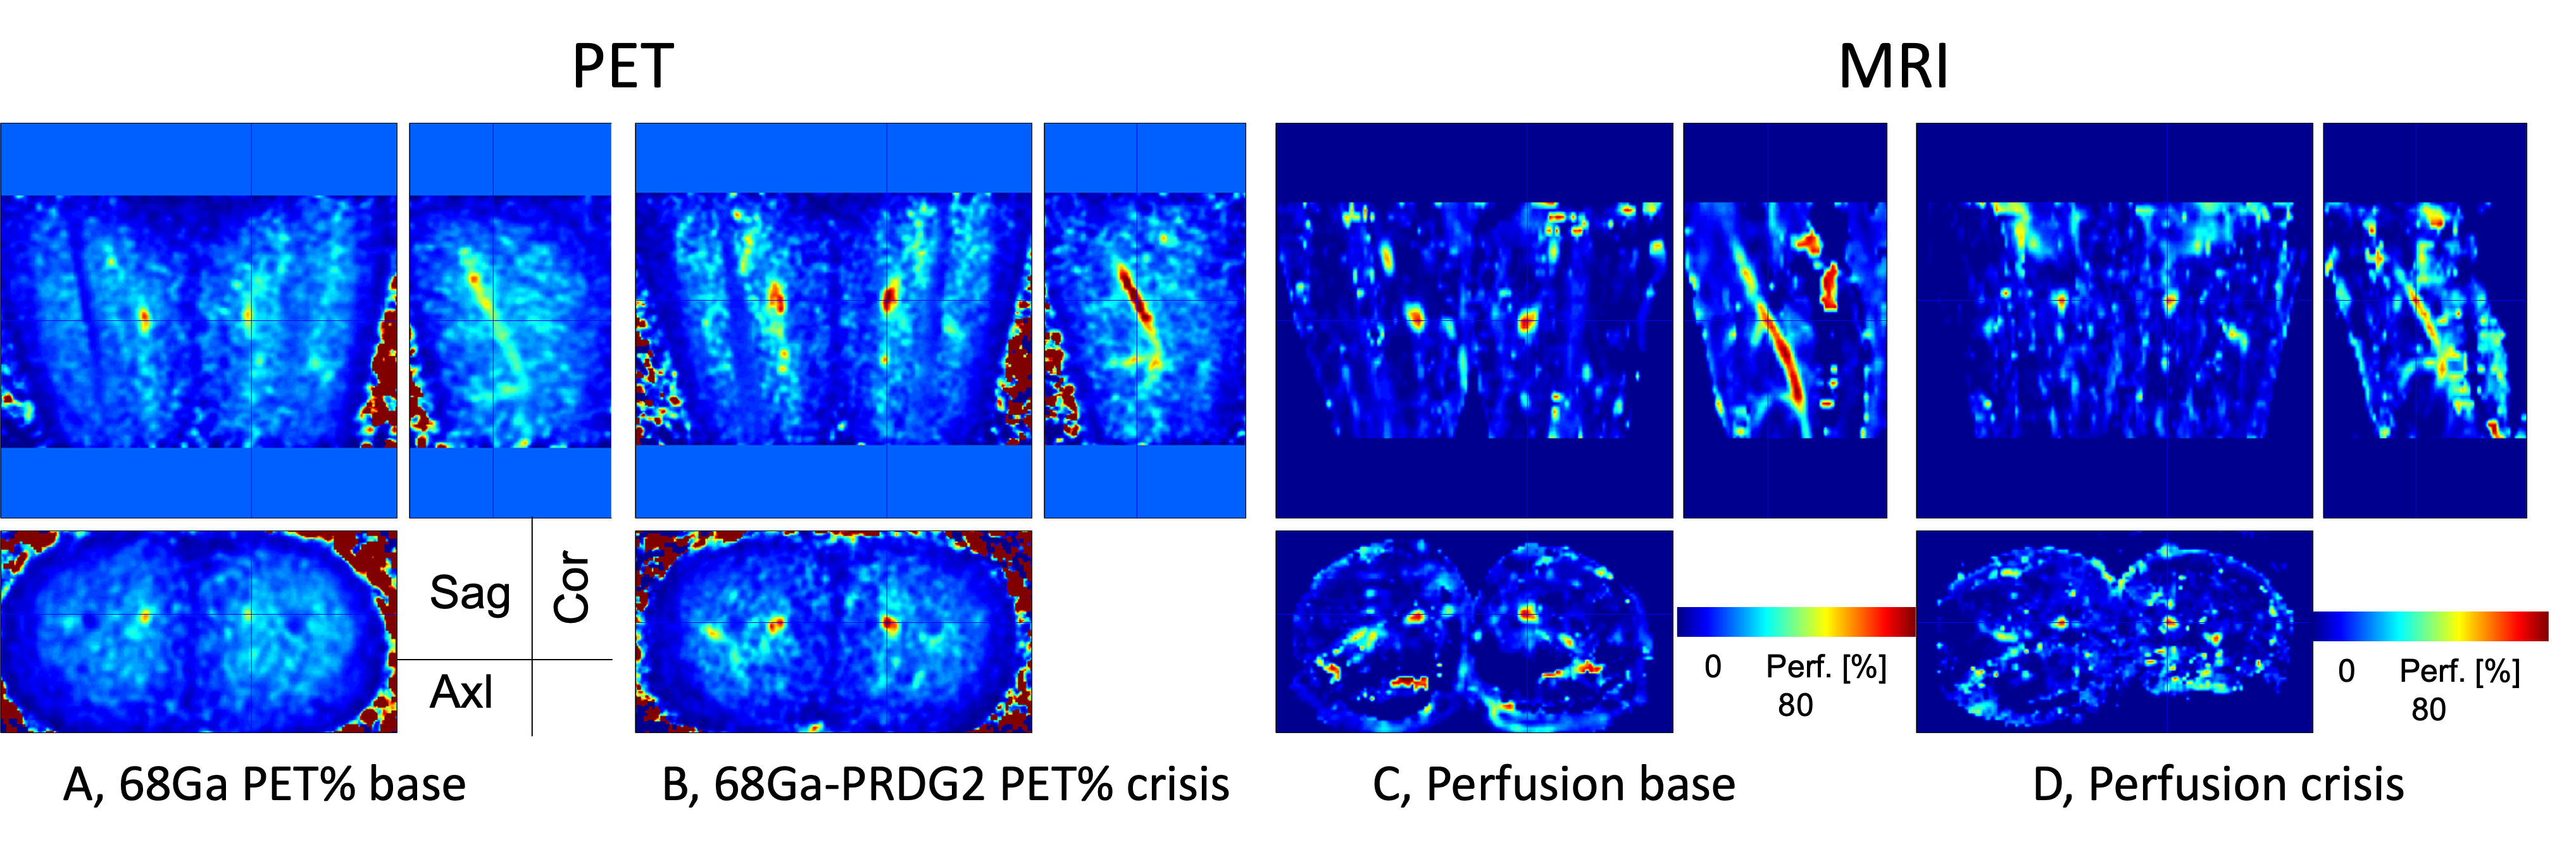
Fig. 3 Comparison of 68Ga-PRGD2 total accumulation (A vs. B) and MR perfusion (C vs. D) of a SCD patient during baseline and VOC. It is noted that the perfusion in vessel decreases during VOC compared to baseline.
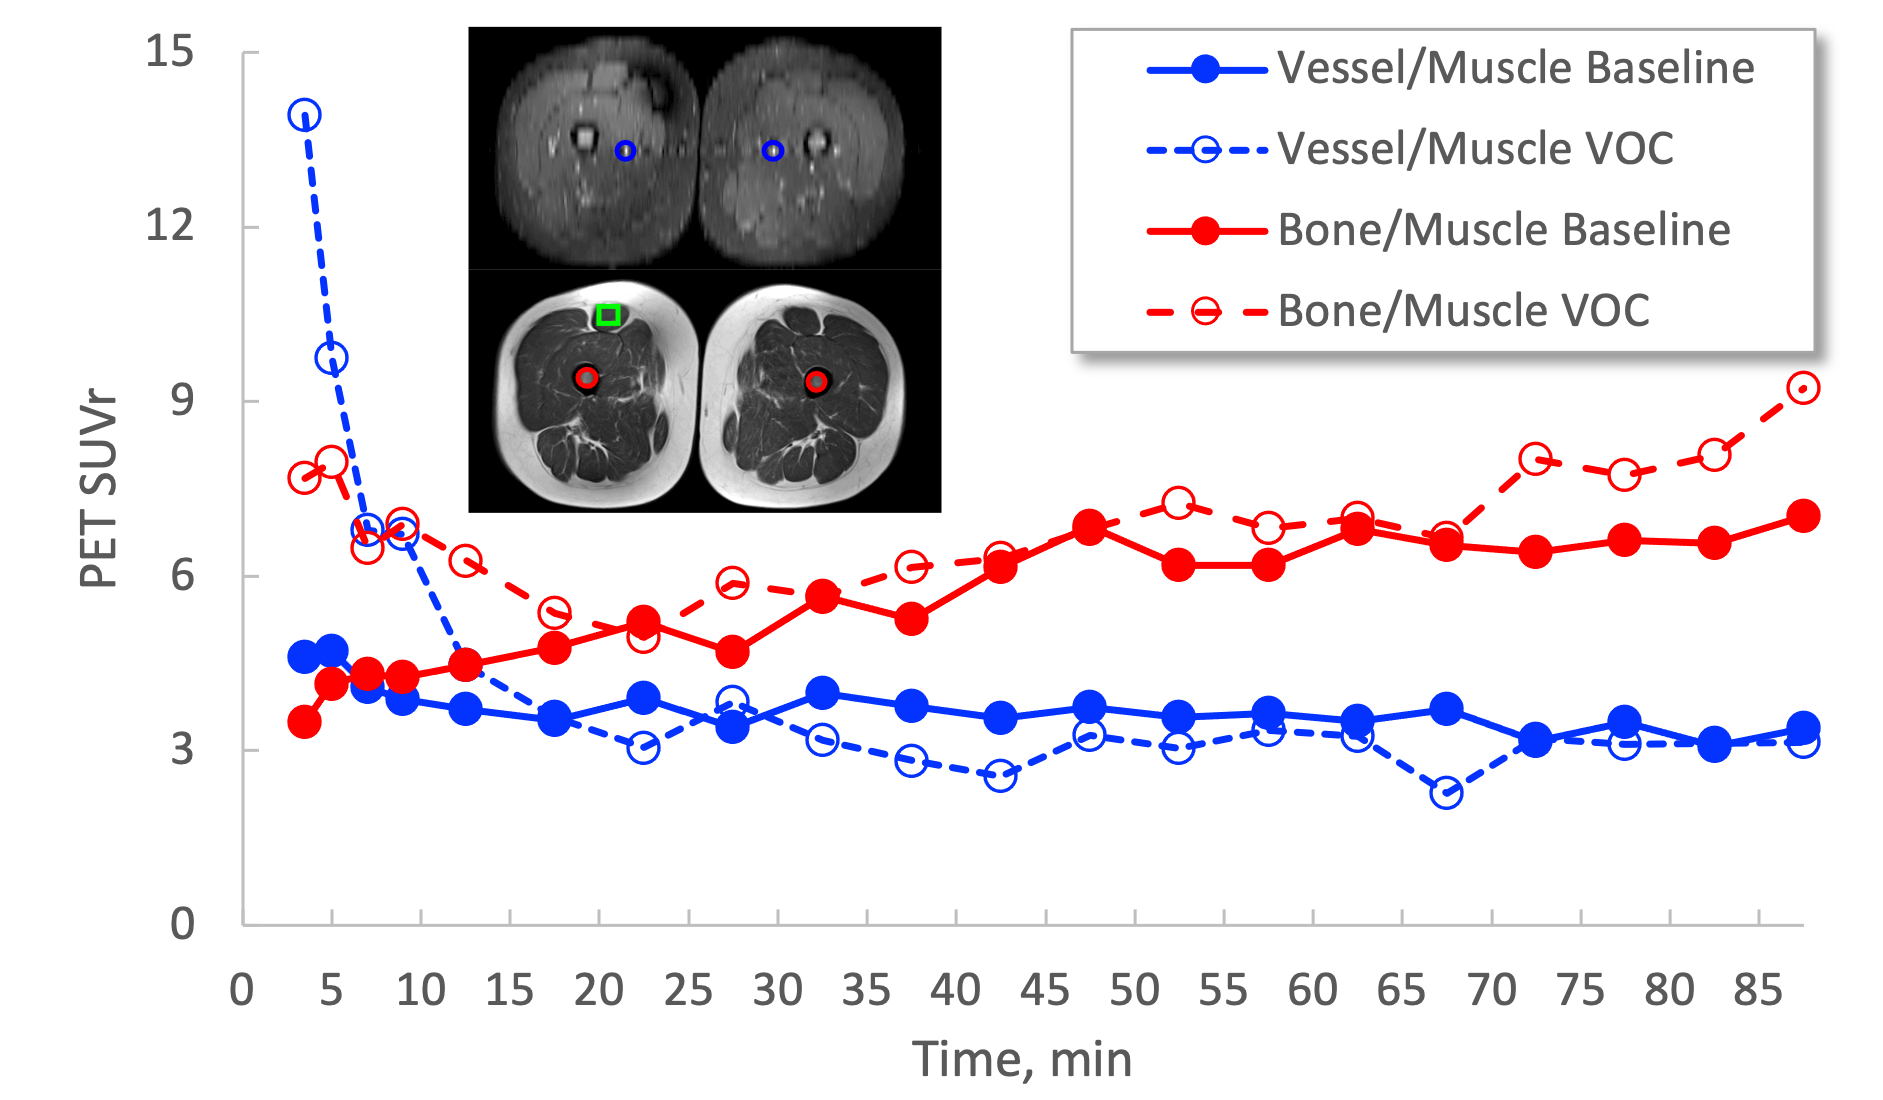
Fig. 4 Time plots of 68Ga-PRGD2 PET signal in bone and vessel normalized with that in muscle – Bone/muscle plots are reproduced from Novelli et al [2]. PET signal in vessel (blue trajectories) during VOC decreases in steady-state condition, > 20min post-injection, while that in bone (red trajectories) increases compared to that at the baseline.
DOI: https://doi.org/10.58530/2022/1998