1996
GlucoCEST under the influence of head motion at 3 T: A numerical head phantom1Department of Medical Radiation Physics, Lund University, Lund, Sweden, 2Philips Healthcare, Copenhagen, Denmark, 3Lund University Bioimaging Centre, Lund University, Lund, Sweden, 4BioMedical Engineering and Imaging Institute, Icahn School of Medicine at Mount Sinai, New York, NY, United States, 5Russell H. Morgan Department of Radiology and Radiological Science, Johns Hopkins University School of Medicine, Baltimore, MD, United States, 6F.M. Kirby Research Center for Functional Brain Imaging, Kennedy Krieger Institute, Baltimore, MD, United States, 7Siemens Healthcare GmbH, Erlangen, Germany, 8Siemens Healthcare AB, Malmö, Sweden, 9Department of Radiology, Lund University, Lund, Sweden, 10Department of Medical Imaging and physiology, Skåne University hospital, Lund, Sweden
Synopsis
D-glucose is proposed as a cheap biodegradable alternative to gadolinium-based contrast agents. By performing glucoCEST imaging during and after administration of glucose, an approach referred to as dynamic glucose-enhanced (DGE) MRI, information about glucose delivery and uptake can be obtained. However, the small DGE signal changes at 3 T can easily be corrupted by motion. Furthermore, standard retrospective motion correction may erroneously alter true DGE signal, which may lead to misinterpretation. We designed a numerical head phantom that can be used for validation of motion correction and providing insight into the corresponding effects in vivo.
Introduction
Dynamic glucose-enhanced (DGE) MRI is a chemical exchange saturation transfer (CEST) method for dynamically studying glucose uptake and delivery, which is determined by tissue perfusion, transport and metabolism [1-4]. However, at the clinical field strength 3T, the effects on the MR signal are small (~1 % water signal). Consequently, artefacts due to subject motion can be mistaken for CEST effects, whereas motion correction may erroneously alter true DGE signal [5,6]. This can lead to misinterpretation of the true glucoCEST effect. We aimed to design a numerical human head phantom to simulate a realistic DGE MRI protocol at 3 T. This can be used for assessing the influence of head movement on the measured signal both before and after retrospective motion correction.Methods
A simulation pipeline (Fig. 1A) was designed using segmentations of grey matter (GM), white matter (WM), veins (V), arteries (A), lateral ventricles (LV), CSF, and tumor tissue (glioblastoma, (GB)), based on an MPRAGE of a patient. Bloch-McConnell simulation-based Z-spectra (Fig. 2A) (B1 = 1.6 μT) at 3 T were constructed for five hydroxyl protons exchanging with bulk water (three at 1.2 ppm, one each at 2.2 ppm and 2.8 ppm). 10 mM D-glucose concentration change in venous and arterial blood on top of 5 mM baseline concentration, ¼ of this in GM and WM tissue [7,8] and 60 % of vessels in CSF [9] was assumed. In the tumor, a vessel volume of 8 % together with an extravascular extracellular space (EES) of 25 % tumor were assumed, leading to a 33 % concentration change of 10 mM [10,11]. Increased lactate production in the tumor leads to a lower pH in EES [12], increasing transverse relaxivity from 0.012 s-1 mM-1 to 0.014 s-1 mM-1 according to Swift-Connick [13]. Magnetization transfer contrast (MTC) based on semisolid macromolecular protons with concentrations of 5500 mM, 15400 mM and 2750 mM for GM, WM and tumor, respectively, was assumed. GlucoCEST curves were simulated (20 s long S0, 670 s long Ssat, 5 s temporal resolution, infusion-start after 140 s) based on DGE response curves observed at 3 T using a prototype sequence (MAGNETOM Prisma, Siemens Healthcare, Erlangen, Germany) [3,5,7,14]. Z-spectra were combined with the corresponding glucoCEST curves creating dynamic Z-spectra under the influence of D-glucose infusion and applied to the corresponding tissue segmentations. Using Elastix [15,16], rigid body motion estimates were derived from a patient (Fig. 1B). Additional motion in LVs can show a relative volume modulation of 1 % due to cardiac pulsation and D-glucose loading adds ventricular dilatation by about 2.4 % [5,17,18]. This non-rigid LV movement was simulated by adding an affine transformation with a dynamically changing scaling coefficient to the LV segmentation (Fig. 1B, right). Tissue segmentations were used to create a relative magnetic susceptibility head model. Rigid body motion parameters were then applied, creating a susceptibility time series. The static magnetic field was then numerically estimated [19,20]. First-order static image-based shimming was simulated. Transformation to the patient’s frame of reference by using the inverse motion trajectory leads to motion-related field changes in the head frame of reference. The corresponding voxel of the dynamic Z-spectra and field changes at an offset of 2 ppm creates a single offset time series of SSat(t). The initial rigid body motion parameters were applied, and the image time series was down-sampled to 2´2´3 mm3. Smoothing and Rician noise were added with a standard deviation of 0.01 % DGE signal change. Retrospective motion correction was applied using Elastix. DGE signal SDGE(t) is given by$$S_{DGE}(t)=\frac{S_{base}-S_{sat}(t)}{S_{0}},$$
were Sbase is the average baseline signal, SSat (t) the saturated signal and S0 the average non-saturated signal. Averaged area under curve (AUC) maps were created according to
$$AUC_{mean}=\frac{\sum_0^tS_{DGE}(t)}{N},$$
for baseline, during infusion (0-245 s) and two post-infusion time intervals (240-305 s, 305-445 s). ROIs were drawn for WM and tumor to extract the dynamic response (Fig. 5).
Results and Discussion
The simulated Z-spectra (Fig. 2A) lead to ground truth AUC maps (Fig. 2C) showing a clear dynamic tissue response, where the estimated DGE signal is SDGE, A = 1.11 %, SDGE, V = 0.51 %, SDGE, GM = 0.28 %, SDGE, WM = 0.06 %, SDGE, CSF = 0.90 % and SDGE, GB = 0.38 % (Fig. 2B, right). Added motion (Fig. 1B) introduces strong artefacts (pseudo-CEST effect) in terms of hypo- and hyperintensities at tissue interfaces (Fig. 3). Isolated motion-induced B0 changes tend to decrease the DGE signal inferiorly and increase it superiorly, as shown in the sagittal slice direction (Fig.4). This leads to a signal decrease for especially white matter (Fig. 5B), which cannot be recovered after correction. Tumor tissue is partially recovered after correction, but with reduced effect in comparison to the ground truth (Fig. 5A). More structure leads inherently to more residual artefacts overlaid with low spatial frequency variations due to field changes. Similar findings have been reported in vivo [5,6].Conclusion
True glucoCEST effects can be corrupted by motion artefacts often leading to B0 shifts. Designing advanced post-processing methods using retrospective motion correction including B0 correction will be crucial for implementation into the clinic. Our proposed phantom can be used to facilitate the optimization of such techniques.Acknowledgements
References
1. Chan KW, McMahon MT, Kato Y, et al. Natural D-glucose as a biodegradable MRI contrast agent for detecting cancer. Magn Reson Med 2012;68(6):1764–1773.
2. Walker-Samuel S. Ramasawmy R. Torrealdea F. et al. In vivo imaging of glucose and metabolism in tumors. Nature Medicine. 2013;19:1067-1072.
3. Xu X, Yadav NN, Knutsson L, et al. Dynamic Glucose-Enhanced (DGE) MRI: Translation to Human Scanning and First Results in Glioma Patients. Tomography 2015;1(2):105-14.
4. Schuenke P. Paech D. Koehler C. et al. Fast and Quantitative T1rho-weighted Dynamic Glucose Enhanced MRI. Sci Rep. 2017 Feb;7:42093.
5. Seidemo A. Lehmann PM. Rydhög A. et al. Towards more robust glucoCEST imaging in humans at 3 T: A study of the arterial input function and the effect of infusion time. NMR in Biomedicine. 2021;e4624.
6. Zaiss M. Herz K. Deshmane A. et al. Possible artifacts in dynamic CEST MRI due to motion and field alterations. J Magn Reson 2019;298:16-22.
7. Xu X, Sehgal AA, Yadav NN. et al. d-glucose weighted chemical exchange saturation transfer (glucoCEST)-based dynamic glucose enhanced (DGE) MRI at 3T: early experience in healthy volunteers and brain tumor patients. Magn Reson Med. 2019;00:1–16.
8. Gruetter R, Ugurbil K, Seaquist ER, Steady-State Cerebral Glucose Concentrations and Transport in the Human Brain. Journal of Neurochemistry. 1998;70(1):397-408.
9. Karen R. Principles of neurologic infectious diseases. New York: McGraw-Hill, Medical Pub. Division. p. 4. ISBN 0-07-140816-9. 2005.
10. Lüdemann L, Grieger W, Wurm R, et al. Glioma Assessment Using Quantitative Blood Volume Maps Generated by T1-Weighted Dynamic Contrast-Enhanced Magnetic Resonance Imaging: A Receiver Operating Characteristic Study. Acta Radiologica. 2006;47(3):303-310.
11. Mills SJ, Soh C, Rose CJ, et al. Apparent Diffusion Coefficient and Dynamic Contrast-Enhanced MR Imaging-Derived Measurement of the Volume of the Extravascular Extracellular Space in Glioblastoma Multiforme. American Journal of Neuroradiology. 2010;3(3):549-553.
12. Warburg O. On the origin of cancer cells. Science. 1956;123:309-314.
13. Yadav N. Xu J. Bar-Shir A. et al. Natural D-Glucose as a Biodegradable MRI Relaxation Agent. Magnetic Resonance in Medicine. 2014;72:823-828.
14. Knutsson L, Seidemo A, Rydhög Scherman A, et al. Arterial Input Functions and Tissue Response Curves in Dynamic Glucose-Enhanced (DGE) Imaging: Comparison Between glucoCEST and Blood Glucose Sampling in Humans. Tomography 2018;4(4):2379-1381.
15. Klein M. Staring K. Murphy M.A. et al. elastix: a toolbox for intensity based medical image registration. IEEE Transactions on Medical Imaging 2019;29(1):196-205.
16. Shamonin DP. Bron EE. Lelieveldt BPF. et al. Fast Parallel Image Registration on CPU and GPU for Diagnostic Classification of Alzheimer's Disease. Frontiers in Neuroinformatics 2014;7(50):1-15.
17. Puri B. Lewis H. Saeed N. et al. Volumetric change of the lateral ventricles in the human brain following glucose loading. Experimental Physiology. 1999;84:223-226.
18. Zhu D. Xenos M. Linninger A. et al. Dynamics of lateral ventricle and cerebrospinal fluid in normal and hydrocephalic brains. Journal of Magnetic Resonance Imaging. 2006;24:756-770.
19. Marques JP, R. Bowtell. Application of a Fourier-Based Method for Rapid Calculation of Field Inhomogeneity Due to Spatial Variation of Magnetic Susceptibility. Concepts in Magnetic Resonance Part B: Magnetic Resonance Engineering. 2005;25B:65-87.
20. Salomir R. Senneville BD. Moonen C. A Fast Calculation Method for Magnetic Field Inhomogeneity due to an Arbitrary Distribution of Bulk Susceptibility. Concepts in Magnetic Resonance Part B: Magnetic Resonance Engineering. 2003;19B(1):26-34.
Figures
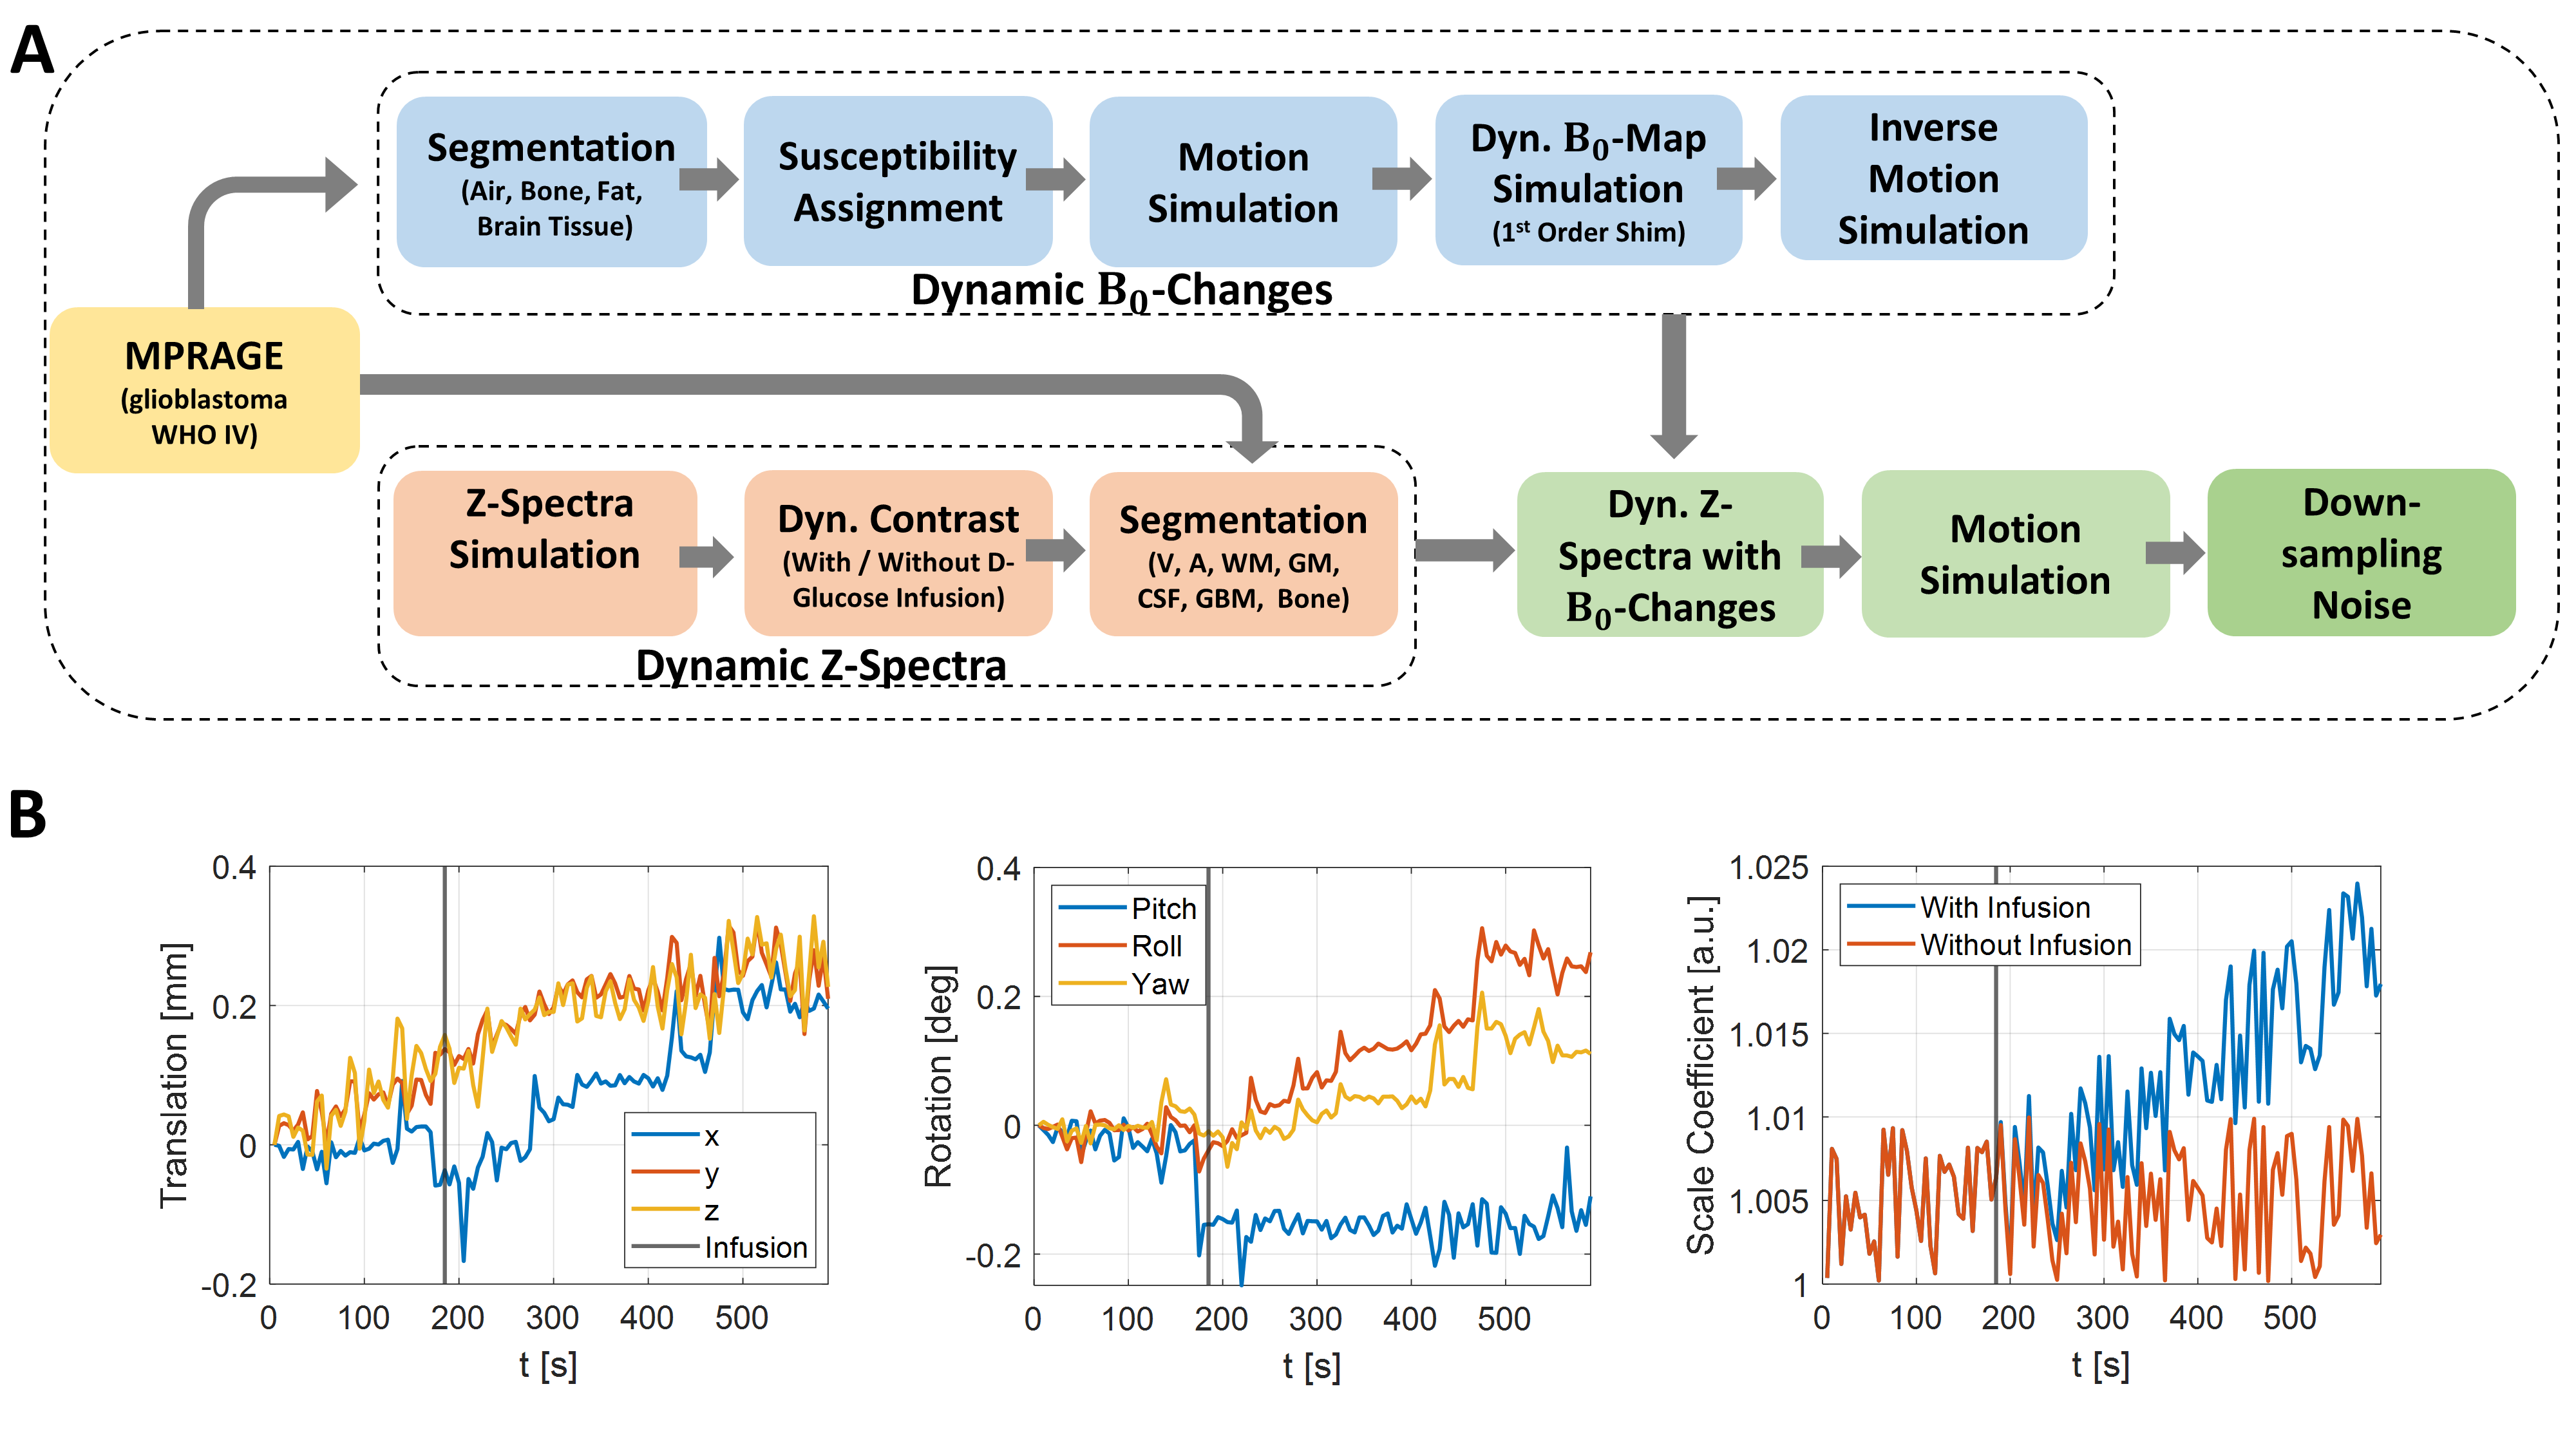
Figure 1:
(A): Design steps of the numerical head phantom framework illustrated in a chronologically ordered pipeline. The arrows indicate the order of the simulation steps.
(B): Parameters for
rigid (translation, rotation) and periodic (ventricular) motion simulation. On the right: Scale
coefficient for affine transformation of LVs changing over time due to cardiac
cycle with and without infusion, according to glucose uptake level.
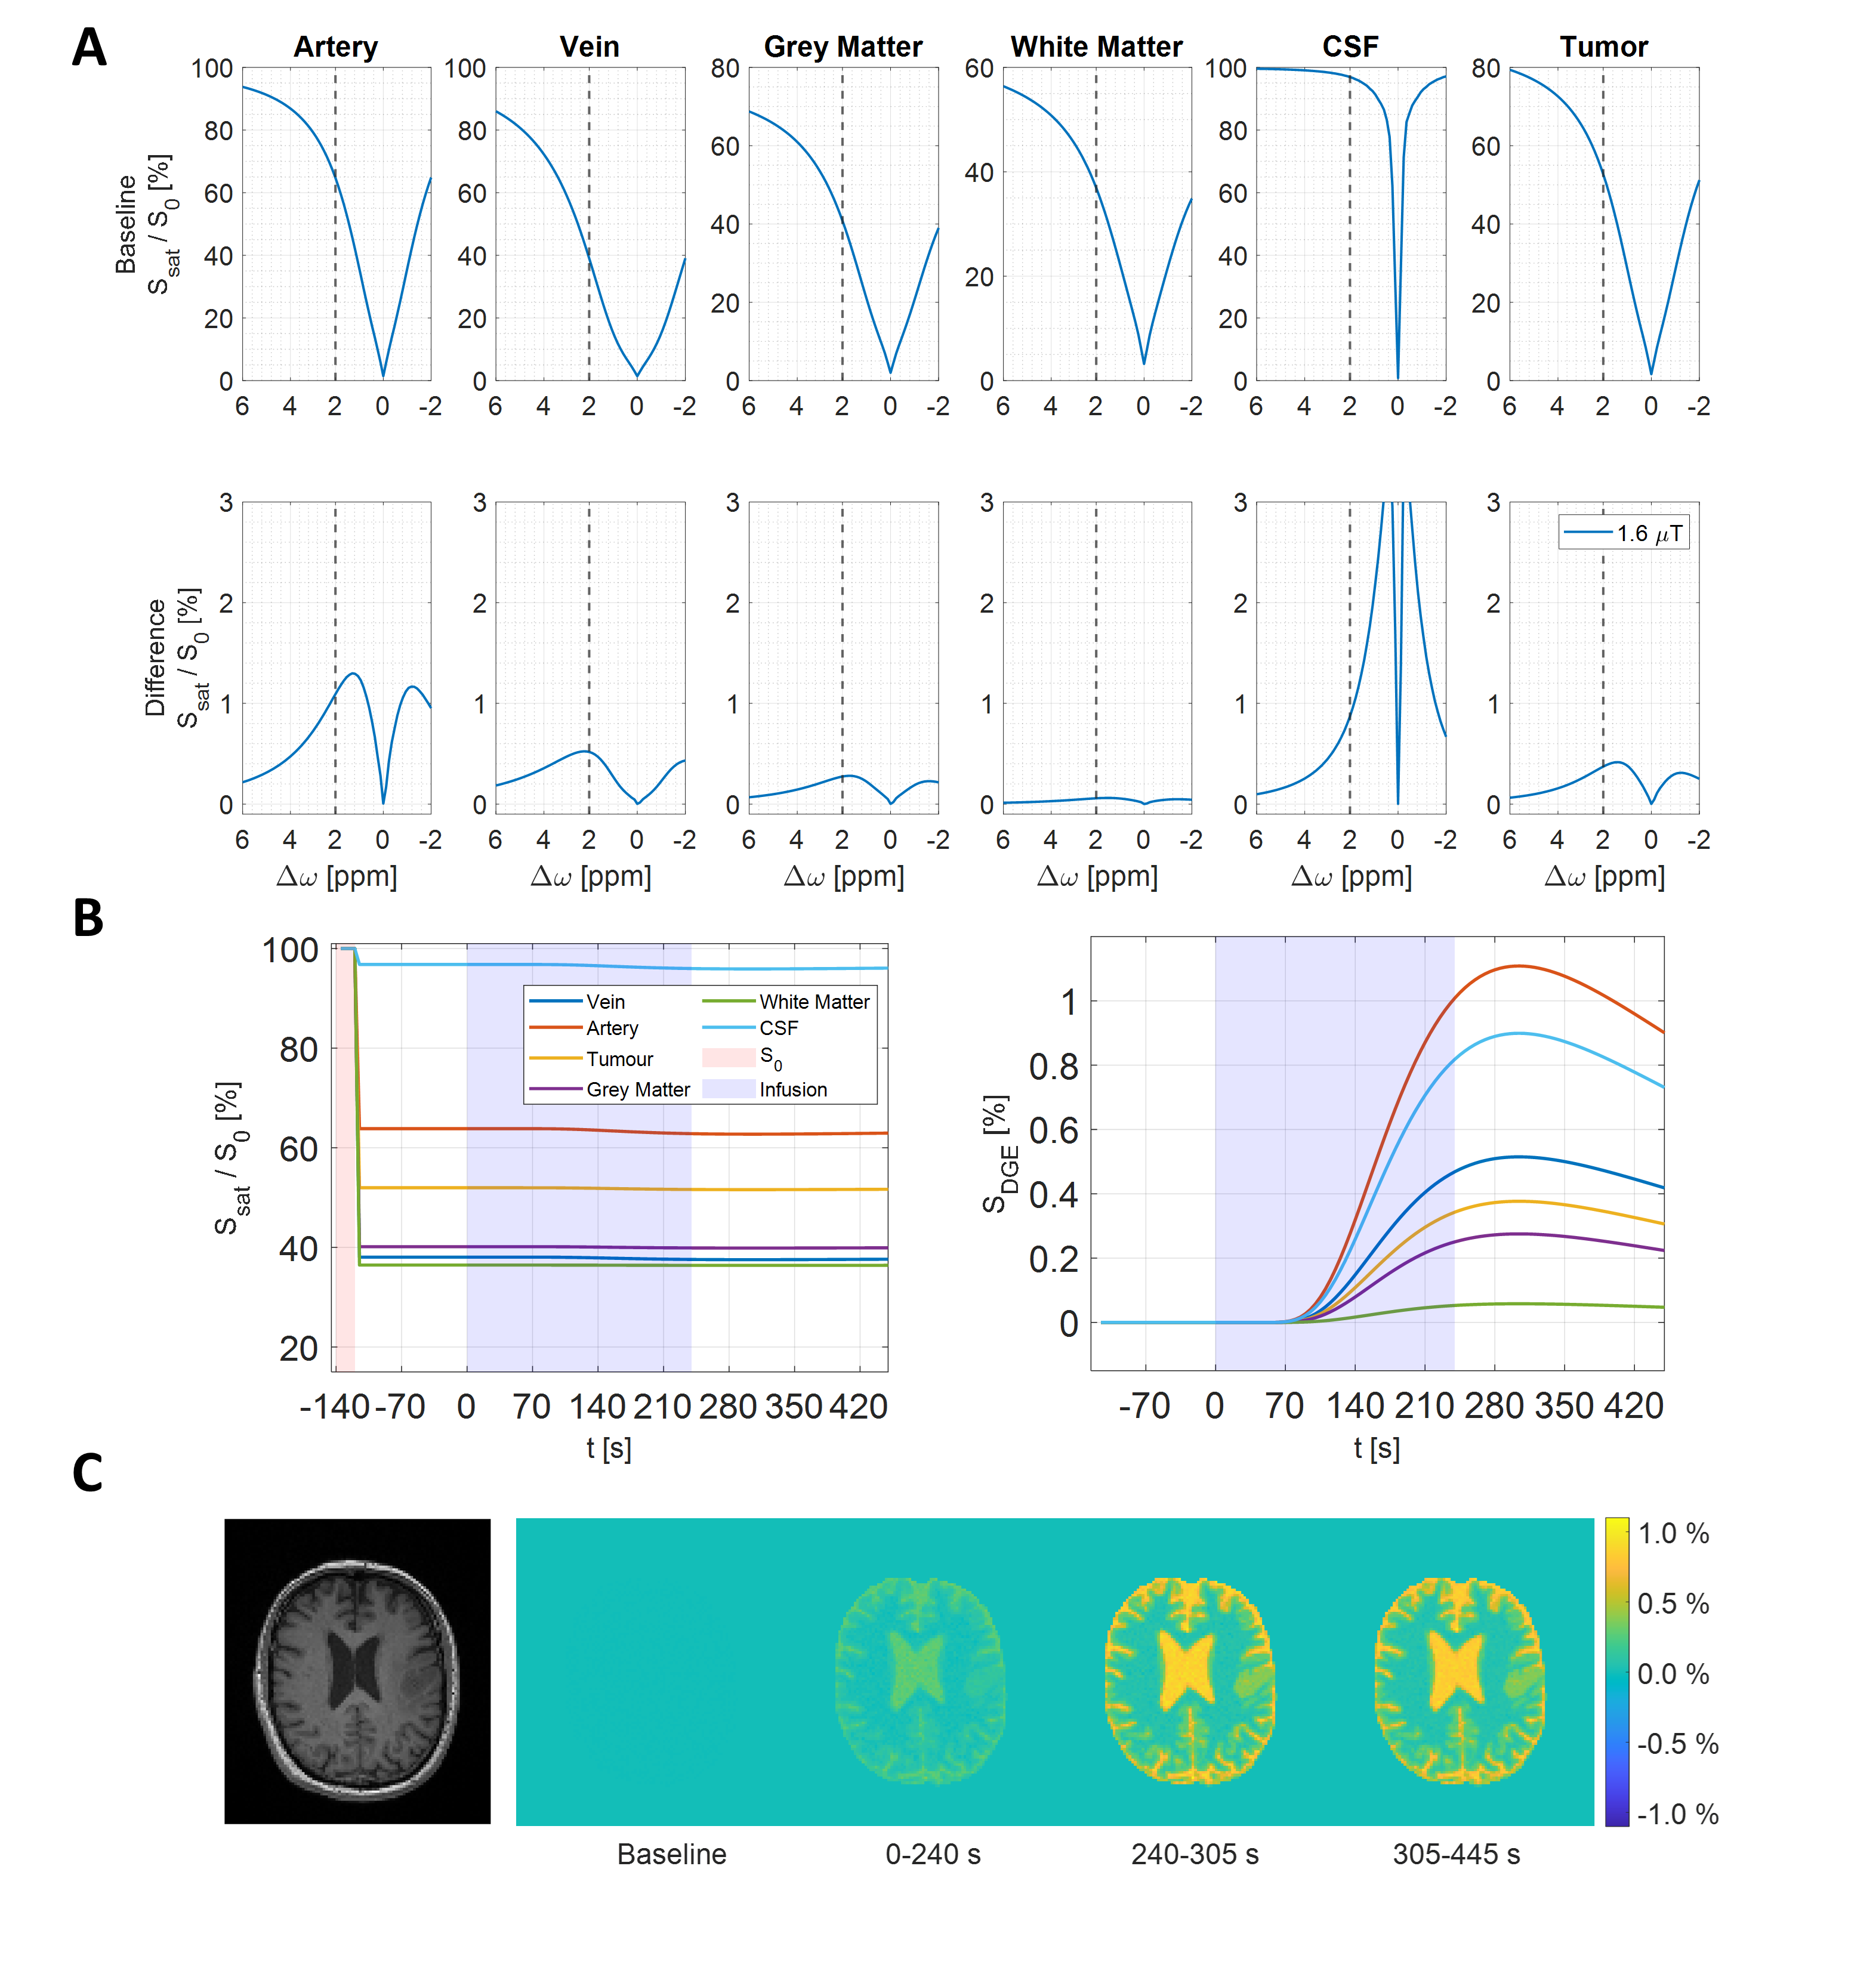
Figure 2:
(A, top row): Simulated Z-spectra (1.6 μT, tsat = 1 s) before glucose infusion, representing a baseline of 5 mM D-glucose. (A, bottom row) spectral differences between after and before infusion. (B, left): Simulated DGE normalized signal (Ssat/S0) curves at 2 ppm for veins, arteries, tumor, grey matter, white matter and CSF, including baseline, infusion and post-infusion periods. (B, right): Resulting DGE curves. (C, left): MPRAGE and (C, right) resulting AUCmean maps over time as ground truth.
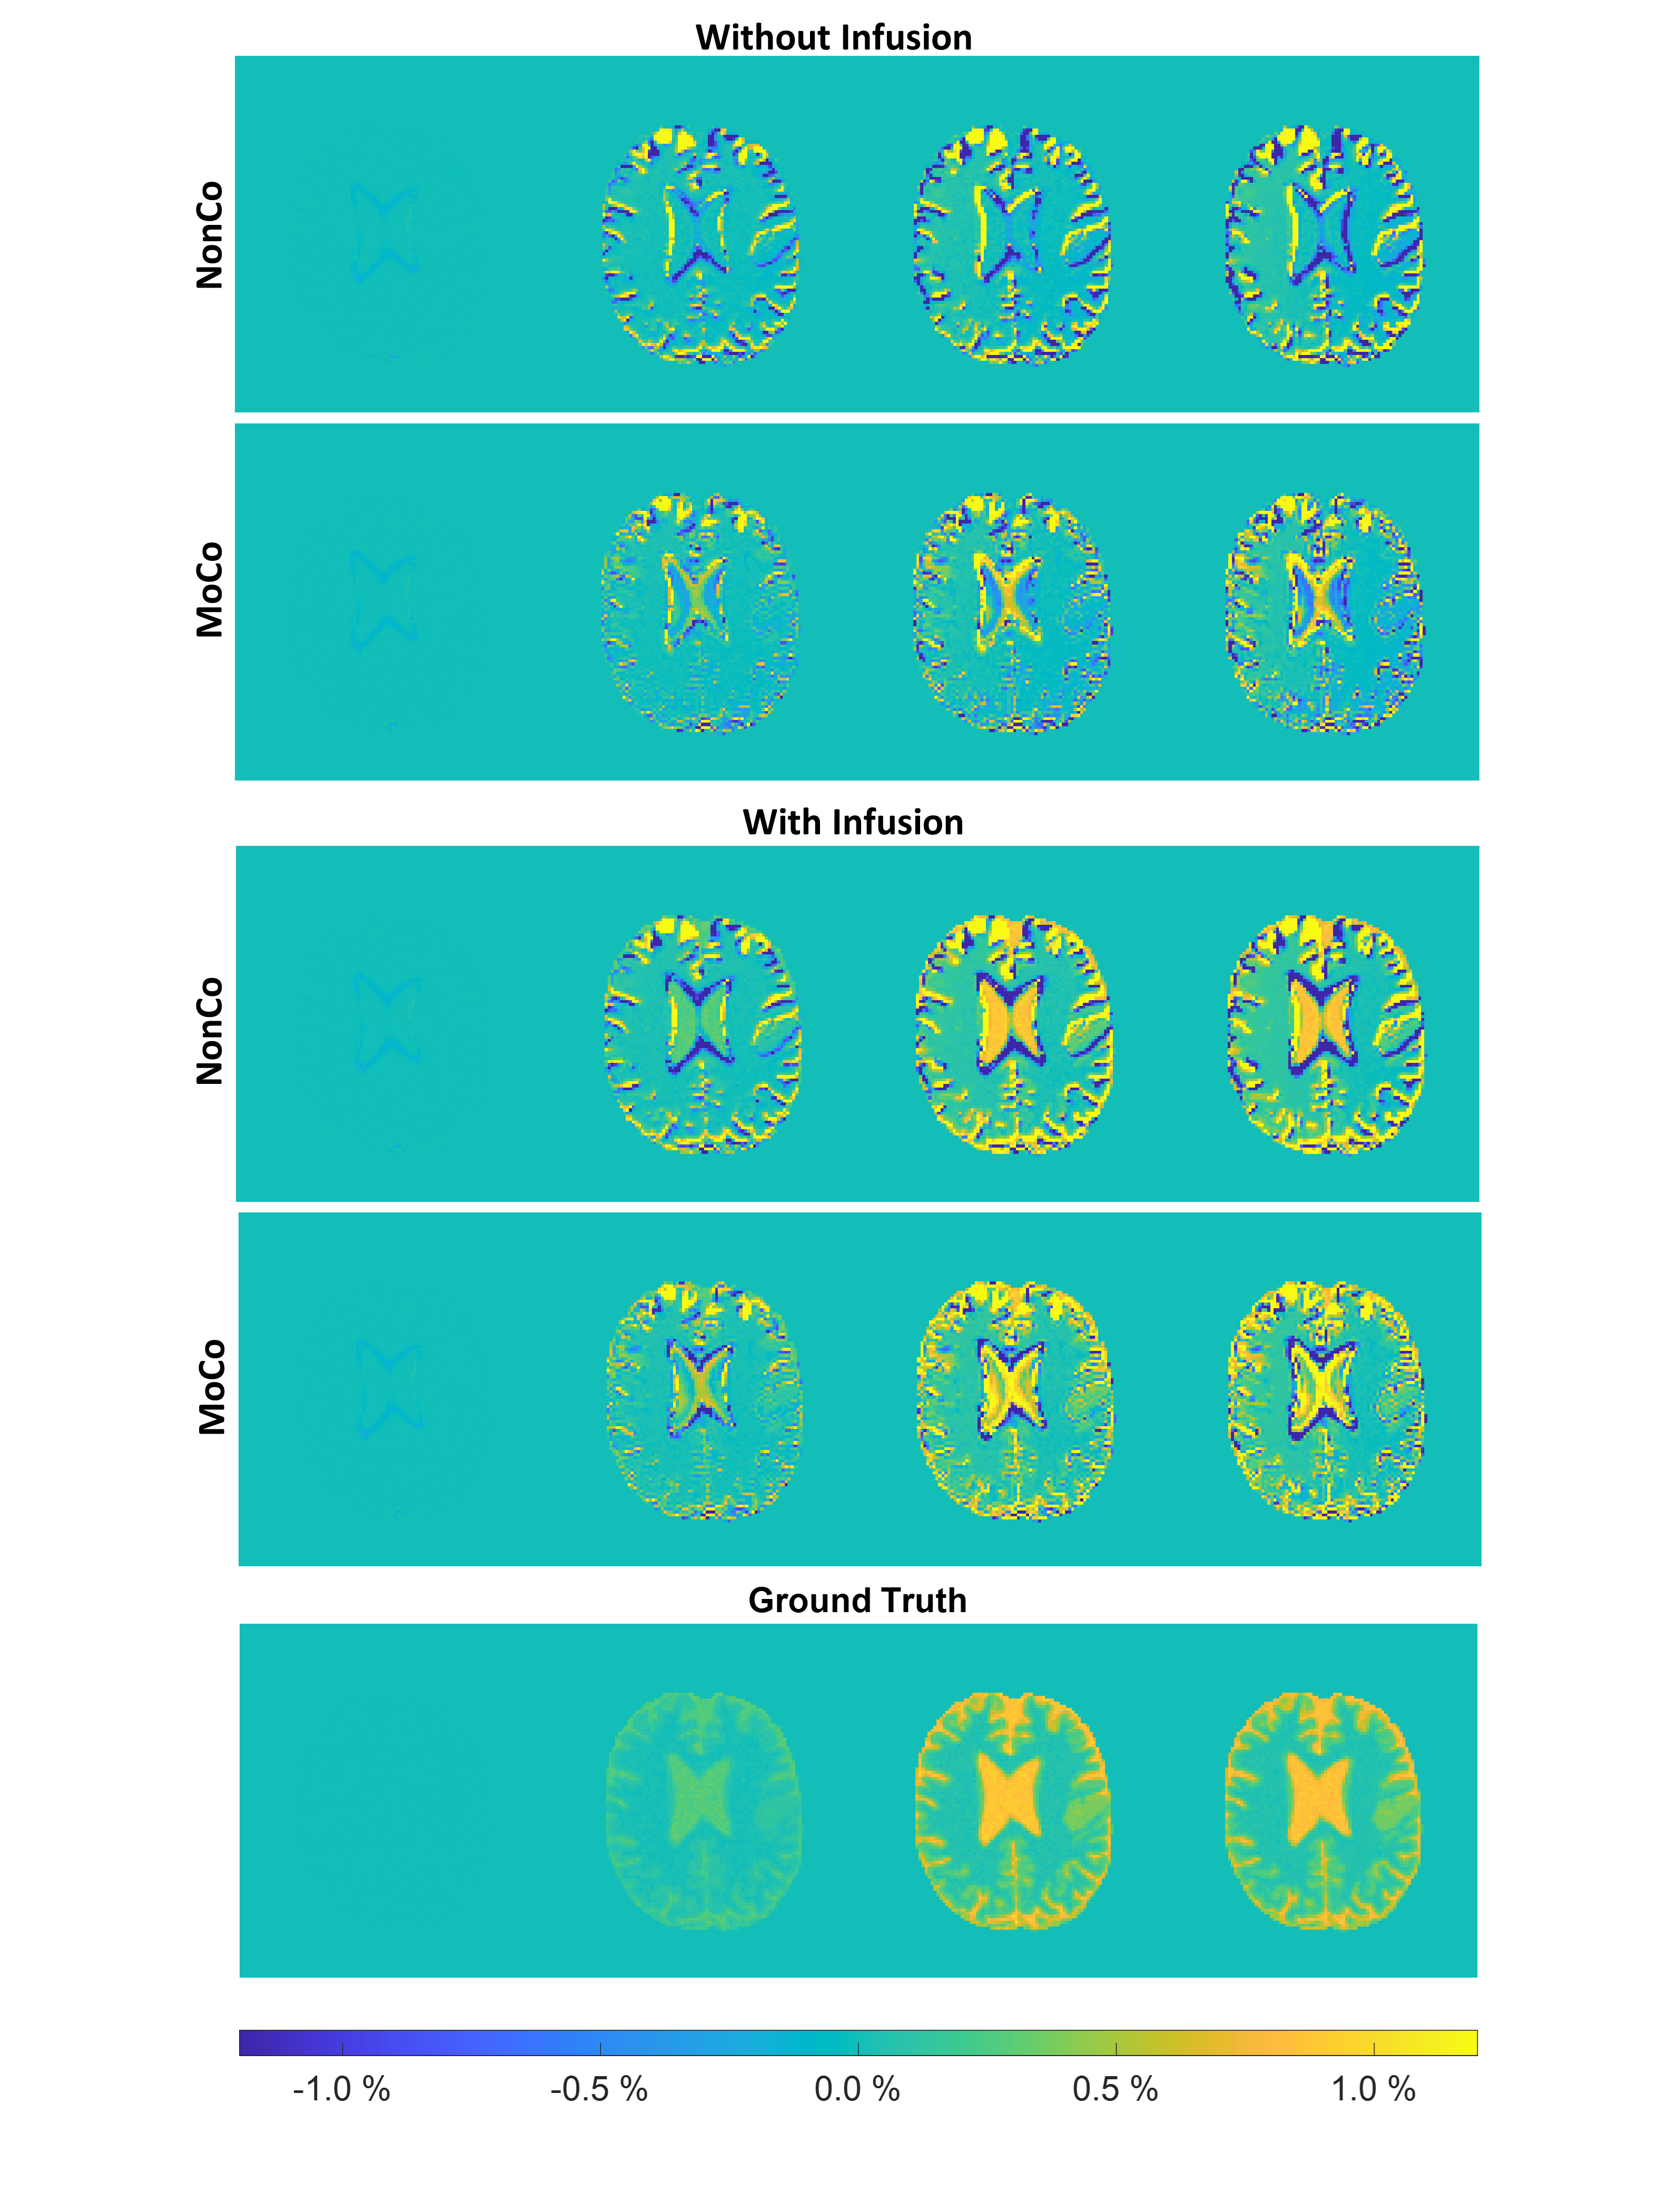
Figure 3:
AUCmean map evolution separated in time intervals (cf. Figure 2), with and without infusion before motion correction (NonCo) and after motion correction (MoCo). Ground truth with infusion without motion together with the AUCmean intensity scale.
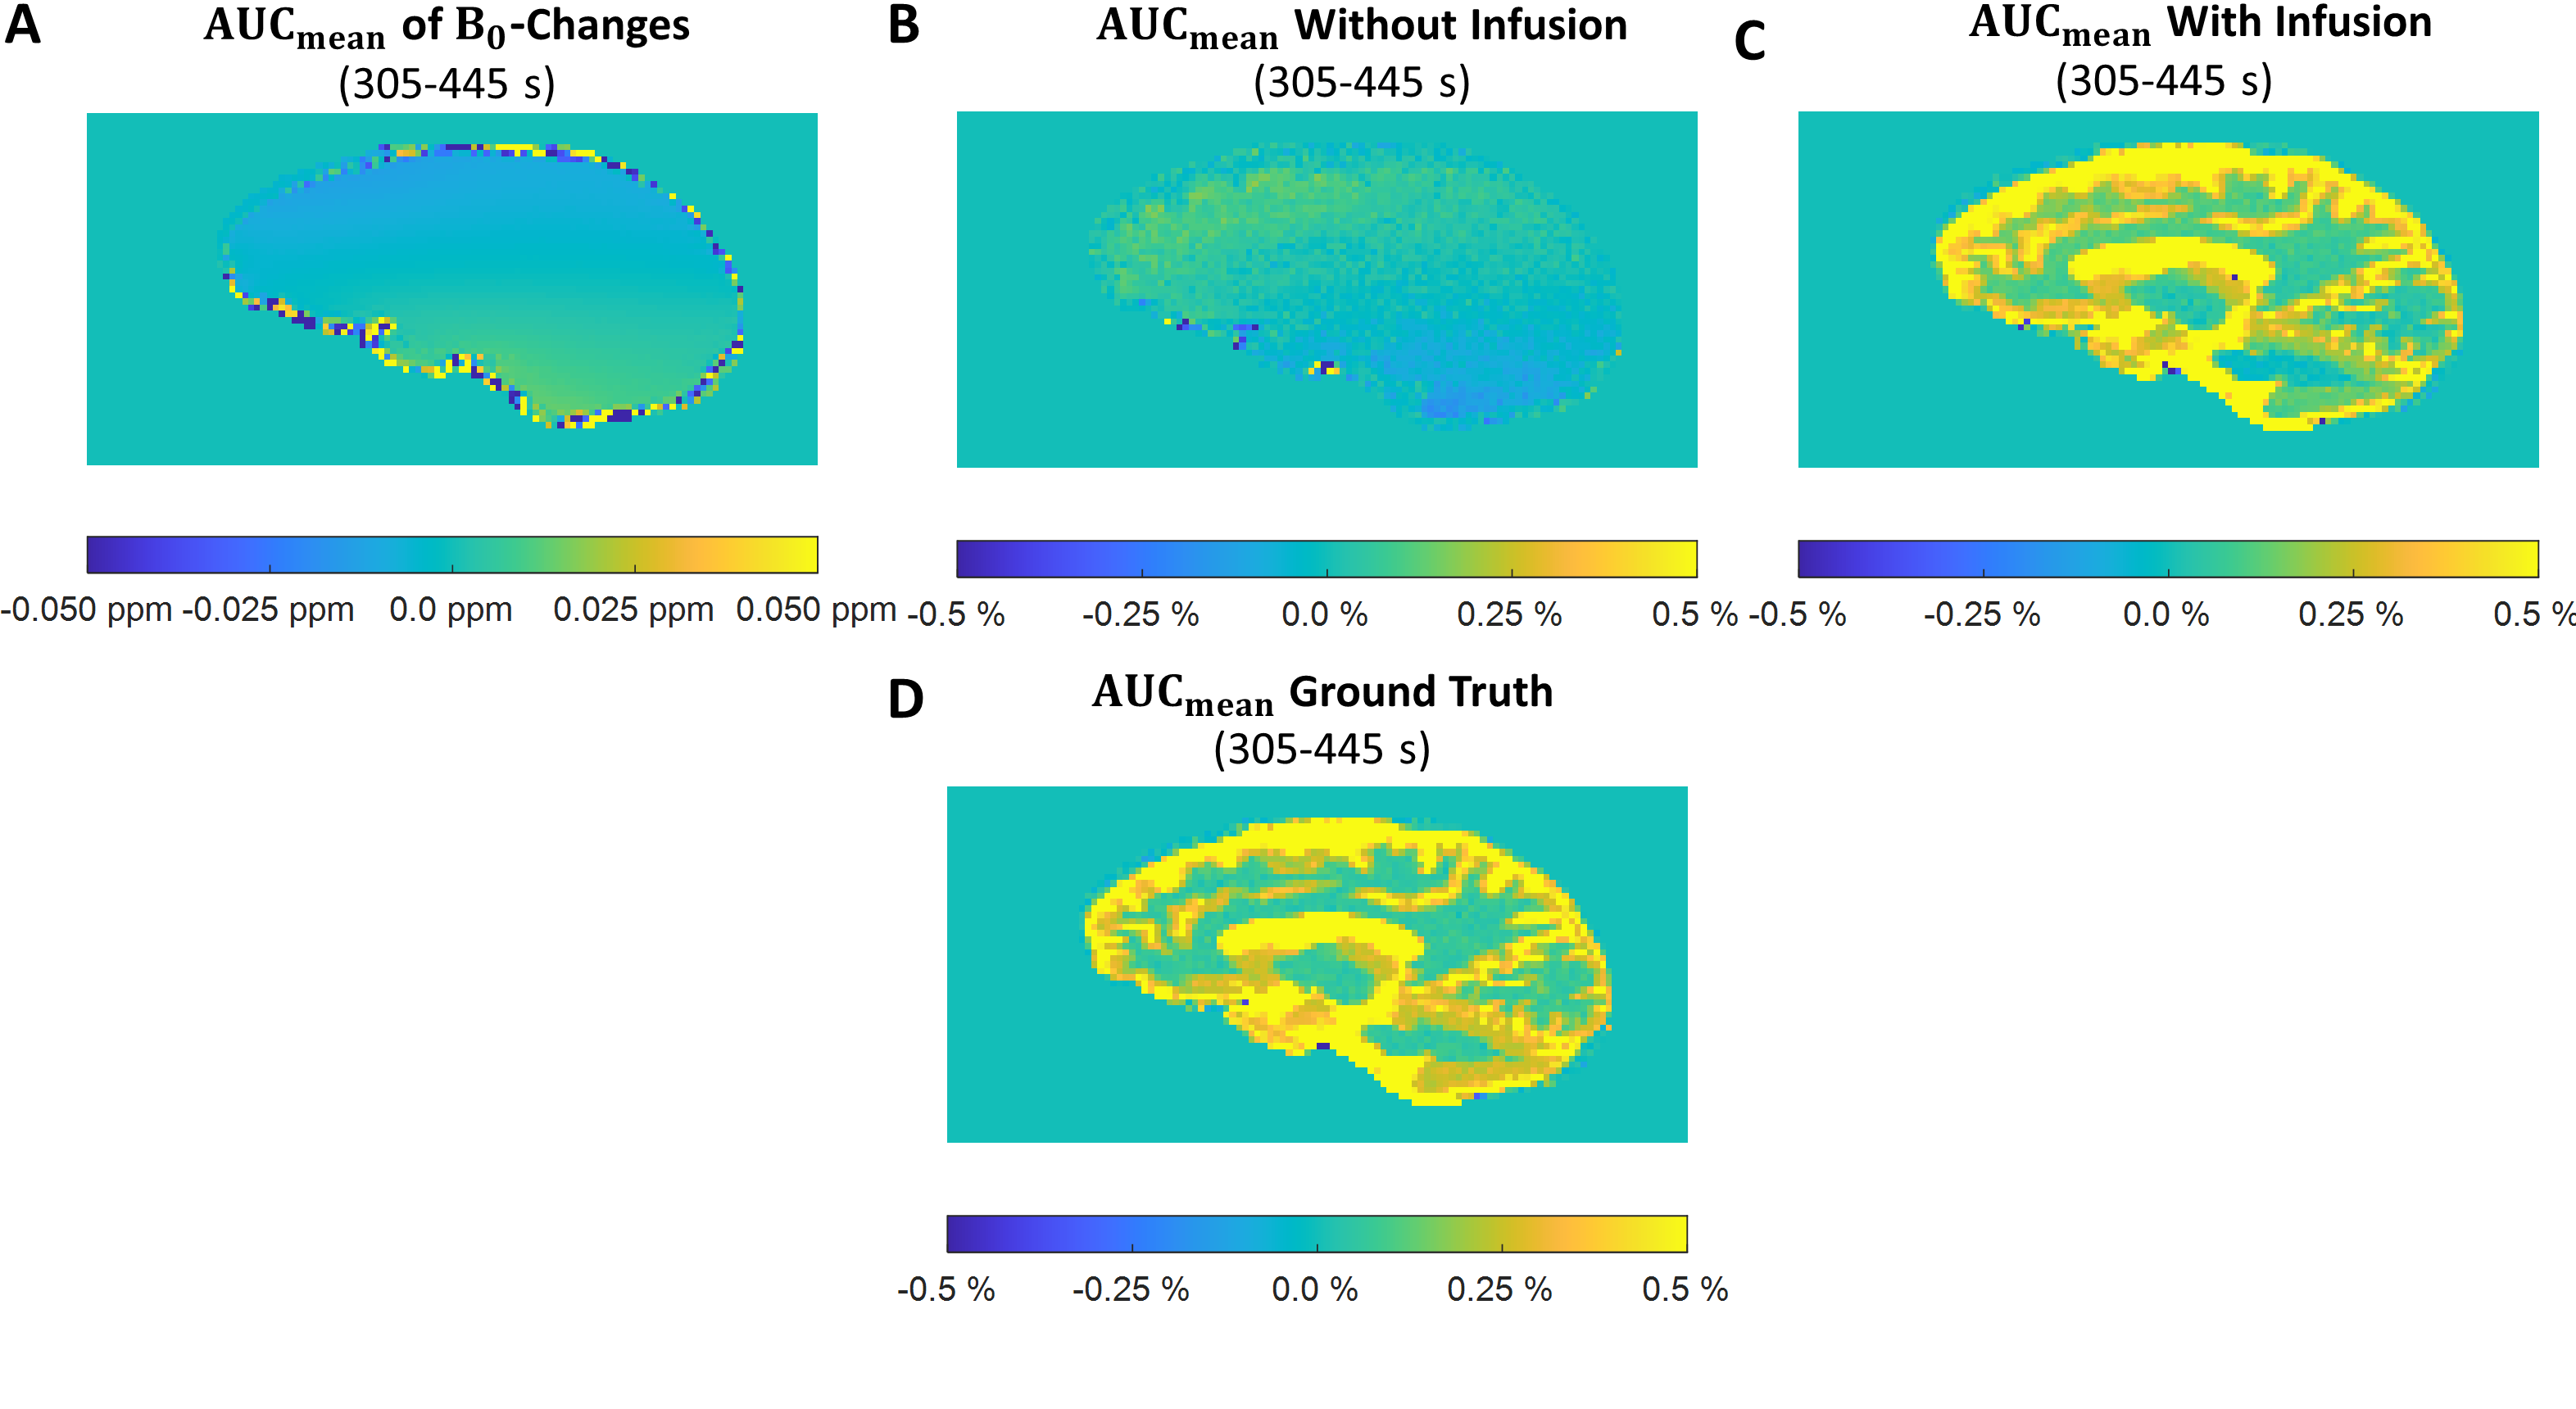
Figure 4:
AUCmean map evolution in the sagittal slice direction in the patient frame of reference for in the time interval 305-445 s. (A): Motion induced B0-changes. (B-C): DGE signal changes (B) without infusion and (C) with infusion under the influence of isolated B0-changes. (D): Ground truth in the same interval for comparison.
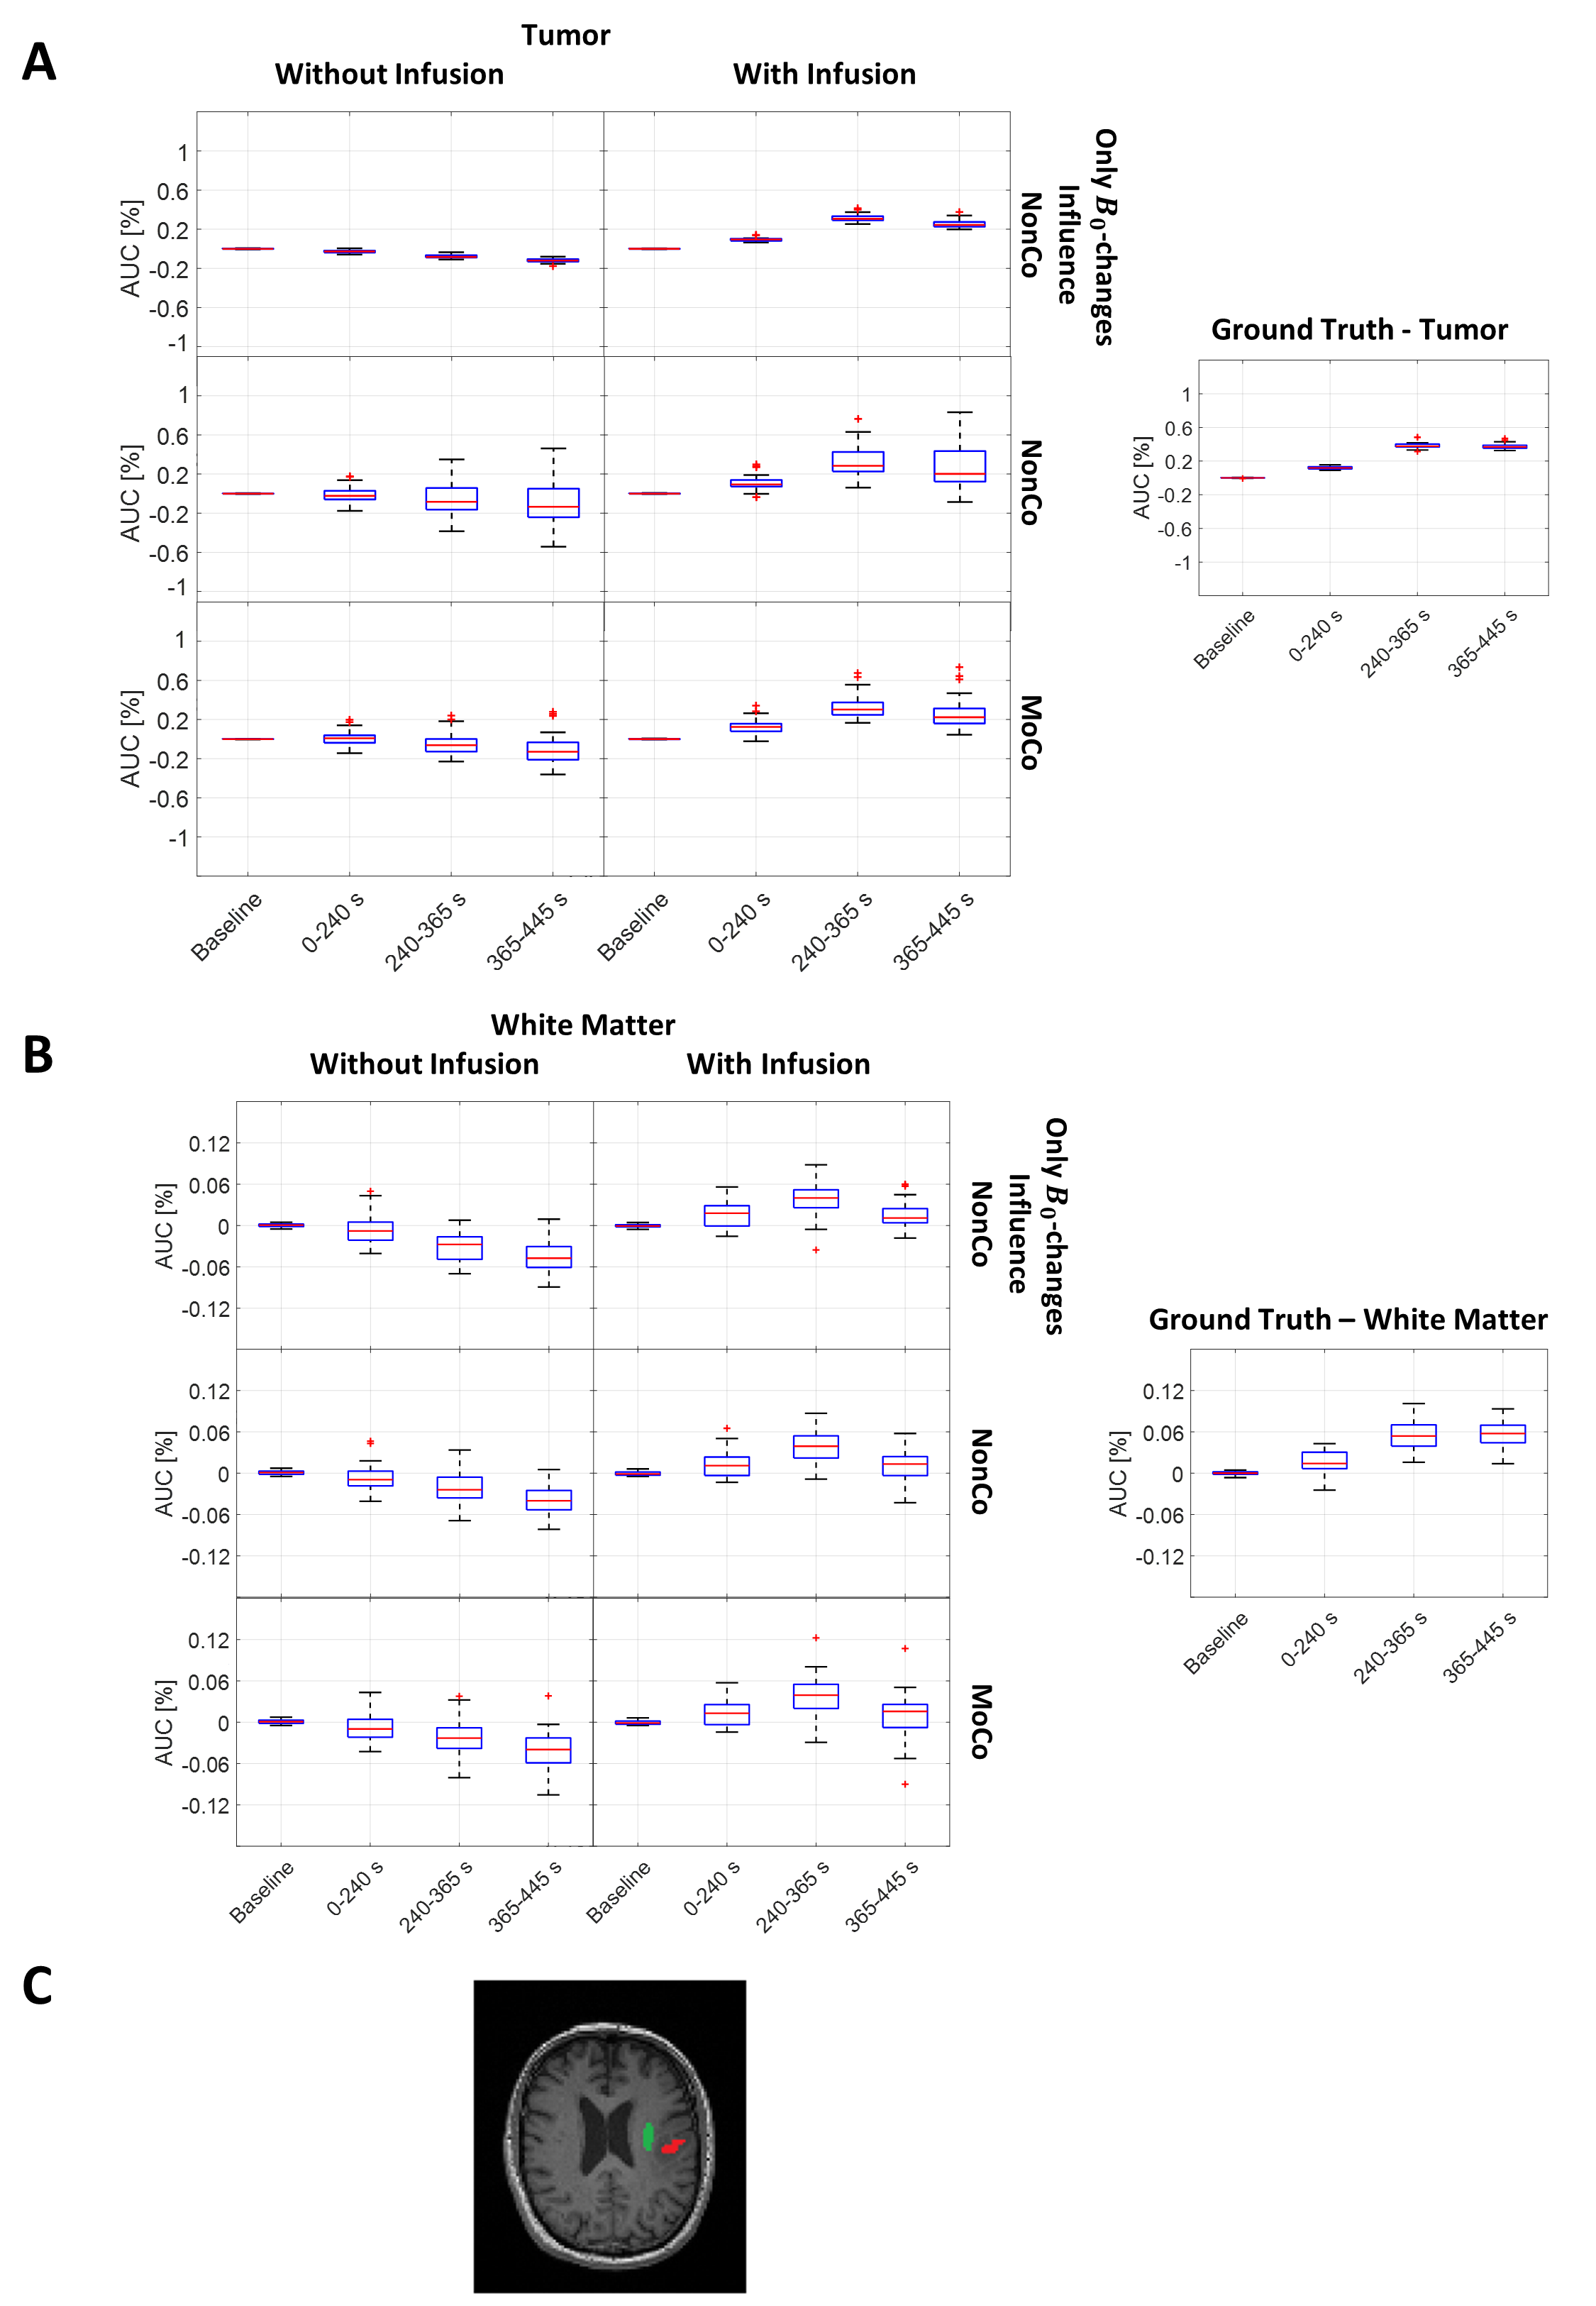
Figure 5:
Box-and-whisker plots showing AUCmean signal for ROIs of (A) tumor and (B) white matter influenced by B0-changes in the patient frame of reference (top) without motion correction (cf. Fig 4), B0-changes with motion without motion correction (middle) and with motion correction (bottom), all cases shown both without infusion and with infusion. Ground truths for tumor and white matter are plotted (right). ROIs are shown in (C). Whiskers represent maximum and minimum values, ‘+’ denotes outliers.