1993
Detection of the Multiple Sclerosis Drug Siponimod Using Fluorine-19 Magnetic Resonance Imaging1Berlin Ultrahigh Field Facility, Max Delbrück Center for Molecular Medicine in the Helmholtz Association, Berlin, Germany, 2Digital Health Center, Hasso Plattner Institute, Potsdam, Germany, 3Experimental and Clinical Research Center (ECRC), A Joint Cooperation between the Charité Medical Faculty and the Max-Delbrück Center for Molecular Medicine, Berlin, Germany
Synopsis
Siponimod is a fluorinated drug approved for treatment of secondary progressive multiple sclerosis. We detect 19F-MR signal in the liver, brain, kidneys, and thymus, and achieve the first 19F-MR images of a disease modifying drug, both in the liver and brain ex vivo and in a proof-of-concept in vivo experiment. Clear concentration differences between lobes of the liver or regions of the CNS can be observed. We have demonstrated the feasibility of using 19F-MRI to study the distribution of disease modifying drugs and improve our understanding of pharmacokinetics or guide therapeutic decisions.
Introduction
Siponimod is a fluorinated S1P-receptor modulator approved for secondary progressive multiple sclerosis.1 It must transverse the blood-brain barrier in sufficient concentrations to elicit its full effects.2,3 Thus, a non-invasive method to determine drug levels in vivo would be very desirable. We utilize the specificity of 19F-MRI to detect and image siponimod in mice, both in selected organs ex vivo and in a proof-of-concept in vivo experiment.Methods
In vivo experiments were performed on 3 healthy C57Bl/6 mice (M1-M3). 4 mg siponimod mixed in CMC were administered via intubation tubing into the oesophagus at the beginning of the MR experiment. 2-4 h later, mice were perfused and fixed, and ex vivo tissues were extracted.4 In an additional 3 mice (M4-M6), ex vivo tissues were extracted 6 h after siponimod administration without in vivo MR measurements. All animal experiments were carried out in accordance with local animal welfare guidelines (LaGeSo).MR measurements were performed on a 9.4 T animal scanner using a two-channel cryogenic transceive surface RF probe4 and a linear volume RF resonator for 19F and 1H acquisitions, respectively (all Bruker BioSpin). Acquisition protocols were optimized for the ultrashort transverse relaxation times of siponimod under physiological conditions.5 All 19F-MR pulse sequence parameters are stated in the figure captions. MRI and MRS acquisitions were performed interleaved with a period of ≈15 min in the in vivo experiments. Frequency selective excitation 2 kHz off-resonance was used in the ex vivo imaging sequences to avoid confounding 19F signals originating from the RF probe or scanner. The resulting phase-error was corrected in post-processing. For MRS acquisitions, the artifact signals at -83 ppm and -148 ppm were removed by subtracting a fit of two Voigt lines, which were constrained by Gaussian priors. All data analysis was performed in Matlab R2018a (The MathWorks).
Results
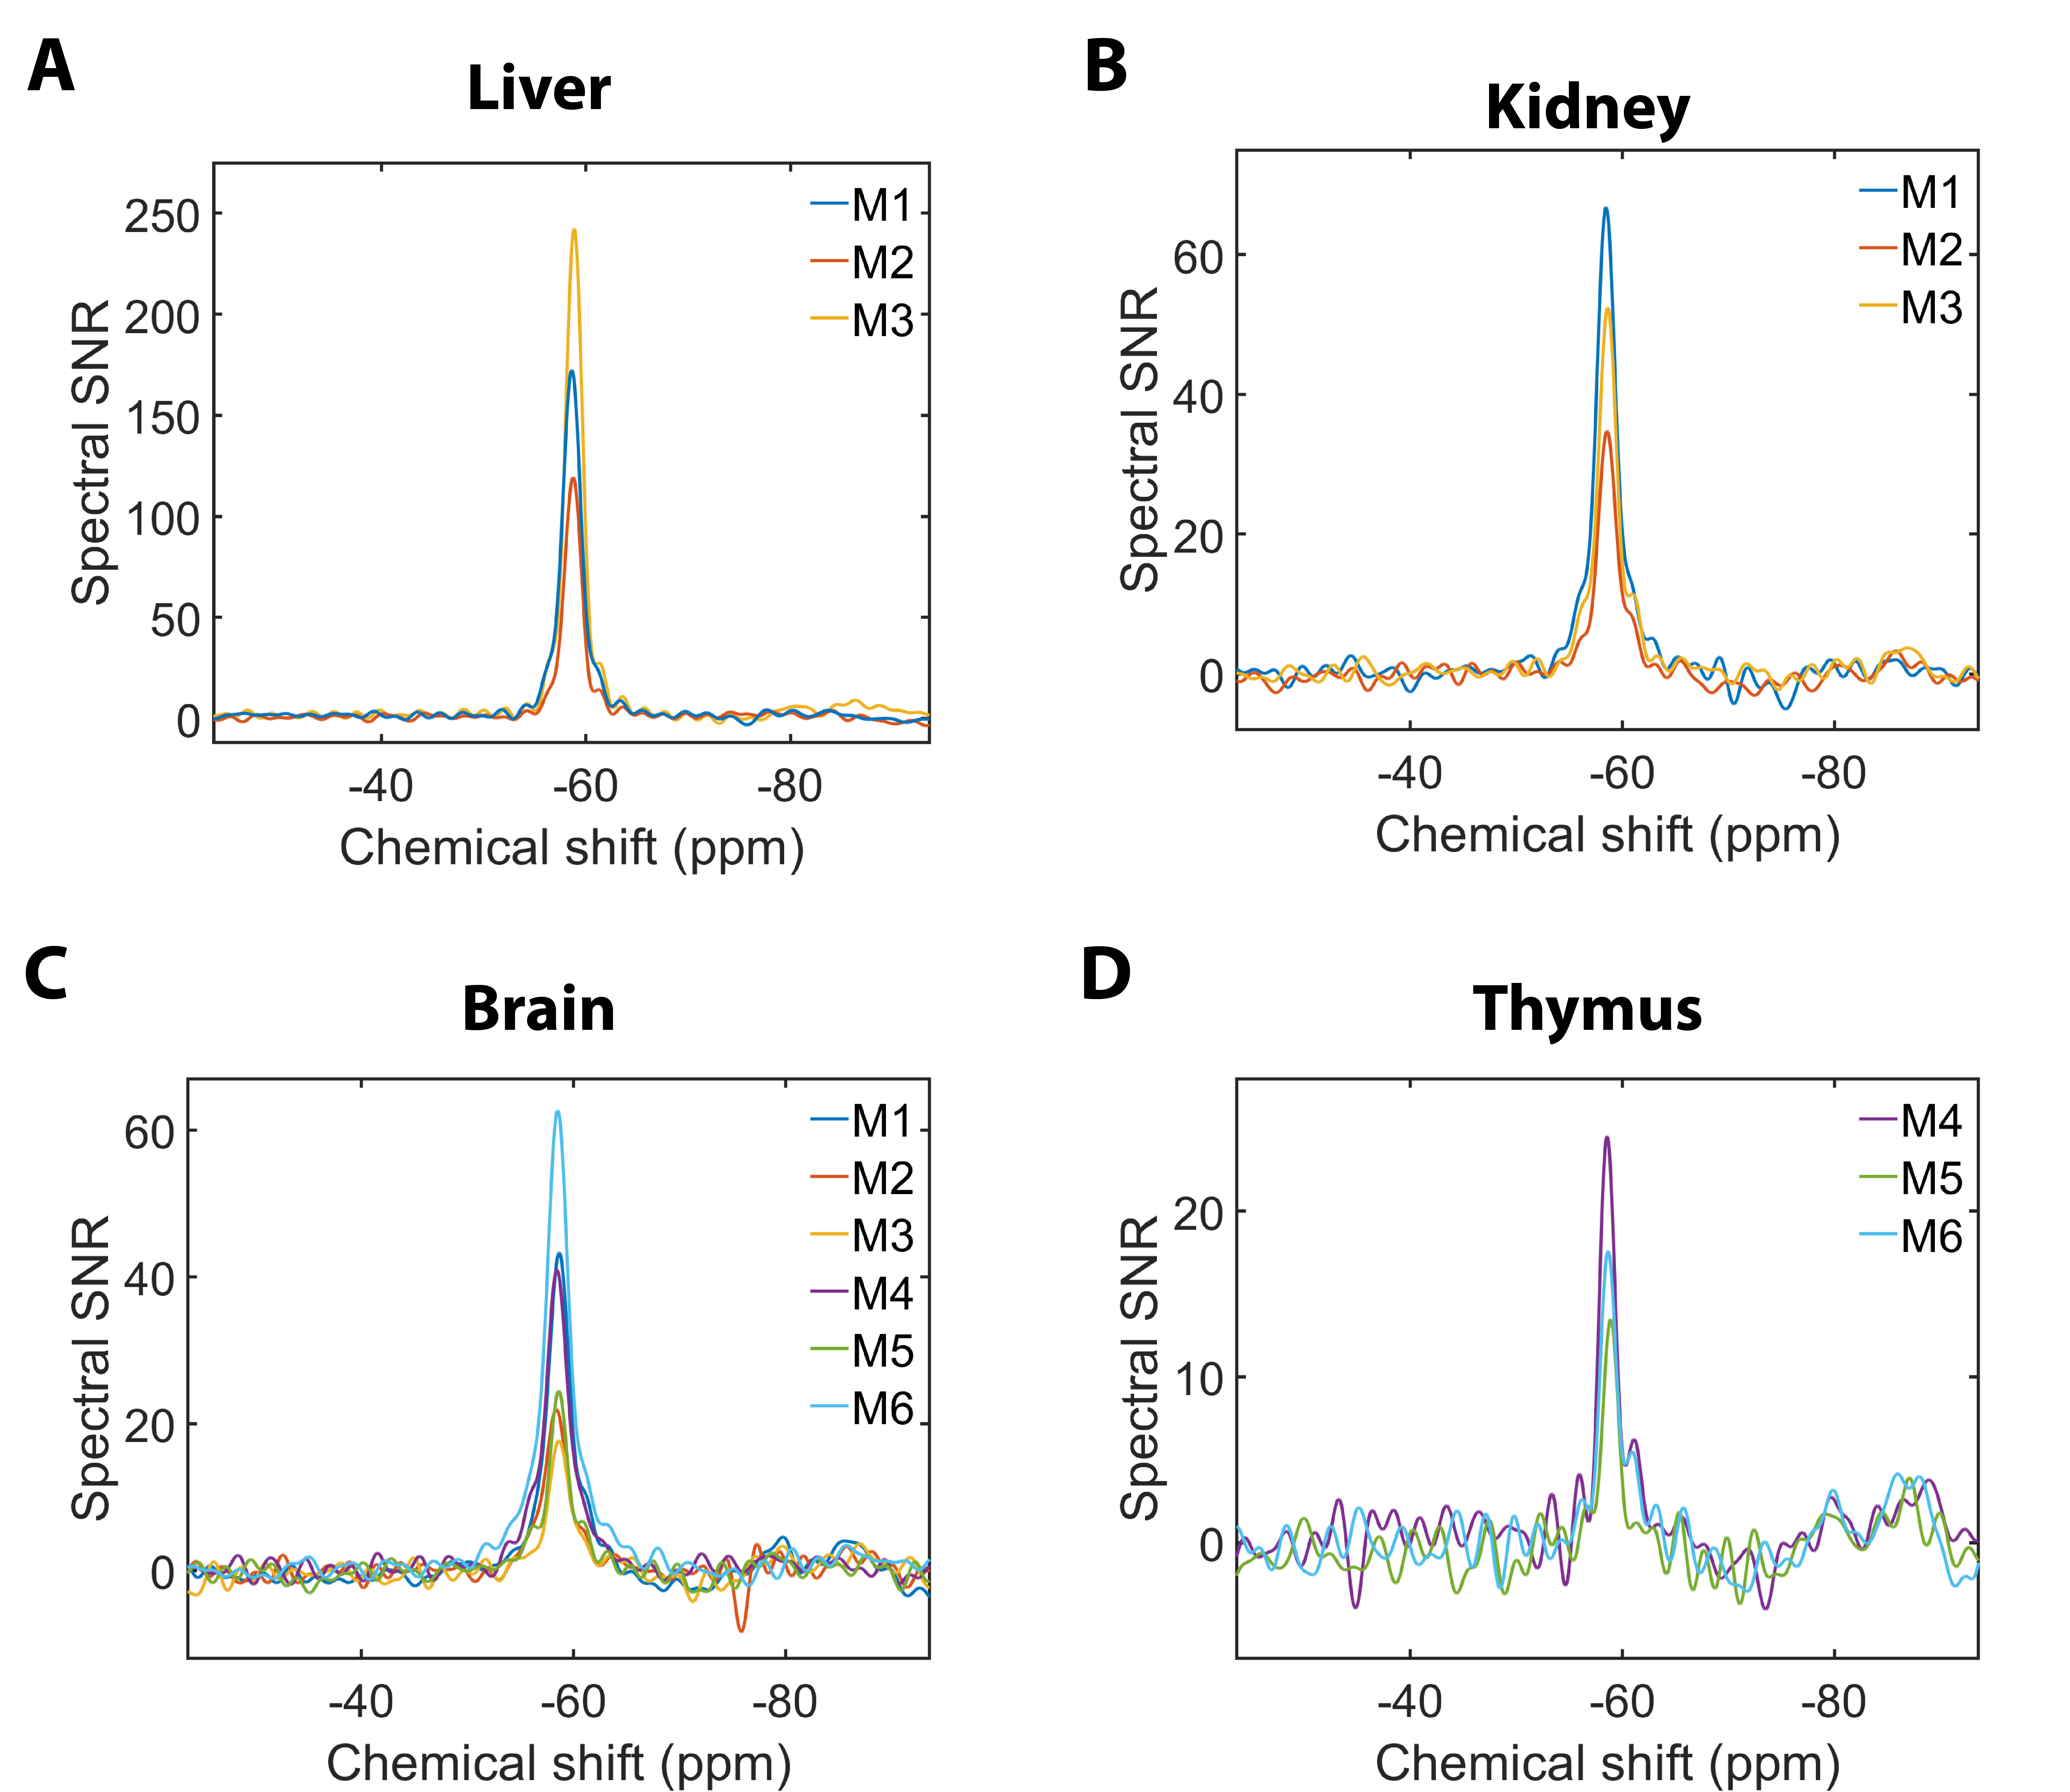
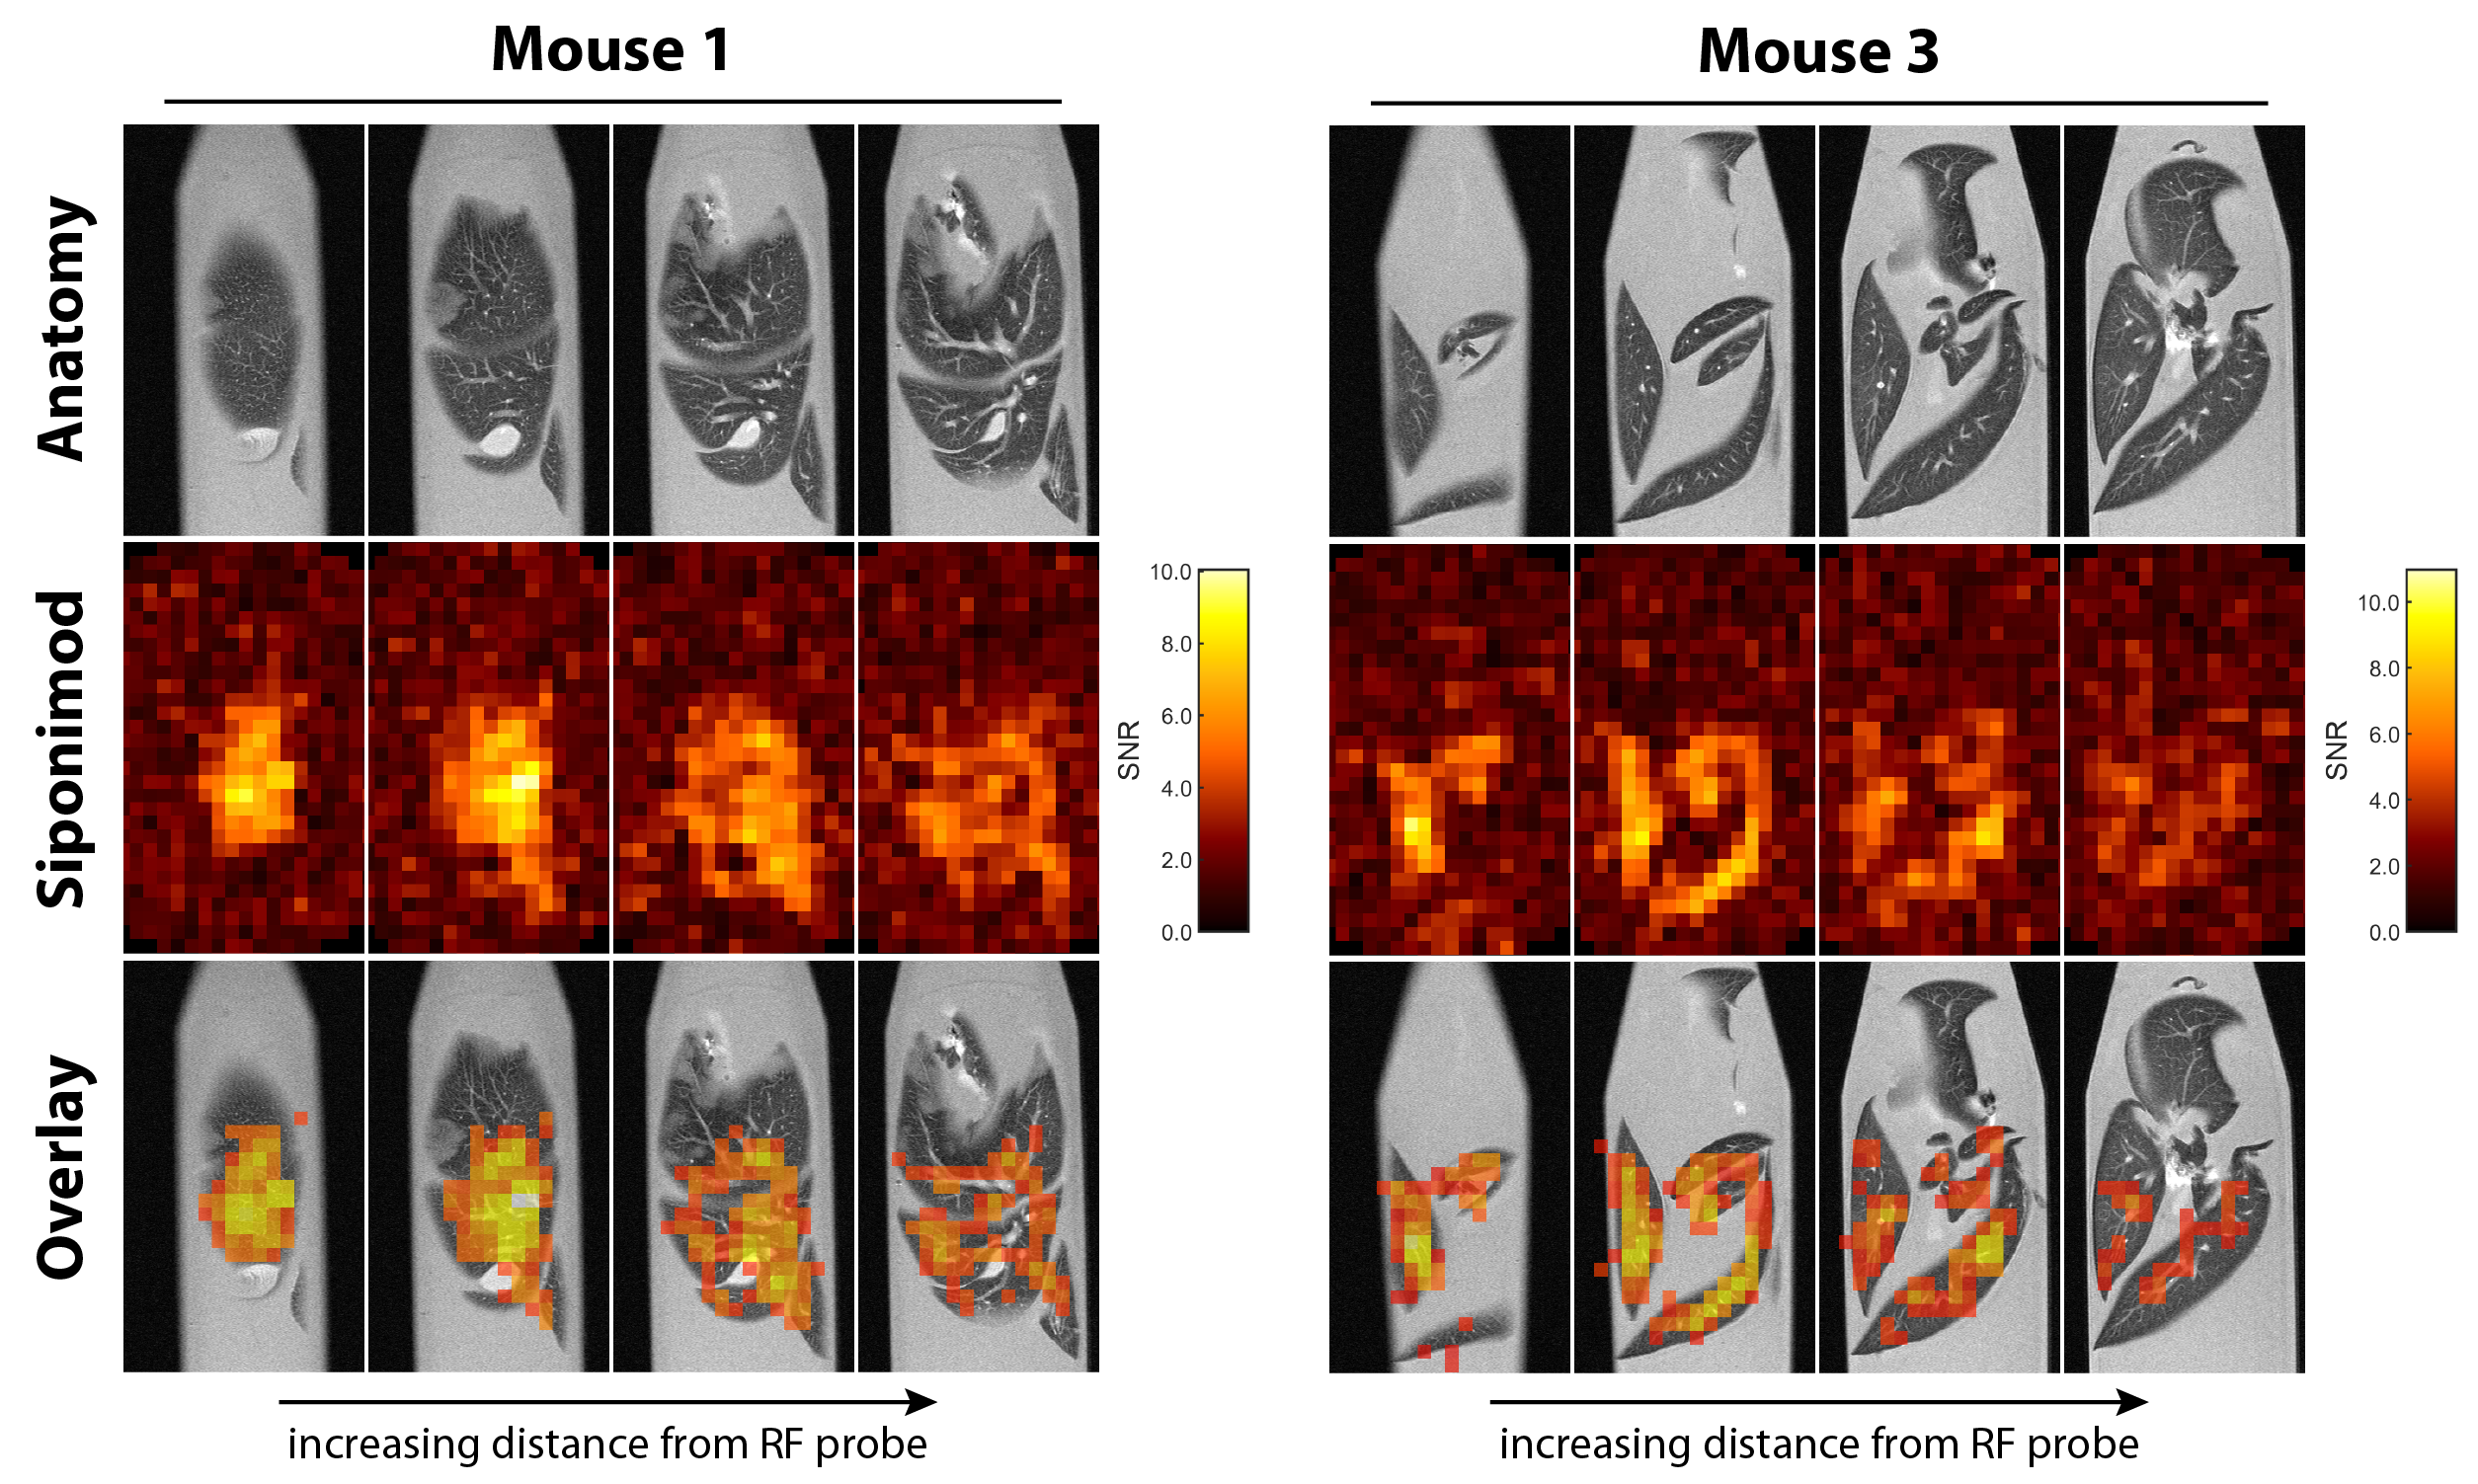
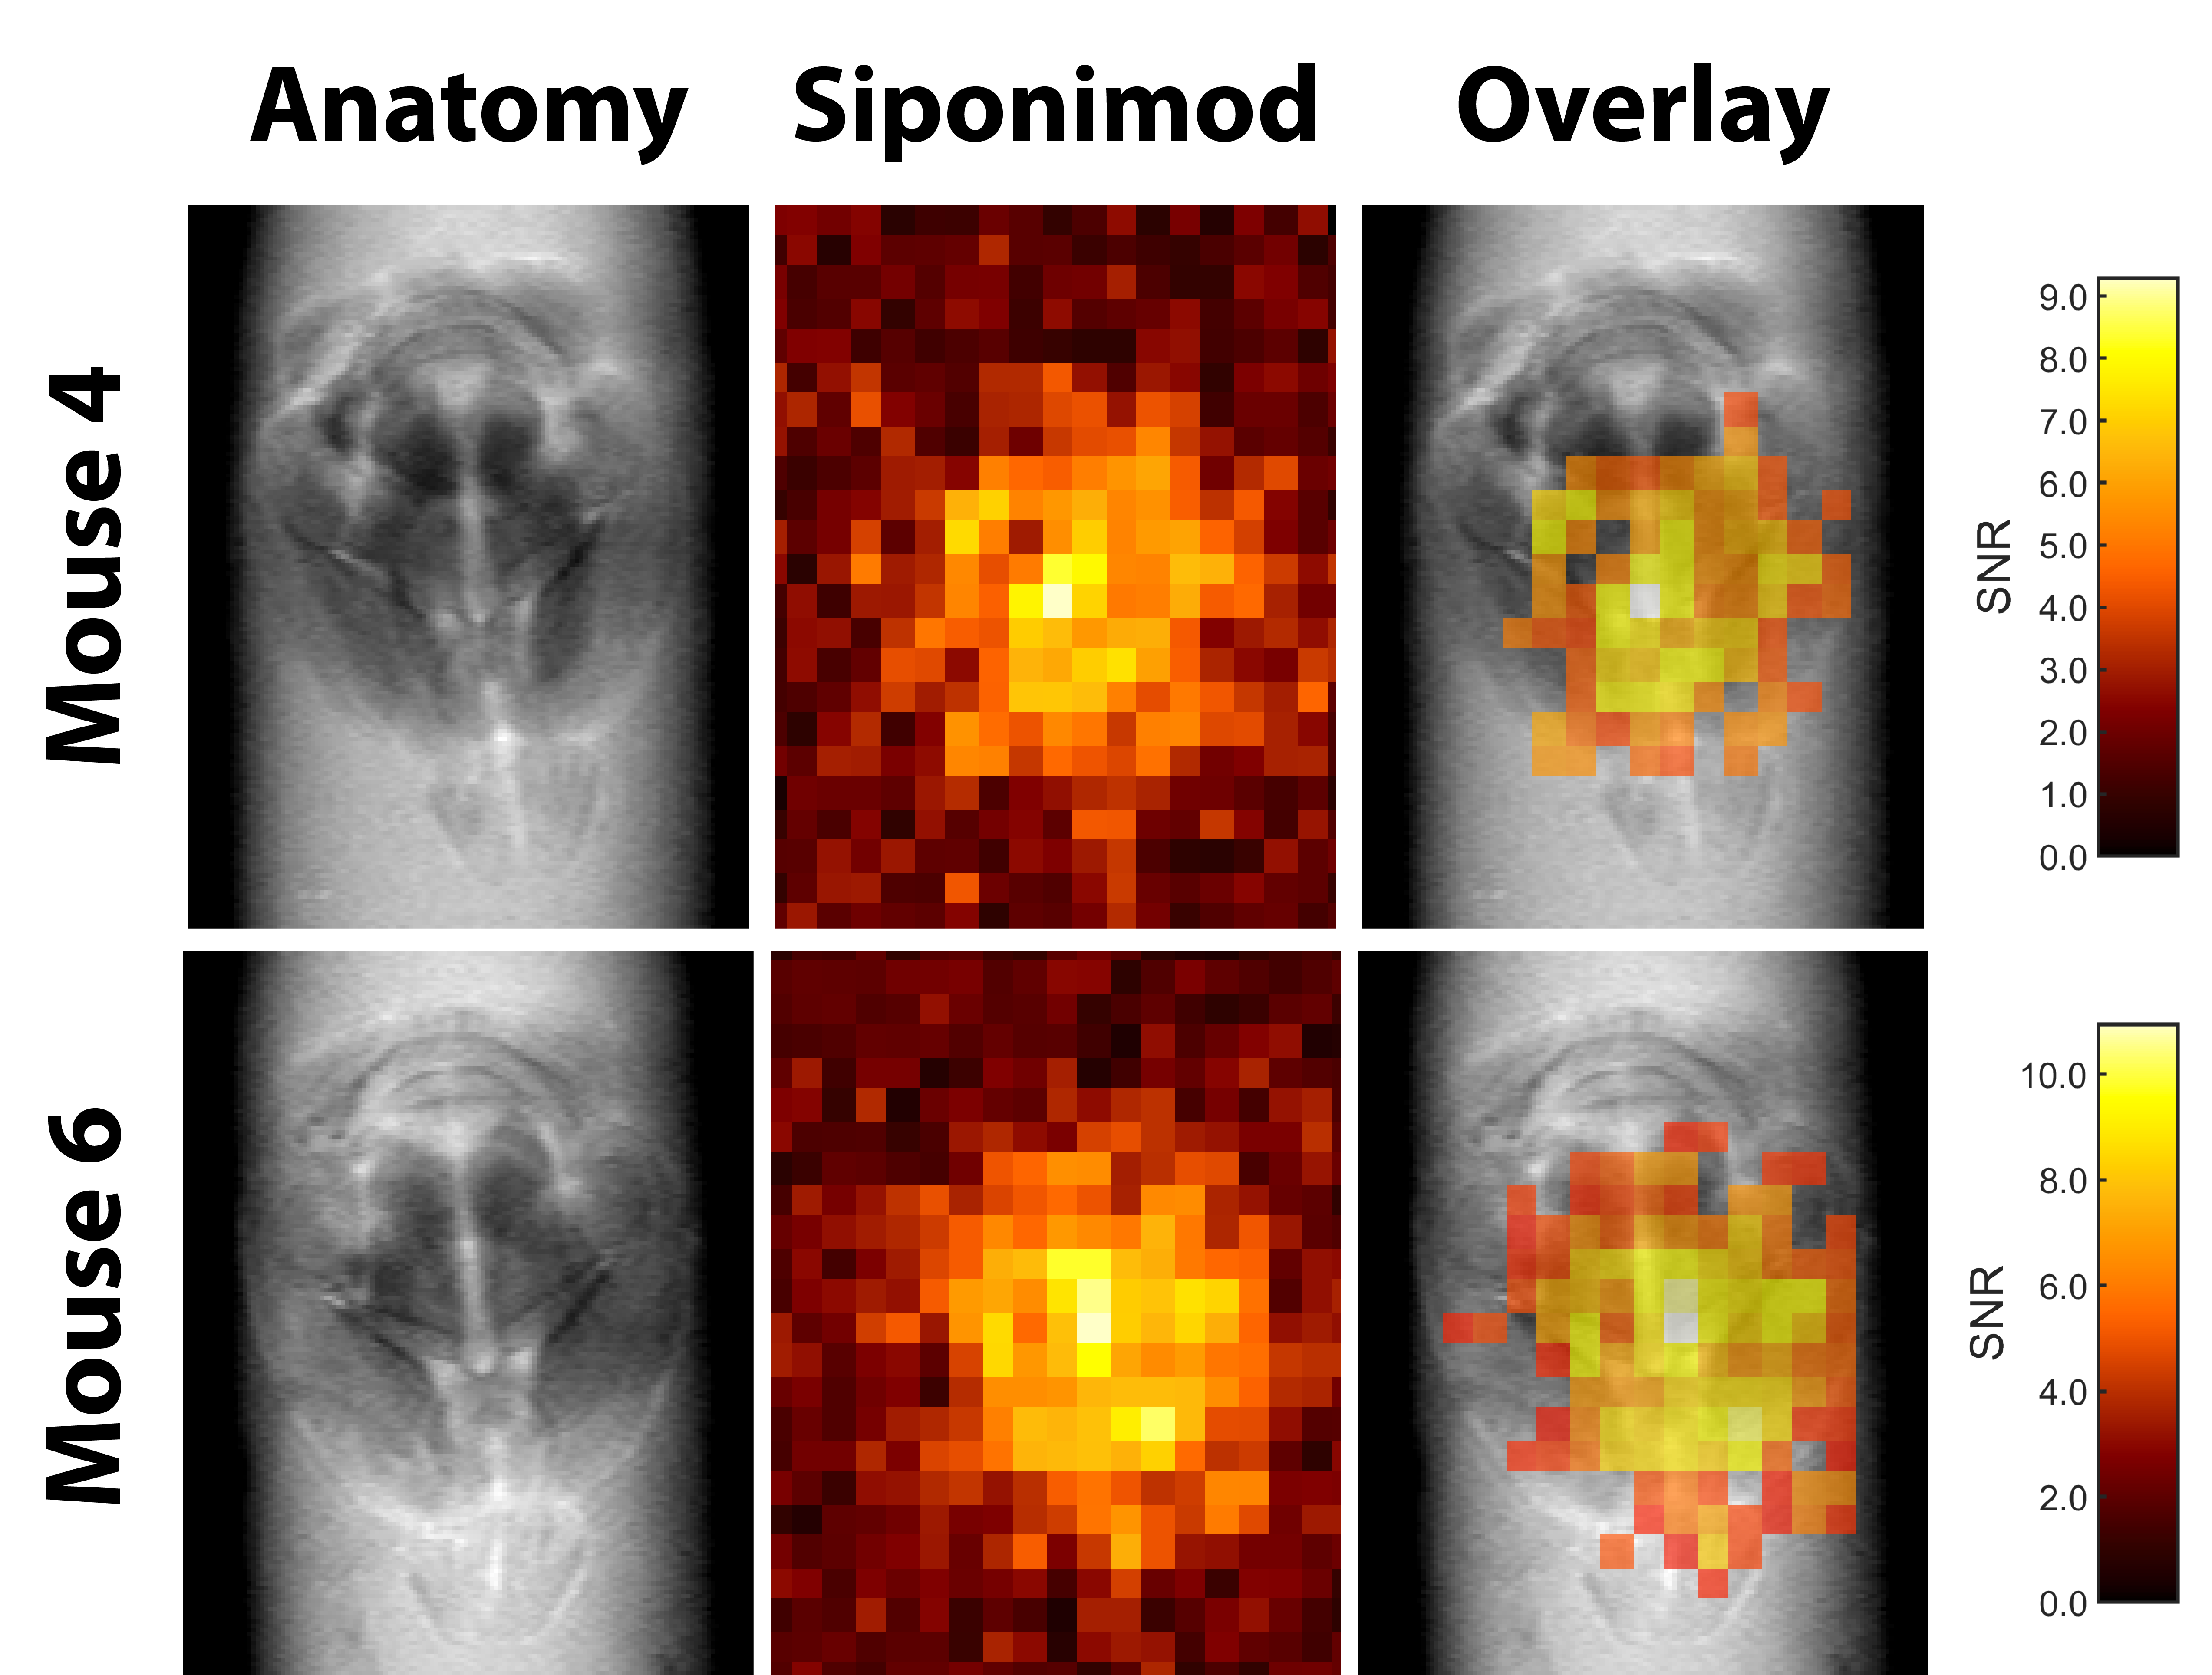
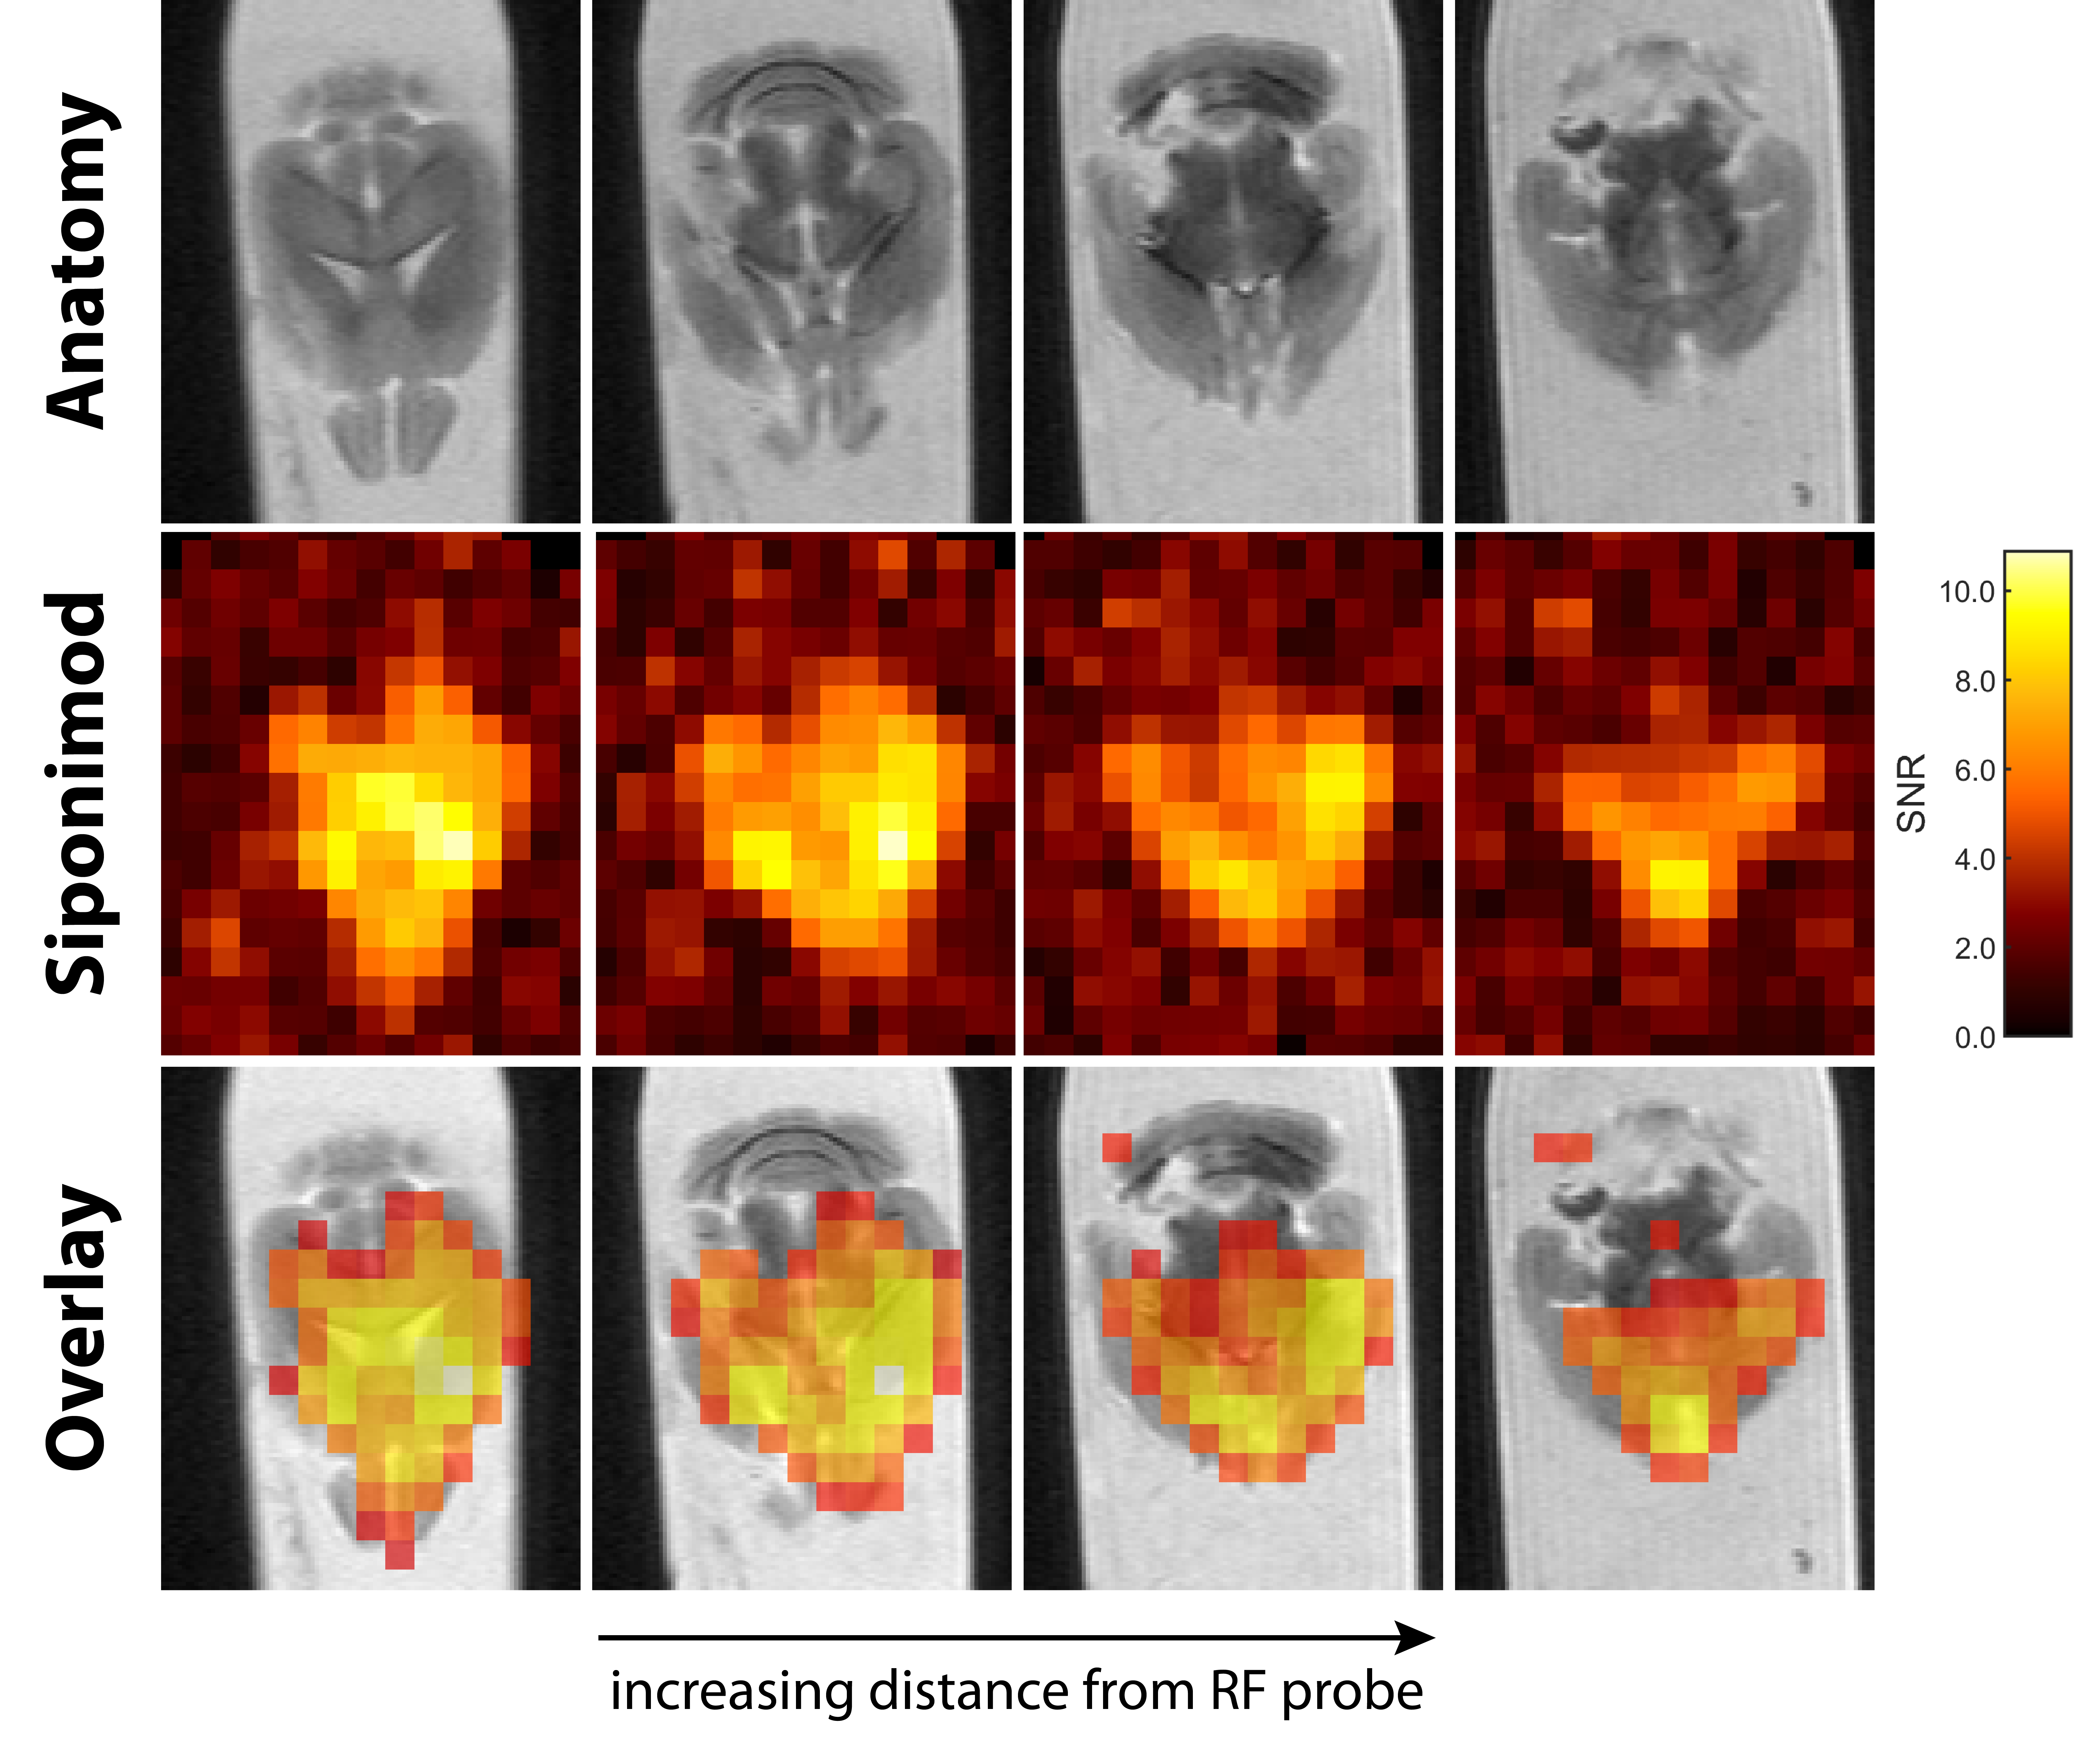
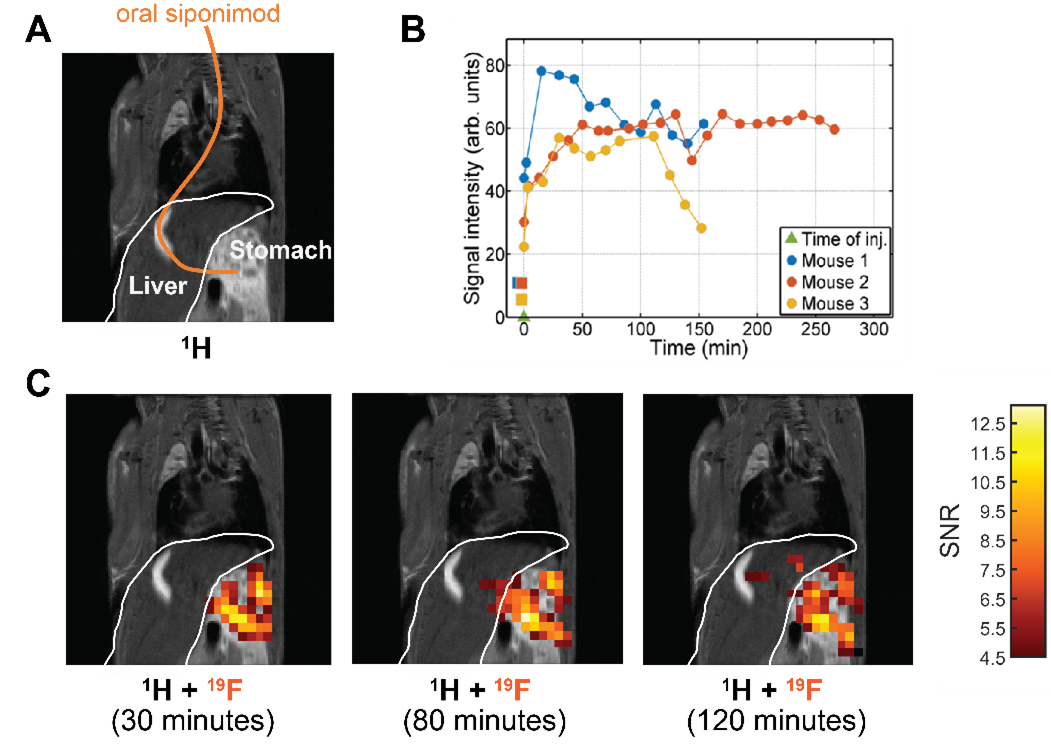
Siponimod-derived 19F-signal could be detected ex vivo in liver, kidneys, brain and thymus (Fig. 1). While the overall highest SNR is reached in the livers (Fig. 1A) the thymus show strong signal relative to the organ size (Fig. 1D). 3D-UTE ex vivo imaging in the liver exhibits 19F-signal following the organ’s anatomical structure with clear signal intensity differences between lobes (M3) or different parts of the same lobe (M1) at equal distance to the RF probe surface (Fig. 2). 2D-projection images of the brain are dominated by cortical gray matter close to the RF probe surface yet achieve 0.75 mm in-plane resolution (Fig. 3). In 3D, clear differences in the siponimod accumulation between gray and white matter can be observed (Fig. 4). Fig. 5A illustrates the in vivo experimental setup. In all 3 mice, the signal detectable with global MRS reaches a plateau in the first 30 minutes after injection (Fig. 5B). The example M1 shows that signal levels in the stomach are quite stable; signals in the liver develop at the later time points (Fig. 5C).Discussion
19F-MRI is an under-utilized and unconventional approach to detect disease modifying drugs (DMDs) in living organs and tissue. While 19F-MRI or localized 19F-MRS promise to locate drugs within specific tissues in living organisms, implementation has been challenging. Achievable SNRs have been a major limitation in previous studies to detect DMDs, such as teriflunomide, with 19F-MRI.6 Here we perform for the first time 19F MR imaging of the DMD siponimod. The observation of concentration differences between regions of the CNS or between lobes of the liver demonstrates the capability of 19F-MRI to investigate pharmacokinetic processes, and the detection of siponimod in multiple organs promises that these investigations can be extended in the future. Finally, our proof-of-concept in vivo experiment shows that practical challenges can be overcome and siponimod can be imaged in the living body.Conclusion
With this study we have demonstrated the feasibility of using 19F-MRI to study the distribution of DMDs. While further technical advances such as higher magnetic field strengths7, accelerated acquisition8 and B1-correction9 will be necessary to achieve imaging in the CNS in vivo and derive quantitative results, MRI of fluorinated drugs holds great promise for preclinical studies and to guide therapeutic decisions.Acknowledgements
We thank Christian Prinz and Fatima Sherazi for their generous support in this project. This work was supported by funding from the Germany Research Council (DFG WA2804) and received funding in part (T.N., J.M.) from the European Research Council (ERC) under the European Union's Horizon 2020 research and innovation program under grant agreement No 743077 (ThermalMR). We also thank the MDC-Weizmann Helmholtz International Research School for Imaging and Data Science from the NAno to the MESo (iNAMES).References
1. Cao L, Lao Y, Yao L, et al. Siponimod for multiple sclerosis. The Cochrane Database of Systematic Reviews. 2020;2020(6).
2. Aslanis V, Faller T, Van de Kerkhof E, Schubart A, Wallström E, Beyerbach A. Siponimod (BAF312)(and/or its metabolites) penetrates into the CNS and distributes to white matter areas. Paper presented at: MULTIPLE SCLEROSIS JOURNAL2012.
3. Tavares A, Barret O, Alagille D, et al. Brain Distribution of MS565, an imaging analogue of siponimod (BAF312), in non-human primates (P1. 168). In: AAN Enterprises; 2014.
4. Waiczies S, Millward JM, Starke L, et al. Enhanced Fluorine-19 MRI Sensitivity using a Cryogenic Radiofrequency Probe: Technical Developments and Ex Vivo Demonstration in a Mouse Model of Neuroinflammation. Scientific reports. 2017;7(1):9808.
5. Prinz C, Sherazi F, Starke L, et al. Fluorine-19 MR Characterisation of Siponimod as MR Theranostic Approach in the Treatment of Multiple Sclerosis. Proc. Intl. Soc. Mag. Reson. Med. ; 2020.
6. Prinz C, Starke L, Millward JM, et al. In vivo detection of teriflunomide-derived fluorine signal during neuroinflammation using fluorine MR spectroscopy. Theranostics. 2021;11(6):2490.
7. Waiczies S, Rosenberg JT, Kuehne A, et al. Fluorine-19 MRI at 21.1 T: enhanced spin-lattice relaxation of perfluoro-15-crown-5-ether and sensitivity as demonstrated in ex vivo murine neuroinflammation. Magma (New York, NY). 2019;32(1):37-49.
8. Starke L, Pohlmann A, Prinz C, Niendorf T, Waiczies S. Performance of compressed sensing for fluorine-19 magnetic resonance imaging at low signal-to-noise ratio conditions. Magn Reson Med. 2019.
9. Delgado PR, Kuehne A, Periquito J, et al. B1 Inhomogeneity Correction of RARE MRI with Transceive Surface Radiofrequency Probes. Magn Reson Med. 2020.
Figures