1991
Pentafluorosulfanyl (SF5) is a Superior 19F Magnetic Resonance Reporter Group: Signal Detection of Teriflunomide Derivatives1Berlin Ultrahigh Field Facility, MDC, Berlin, Germany, 2Physikalisch - Technische Bundesanstalt (PTB) Braunschweig and Berlin, Berlin, Germany
Synopsis
Modifications to the CF3 side-group of teriflunomide were made to improve its detection by 19F MRI. Pentafluorosulfanyl (SF5) was shown to be a superior alternative to CF3. The SNR efficiency of three 19F MRI methods showed that within a biological environment, SF5-substitutions gave the highest SNR efficiency in combination with an ultrashort echo-time (UTE) MRI method. Chemical modifications did not hamper biological activity but SF5-TF was more effective to inhibit T cell proliferation, indicating better anti-inflammatory activity. This study proposes SF5 as a novel superior 19F MR reporter group for the drug teriflunomide.
Introduction
More than one third of drugs contain fluorine (19F) to improve pharmacological properties.1-3 This also opens the opportunity to detect them in vivo using 19F MRI. However, 19F MRI is still severely limited by low SNR and poses a challenge for 19F drug detection. Recently, we detected teriflunomide (TF), a dihydroorotate dehydrogenase (DHODH) inhibitor, in an animal model of multiple sclerosis (MS) using non-localized 19F MRS.4 In this study, we investigated different modifications to the CF3 group of TF in order to probe the effects of altering the chemical environment for 19F and to improve reporter activity for 19F MRI. One of the modifications included the introduction of SF5. After a thorough characterization of the pharmacological properties and the 19F MR properties of the synthesized derivatives, we selected and optimized suitable MRI sequences and compared their SNR efficiency in imaging the derivatives. Ultimately, we selected the best suited candidate for an ex vivo demonstration of 19F MRI in the murine stomach.Methods
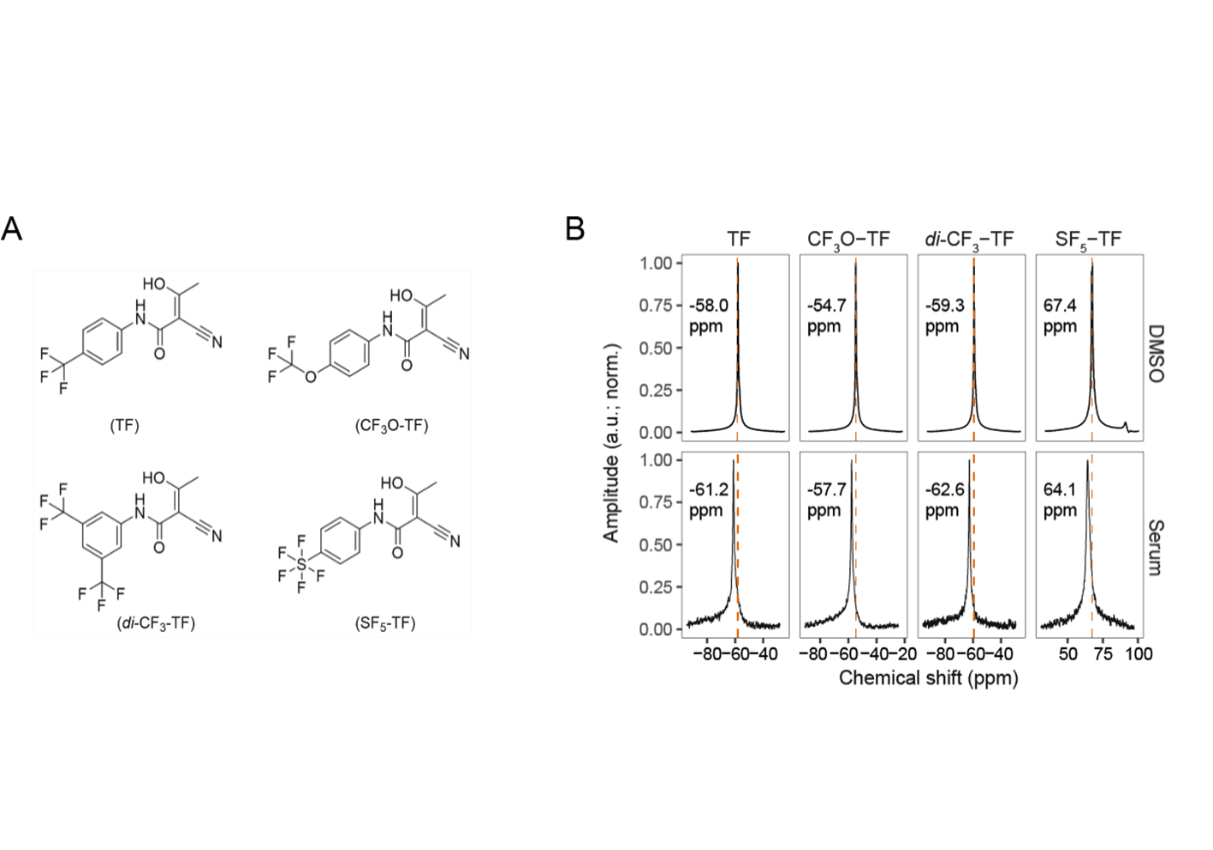
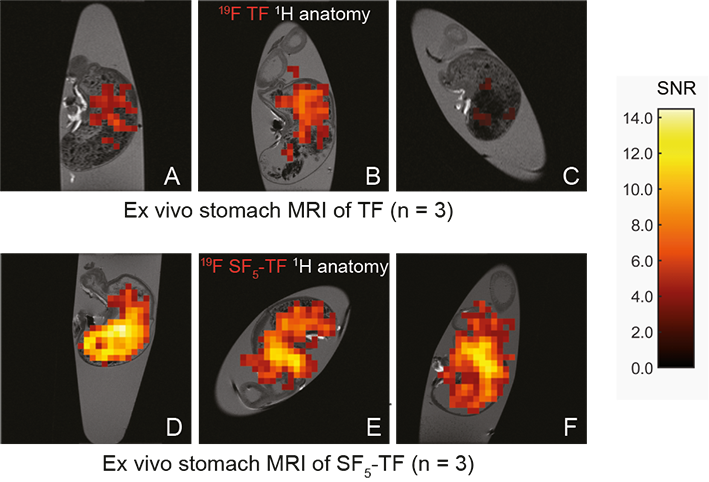
The prodrug leflunomide was synthesized via a Schotten-Baumann reaction, the isoxazol was hydrolyzed into TF and its derivatives CF3O-TF, di-CF3-TF and SF5-TF (Figure 1A). Dihydroorotate dehydrogenase (DHODH) activity was measured with a colorimetric enzyme activity assay and T cell proliferation after isolating and CFSE labeling mononuclear immune cells from healthy volunteers using a superantigen-similar polyclonal stimulant. MR methods were performed on a 9.4 T MR scanner (Bruker Biospec) using a room temperature 19F/1H mouse head RF coil.5 19F T1 and T2 were measured in DMSO and human serum using non-localized spectroscopy (blockpulse and CPMG sequences, respectively). We optimized sequence parameters of three MR methods (RARE, bSSFP and UTE) and compared SNR efficiencies.Same molar concentration of TF (12.15 mg/ml) and SF5-TF (10 mg/ml) suspended in 0.6 % carboxymethyl cellulose were administered orally (bolus volume of 800 µL) to anesthetized C57BL/6N mice. After 20 min, the animal was sacrificed by an anesthetic overdose, the stomach was removed and placed in a 5 mL tube filled with 4 % paraformaldehyde. We used RARE for anatomical 1H MRI of the stomach: TR/TE = 2000 ms/10 ms, TA = 1 min, 4 s, FOV = [28 × 28] mm², matrix = 256 × 256, slice thickness = 0.5 mm, and an optimized UTE sequence for 19F MRI of TF and SF5-TF: TR/TE = 100 ms/0.27 ms, TA = 2 h, 30 min, slice thickness = 5 mm, FATF = 25°, FASF5-TF = 42°, FOV = [28 × 28] mm², matrix = 32 × 32.
Results
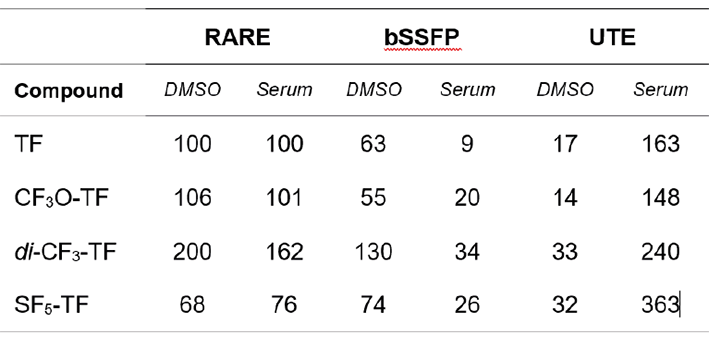
While SF5-TF showed similar cytotoxicity and similar DHODH inhibition, it showed considerably greater T cell proliferation inhibition compared to TF (Table 1). TF, CF3O-TF, di-CF3-TF exhibit a single peak at ‑58 ppm, ‑55 ppm, ‑59 ppm respectively. SF5-TF shows a peak at 67 ppm (doublet) and small peak at 91.7 ppm (pentet) in a ratio of 4:1 (Figure 1B). Spectra of compounds solubilized in serum exhibited a slight change in chemical shift and peak broadening compared to those in DMSO (Figure 1B). Compared to TF, SF5-TF has a substantially reduced T1 (Table 2). In serum, T1 for TF remained the same but was reduced for all derivatives, compared to DMSO. T2 was markedly shorter in SF5-TF. In serum T2 of all derivatives dropped dramatically to 5- 8 ms. In DMSO, RARE yielded the best SNR efficiency for all compounds, followed by bSSFP and UTE (Table 3). In serum, UTE showed the best SNR efficiency for all compounds, particularly for SF5-TF; SF5-TF showed an SNR efficiency gain of ~3 compared to TF when using UTE in serum (Table 3). We observed a clear distribution of both TF and SF5-TF in the stomach and measured peak SNR values of 13.2 ± 1.2 (mean ± maximum absolute deviation) for SF5-TF, compared to 5.8 ± 2.9 for TF (Figure 2).Discussion
In this study, we studied modifications to a pharmacologically active compound, to increase detection in vivo. Here, we addressed SNR by modifying the CF3 side chain of TF to vary 19F MR properties and identify potential SNR-boosting derivatives. Substituting the CF3 side chain by CF3O, SF5 or di-CF3 did not compromise biological activity. It rather indicated the superiority of the SF5-TF to inhibit T cell proliferation, showing improved drug activity. In serum, UTE was the MR acquisition method that provided the best SNR efficiency for all TF compounds, particularly for SF5-TF. The gain in 19F SNR efficiency of ~3 for SF5-TF using UTE translates into a 9-fold reduction in measurement time, which is the primary obstacle of 19F MRI for both clinical and preclinical applications.Conclusion
Our study indicates SF5 as a potential theranostic marker for detecting and studying the biodistribution of fluorinated drugs non-invasively. In vivo studies are now necessary to study the versatility of the SF5 bioisostere in combination with the UTE method for in vivo 19F MRI, and to determine its superiority over teriflunomide to treat disease in the animal model of multiple sclerosis.Acknowledgements
This work was supported by funding from the Germany Research Council (DFG WA2804) and received funding in part (T.N., J.M.) from the European Research Council (ERC) under the European Union's Horizon 2020 research and innovation program under grant agreement No 743077 (ThermalMR). We also thank the MDC-Weizmann Helmholtz International Research School for Imaging and Data Science from the NAno to the MESo (iNAMES).
References
1. Ruiz-Cabello J, Barnett BP, Bottomley PA, Bulte JW. Fluorine 19F MRS and MRI in biomedicine. NMR in biomedicine. 2011;24(2):114-129.
2. Reid DG, Murphy PS. Fluorine magnetic resonance in vivo: a powerful tool in the study of drug distribution and metabolism. Drug discovery today. 2008;13(11-12):473-480.
3. Niendorf T, Ji Y, Waiczies S. Fluorinated Natural Compounds and Synthetic Drugs. In: Ahrens ET, Flögel U., ed. Fluorine Magnetic Resonance Imaging. 1 ed.: Pan Stanford Publishing; 2016:311-344.
4. Prinz C, Starke L, Millward JM, et al. In vivo detection of teriflunomide-derived fluorine signal during neuroinflammation using fluorine MR spectroscopy. Theranostics. 2021;11(6):2490-2504.
5. Waiczies H, Lepore S, Drechsler S, et al. Visualizing brain inflammation with a shingled-leg radio-frequency head probe for 19F/1H MRI. Sci Rep. 2013;3:1280.
Figures
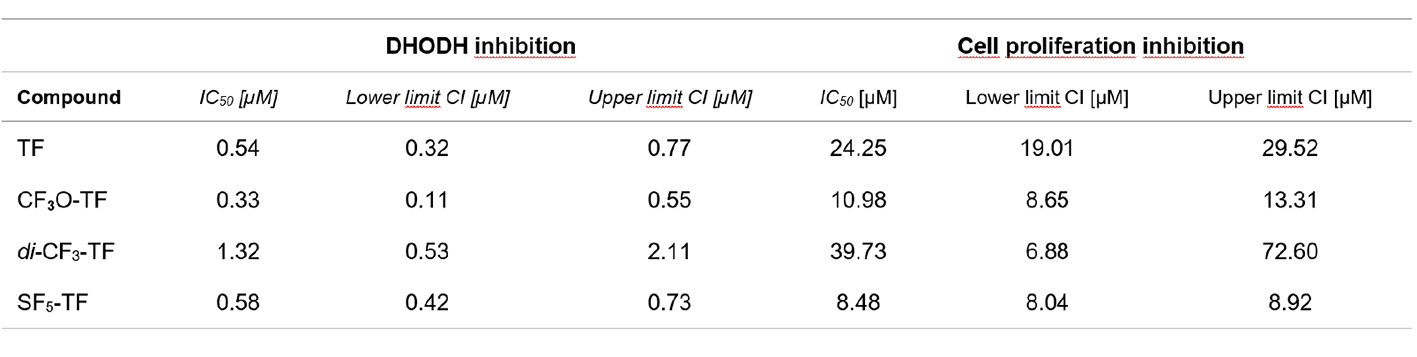
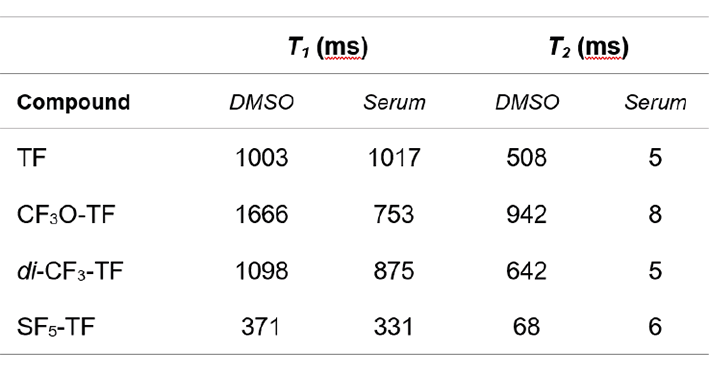
Table 2: Comparison of T1 and T2 relaxation times in DMSO and serum of TF and its derivatives to optimize the SNR efficiency of the 19F MR acquisition method.