1985
Realistic in silico abdominal QSM phantom
Javier Silva1,2,3, Carlos Milovic4, Mathias Lambert1,2,3, Cristian Montalba2,3, Cristobal Arrieta1,2,3, Sergio Uribe2,3,5, and Cristian Tejos1,2,3
1Department of Electrical Engineering, Pontificia Universidad Catolica de Chile, Santiago, Chile, 2Biomedical Imaging Center, Pontificia Universidad Catolica de Chile, Santiago, Chile, 3Millennium Nucleus for Cardiovascular Magnetic Resonance, Santiago, Chile, 4Department of Medical Physics and Biomedical Engineering, University College London, London, United Kingdom, 5Department of Radiology, School of Medicine, Pontificia Universidad Catolica de Chile, Santiago, Chile
1Department of Electrical Engineering, Pontificia Universidad Catolica de Chile, Santiago, Chile, 2Biomedical Imaging Center, Pontificia Universidad Catolica de Chile, Santiago, Chile, 3Millennium Nucleus for Cardiovascular Magnetic Resonance, Santiago, Chile, 4Department of Medical Physics and Biomedical Engineering, University College London, London, United Kingdom, 5Department of Radiology, School of Medicine, Pontificia Universidad Catolica de Chile, Santiago, Chile
Synopsis
Compared to Quantitative Susceptibility Mapping (QSM) in the brain, abdominal QSM faces additional issues due to the presence of gas and fatty tissue. Recent works in abdominal QSM are more focused on its feasibility as a biomarker for disease diagnosis than improving or assessing the robustness and quality of the reconstructions. In this work, we present an abdominal QSM phantom with realistic tissue textures. Our flexible simulation pipeline allows emulating different stages of diseases and MRI signal contributions. Our reconstruction experiments show the potential of our phantom to compare QSM algorithms in different scenarios.
Introduction
Quantitative Susceptibility Mapping (QSM) outside-of-the-brain have gained a growing interest1-3,10,11, showing its feasibility as a biomarker for hepatic iron overload1-6 and fibrosis7-8, and chronic kidney disease9. However, the application of QSM in the abdomen involves additional challenges that are usually not relevant in brain QSM: respiratory, cardiac, and gastrointestinal motion, chemical shift caused by fatty tissue, and rapid signal decay in regions with severe iron concentration2,6. Current works have been focused on modifying the preprocessing stages (i.e., before dipole inversion)2,5,12,13, and showing the contrast between healthy, mild, and severe cases1,2,4,6. As a consequence, QSM reconstructions tend to be over-regularized in order to minimize artifacts, resulting in maps with low details that only provide significant information for severe stages of the diseases2,4,6,8,9. Unlike brain QSM, in the abdomen is not feasible to acquire multiple orientations. Therefore, it is not possible to create ground truths as those generated, for example, with COSMOS14. In this work, we present a realistic numerical phantom of the abdomen, which can be used to develop, evaluate, and compare the performance of abdominal QSM algorithms.Methods
We followed a similar strategy as that used to create a brain phantom for the QSM Reconstruction Challenge 2.0 (RC2)15. A healthy volunteer was scanned in a 3T scanner (Ingenia, Philips) using a single 18s breath-hold multi-echo 3D GRE sequence (six echoes, TE1=1.8ms, $$$ \Delta $$$TE= 2.1ms, FA=10°, TR=10.8ms, FOV=38x38x18cm3, and 2mm3 isotropic voxels). Water, fat, R2* and frequency map were obtained using iterative graph cuts with a 6-peak fat model16,17. We segmented 26 tissues of the abdominal region, including organs, great vessels, bone, and fat, by using active contours and manual segmentation provided from ITK-Snap18. A mean susceptibility $$$ \overline{\chi_{t}} $$$ was assigned to each tissue (t) according to values reported in the literature. To produce realistic textures, the susceptibility of each voxel r was modulated using R2*, and water and fat signals as follows:$$\chi_{t}=\overline{\chi_{t}}+a_{t}\cdot\left(R_{2}^{\ast}(r)+\overline{R_{2t}^{\ast}}\right)+b_{t}\cdot\left(\rho_{w}(r)+\overline{p_{wt}}\right)+c_{t}\cdot\left(\rho_{f}(r)-\overline{\rho_{ft}}\right)$$
where $$$ \overline{R_{2t}^{\ast}} $$$ , $$$ \overline{\rho_{wt}} $$$ and $$$ \overline{\rho_{ft}} $$$ are respectively the mean apparent transverse relaxation rate, the water component and the fat component of the tissue class . $$$ a_{t} $$$, $$$ b_{t} $$$ and $$$ c_{t} $$$ are the modulation factors for the tissue class $$$ t $$$ , which were set by inverting the modulation equation for every tissue class. To simulate partial volume effects and smooth transitions, tissue interfaces were blurred with a Gaussian mask.
The local field map $$$ \Delta\omega_{\chi L} $$$ was computed convolving the susceptibility map with the dipole kernel19,20 masking out air regions. Similarly, the total filed map $$$ \Delta\omega_{\chi T} $$$ was computed convolving with the dipole kernel, but this time the ROI was mirrored both sides in the axial direction and air regions remained unmasked. This was used to simulate complex signal images (Simulated Gradient Echo acquisition), computed as:
$$ S=M_{0}\cdot e^{-TE\cdot R_{2}^{\ast}+i\cdot\left(TE\cdot\Delta\omega_{\chi}\right)} $$
where $$$ \Delta\omega_{\chi } $$$ can be the total or local frequency shift attributed to magnetic susceptibility. Flip angle and T1 effects were neglected. As a first approach to a water and fat signal, a 1-peak fat model was computed:
$$ S_{1-peak}=S\cdot\left(1-FF\right)+S\cdot FF\cdot e^{i\cdot\left(TE\cdot\Delta\omega_{f}\right)} $$
where $$$ \Delta\omega_{f} $$$ is the fat frequency shift, and is the proton density fat fraction.
To validate the behaviour and appearance of our phantom, we performed three experiments:Forward Simulations: We compared the simulated susceptibility, local field and total field with the experimental susceptibility, local field and total field results derived from a standard pipeline reconstruction (R2*-IGC16,17 + PDF21 + MEDI22) of the in vivo data. We also simulated the 1-peak fat model for 6 echo times (TE1=1.8 ms, $$$\Delta$$$TE= 2.1ms).
Disease simulations: We modified the mean susceptibility and modulation parameter to simulate three abdominal pathologies described in literature: hemochromatosis6,23, hemosiderosis6,23, and chronic kidney disease9. The main purpose was to verify whether the phantom maintained realistic textures under different susceptibility scenarios.
QSM reconstructions of the local field: To evaluate the potential of our phantom as a ground truth for QSM assessment, we compared the reconstruction quality of two different reconstruction algorithms: FANSI24 and NDI25.
Results
The created phantom has a similar appearance to the experimental counterparts in almost the entire abdominal region, with small differences close to the bones and the external boundaries (Figure 1). It also effectively simulate water and fat component and the evolution of the phase signal for different echo times (Figure 2). Figure 3 shows the phantoms generated for different diseases. It is observed that the tissue transitions remain smooth, even for abrupt susceptibility transitions in the hemochromatosis and hemosiderosis scenarios. Figure 4 shows the QSM reconstructions for NDI and nlTV. It is observed that RMSE is under 0.5 and reconstructions are consistent with ground truth.Discussion & Conclusion
We presented a numerical phantom for abdominal QSM. The phantom effectively simulated susceptibility values and their corresponding phase signal, showing a realistic texture appearance. Parameters and the processing pipeline were defined in a way that is straightforward to modify them and create different susceptibility scenarios which could mimic some pathological conditions.Acknowledgements
This work has been funded by projects Fondecyt 1191710 and 1181057, PIA-ACT192064, and the Millennium Nucleus on Cardiovascular Magnetic Resonance of the Millennium Science Initiative NCN17_129, by the National Agency for Research and Development, ANID. Dr Carlos Milovic is supported by Cancer Research UK Multidisciplinary Award C53545/A24348.References
- Hernando D, Cook RJ, Diamond C, Reeder SB. Magnetic susceptibilityas a B0 field strength independent MRI biomarker of liver iron overload.Magn Reson Med. 2013;70:648–656.
- Sharma SD, Hernando D, Horng DE, Reeder SB. Quantitative susceptibility mapping in the abdomen as an imaging biomarker of hepatic iron overload. Magn Reson Med 2015;74:673–683
- Sharma SD, Fischer R, Schoennagel BP, Nielsen P, Kooijman H, Yamamura J, Adam G, Bannas P, Hernando D, Reeder SB. MRI-based quantitative susceptibility mapping (QSM) and R2* mapping of liver iron overload: Comparison with SQUID-based biomagnetic liver susceptometry. Magn Reson Med. 2017;78(1):264-270
- Lin H, Wei H, He N, Fu C, Cheng S, Shen J, Wang B, Yan X, Liu C, Yan F. Quantitative susceptibility mapping in combination with water-fat separation for simultaneous liver iron and fat fraction quantification. Eur Radiol. 2018;28(8):3494-3504
- Tipirneni-Sajja A, Loeffler RB, Hankins JS, Morin C, Hillenbrand CM. Quantitative Susceptibility Mapping Using a Multispectral Autoregressive Moving Average Model to Assess Hepatic Iron Overload. J Magn Reson Imaging. 2021;54(3):721-727
- Jafari R, Sheth S, Spincemaille P, Nguyen TD, Prince MR, Wen Y, Guo Y, Deh K, Liu Z, Margolis D, Brittenham GM, Kierans AS, Wang Y. Rapid automated liver quantitative susceptibility mapping. J Magn Reson Imaging. 2019;50(3):725-732
- Jafari R, Hectors SJ, Koehne de González AK, Spincemaille P, Prince MR, Brittenham GM, Wang Y. Integrated quantitative susceptibility and R2 * mapping for evaluation of liver fibrosis: An ex vivo feasibility study. NMR Biomed. 2021;34(1):e4412
- Qu Z, Yang S, Xing F, Tong R, Yang C, Guo R, Huang J, Lu F, Fu C, Yan X, Hectors S, Gillen K, Wang Y, Liu C, Zhan S, Li J. Magnetic resonance quantitative susceptibility mapping in the evaluation of hepatic fibrosis in chronic liver disease: a feasibility study. Quant Imaging Med Surg. 2021;11(4):1170-1183
- Bechler, E., Stabinska, J., Thiel, T., Jasse, J., Zukovs, R., Valentin, B., Wittsack, H.-J., Ljimani, A., 2021. Feasibility of quantitative susceptibility mapping (QSM) of the human kidney. Magnetic Resonance Materials in Physics, Biology and Medicine 34, 389–397
- Dimov AV, Liu T, Spincemaille P, Ecanow JS, Tan H, Edelman RR, Wang Y. Joint estimation of chemical shift and quantitative susceptibility mapping (chemical QSM). Magn Reson Med 2015;73:2100–2110.
- Straub S, Laun FB, Emmerich J, et al. Potential of quantitative susceptibility mapping for detection of prostatic calcifications. J Magn Reson Imaging 2016;45:889–898
- Dong J, Liu T, Chen F, Zhou D, Dimov A, Raj A, Cheng Q, Spincemaille P, Wang Y. Simultaneous phase unwrapping and removal of chemical shift ( SPURS ) using graph cuts: application in quantitative susceptibility mapping. IEEE Trans Med Imaging 2015;34:531–540
- Karsa A, Shmueli K. SEGUE: A Speedy rEgion-Growing Algorithm for Unwrapping Estimated Phase. IEEE Trans Med Imaging. 2019;38(6):1347-1357
- Liu T, Spincemaille P, de Rochefort L, Kressler B, Wang Y. Calculation of susceptibility through multiple orientation sampling (COSMOS): a method for conditioning the inverse problem from measured magnetic field map to susceptibility source image in MRI. Magn Reson Med 2009; 61: 196– 204.
- Marques JP, Meineke J, Milovic C, Bilgic B, Chan KS, Hedouin R, van der Zwaag W, Langkammer C, Schweser F. QSM reconstruction challenge 2.0: A realistic in silico head phantom for MRI data simulation and evaluation of susceptibility mapping procedures. Magn Reson Med. 2021;86(1):526-542
- Hernando D, Kellman P, Haldar JP, Liang ZP. Robust water/fat separation in the presence of large field inhomogeneities using a graph cut algorithm. Magn Reson Med. 2010;63(1):79-90
- Hernando D, Kramer JH, Reeder SB. Multipeak fat-corrected complex R2* relaxometry: theory, optimization, and clinical validation. Magn Reson Med. 2013 Nov;70(5):1319-3
- Yushkevich PA, Piven J, Hazlett HC, et al. User- guided 3D active contour segmentation of anatomical structures: significantly im-proved efficiency and reliability. Neuroimage. 2006;31:1116- 1128. (Version 3.6)
- Salomir R, De Senneville BD, Moonen CT. A fast calculation method for magnetic field inhomogeneity due to an arbitrary distribution of bulk susceptibility. Concepts in Magnetic Resonance. 2003;19B(1):26-34
- Marques JP, Bowtell R. Application of a Fourier-based method for rapid calculation of field inhomogeneity due to spatial variation of magnetic susceptibility. Concepts in Magnetic Resonance Part B: Magnetic Resonance Engineering. 2005;25B(1):65-78
- Liu T, Khalidov I, de Rochefort L, Spincemaille P, Liu J, Tsiouris AJ, Wang Y. A novel background field removal method for MRI using projection onto dipole fields (PDF). NMR Biomed. 2011;24(9):1129-36
- Liu T, Liu J, de Rochefort L, Spincemaille P, Khalidov I, Ledoux JR, Wang Y. Morphology enabled dipole inversion (MEDI) from a single-angle acquisition: comparison with COSMOS in human brain imaging. Magn Reson Med. 2011;66(3):777-83
- Labranche R, Gilbert G, Cerny M, Vu KN, Soulières D, Olivié D, Billiard JS, Yokoo T, Tang A. Liver Iron Quantification with MR Imaging: A Primer for Radiologists. Radiographics. 2018;38(2):392-412
- Milovic C, Bilgic B, Zhao B, Acosta-Cabronero J, Tejos C. Fast nonlinear susceptibility inversion with variational regularization. Magnetic Resonance in Medicine. 2018;80(2):814-821
- Polak D, Chatnuntawech I, Yoon J, Iyer SS, Milovic C, Lee J, Bachert P, Adalsteinsson E, Setsompop K, Bilgic B. Nonlinear dipole inversion (NDI) enables robust quantitative susceptibility mapping (QSM). NMR Biomed. 2020;33(12):e4271
Figures
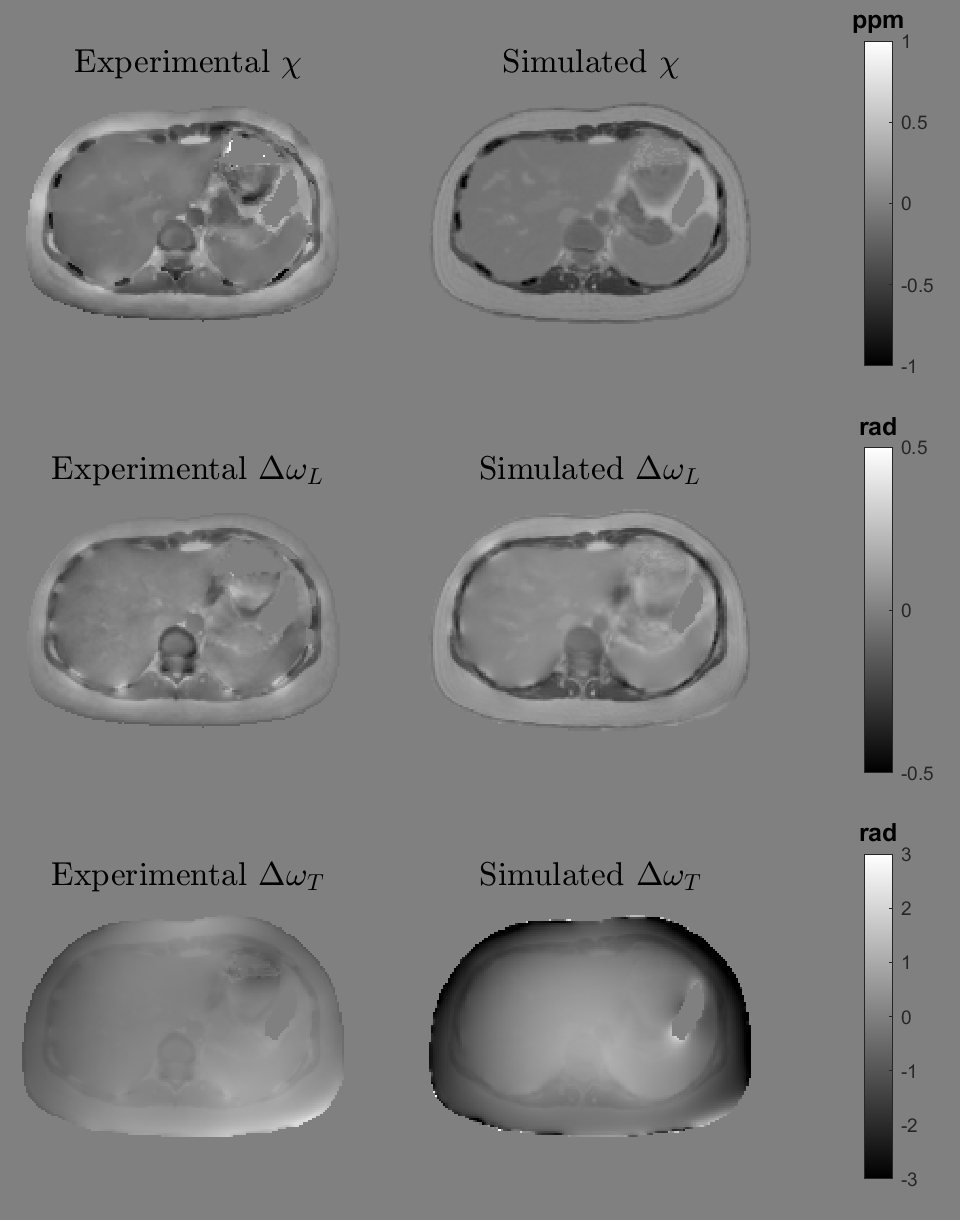
Comparison bewtween simulated and experimental susceptibility, local field map and total field map.
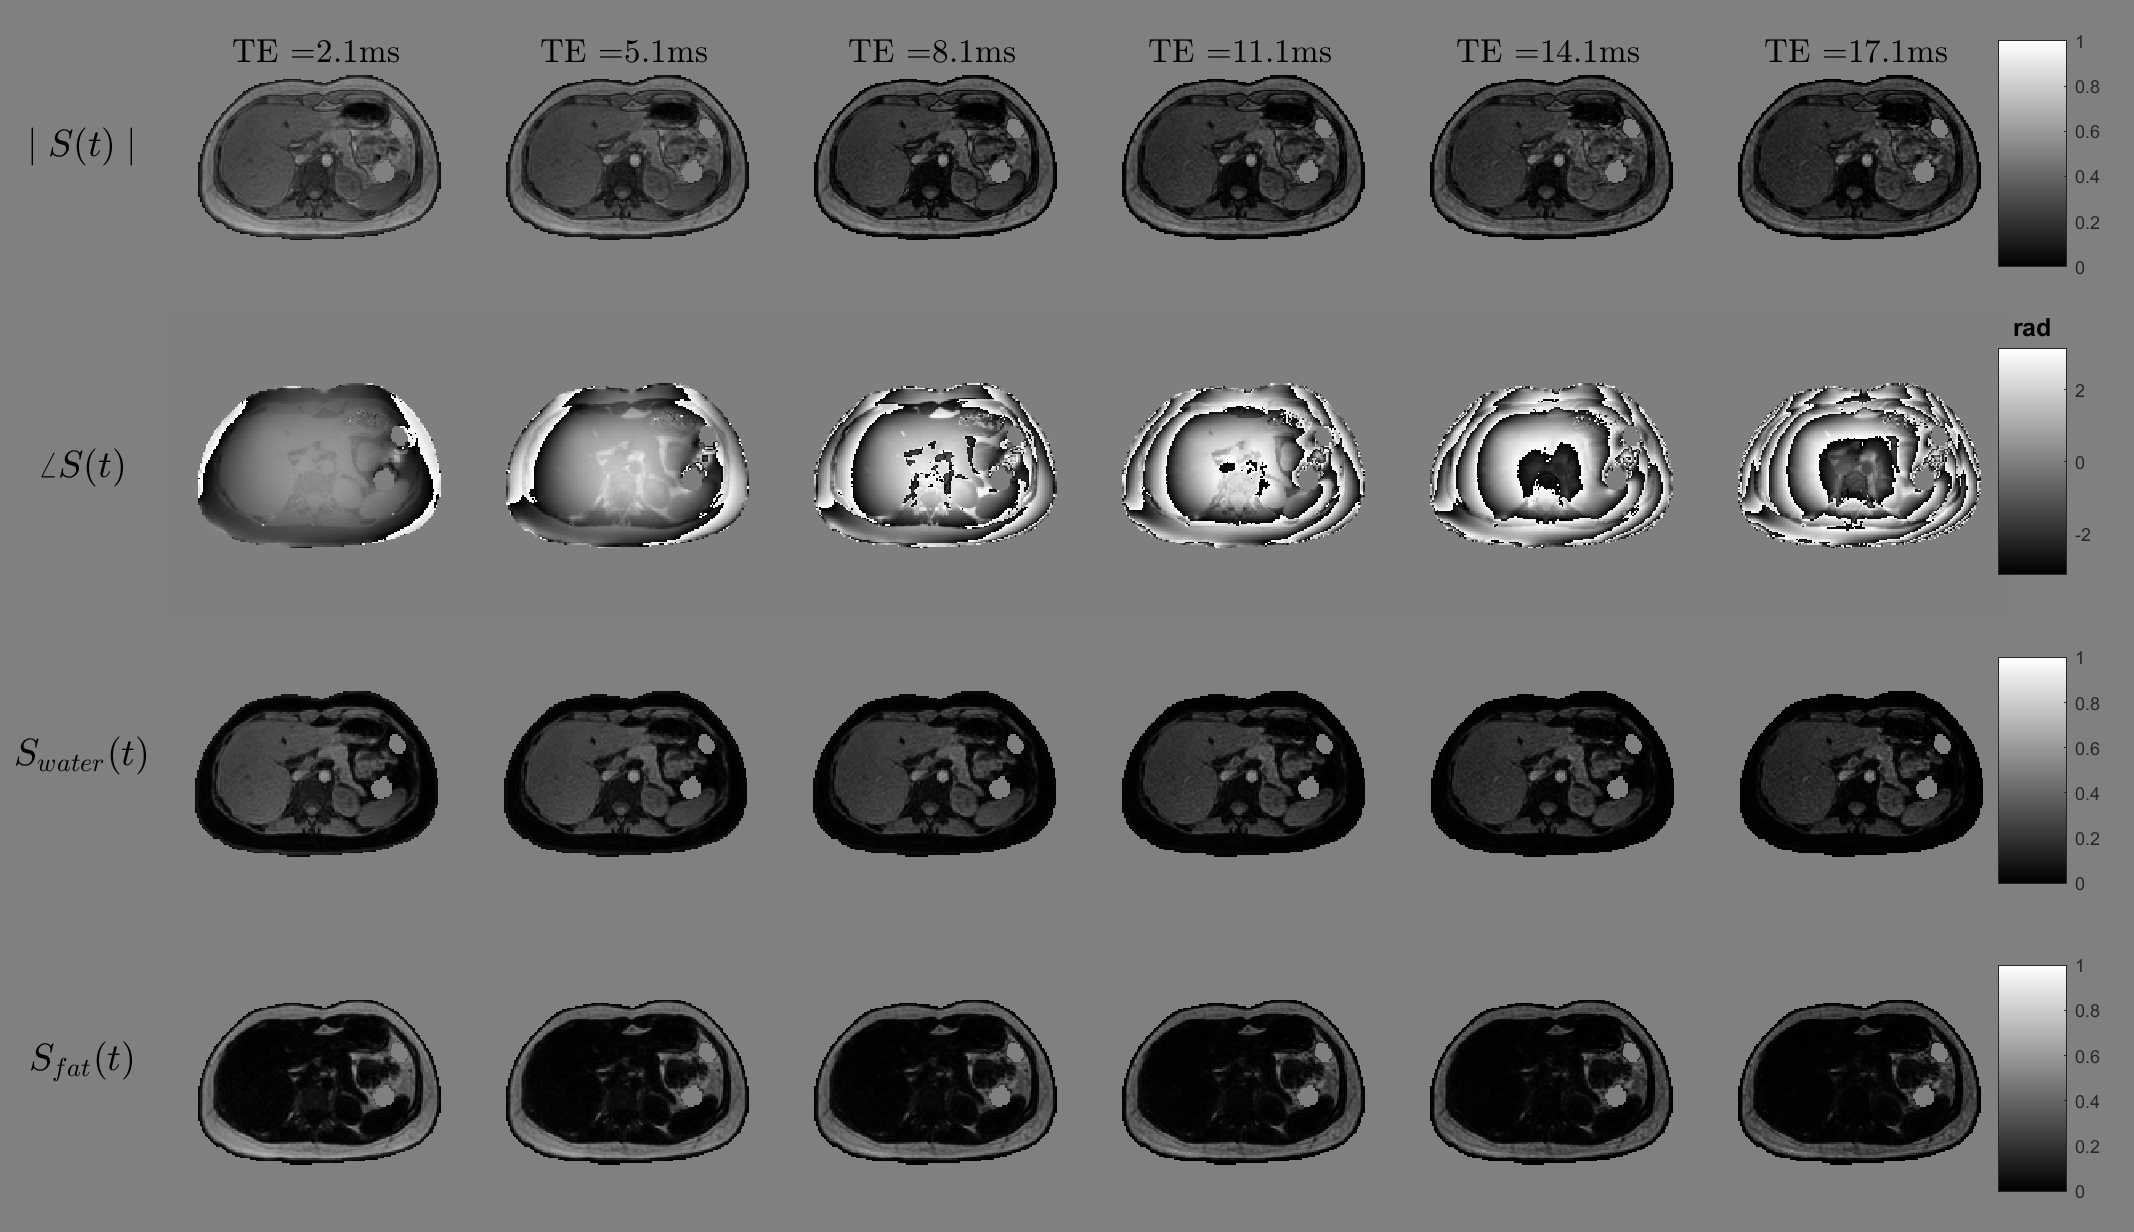
Simulations for complex signal at 6 echo times.
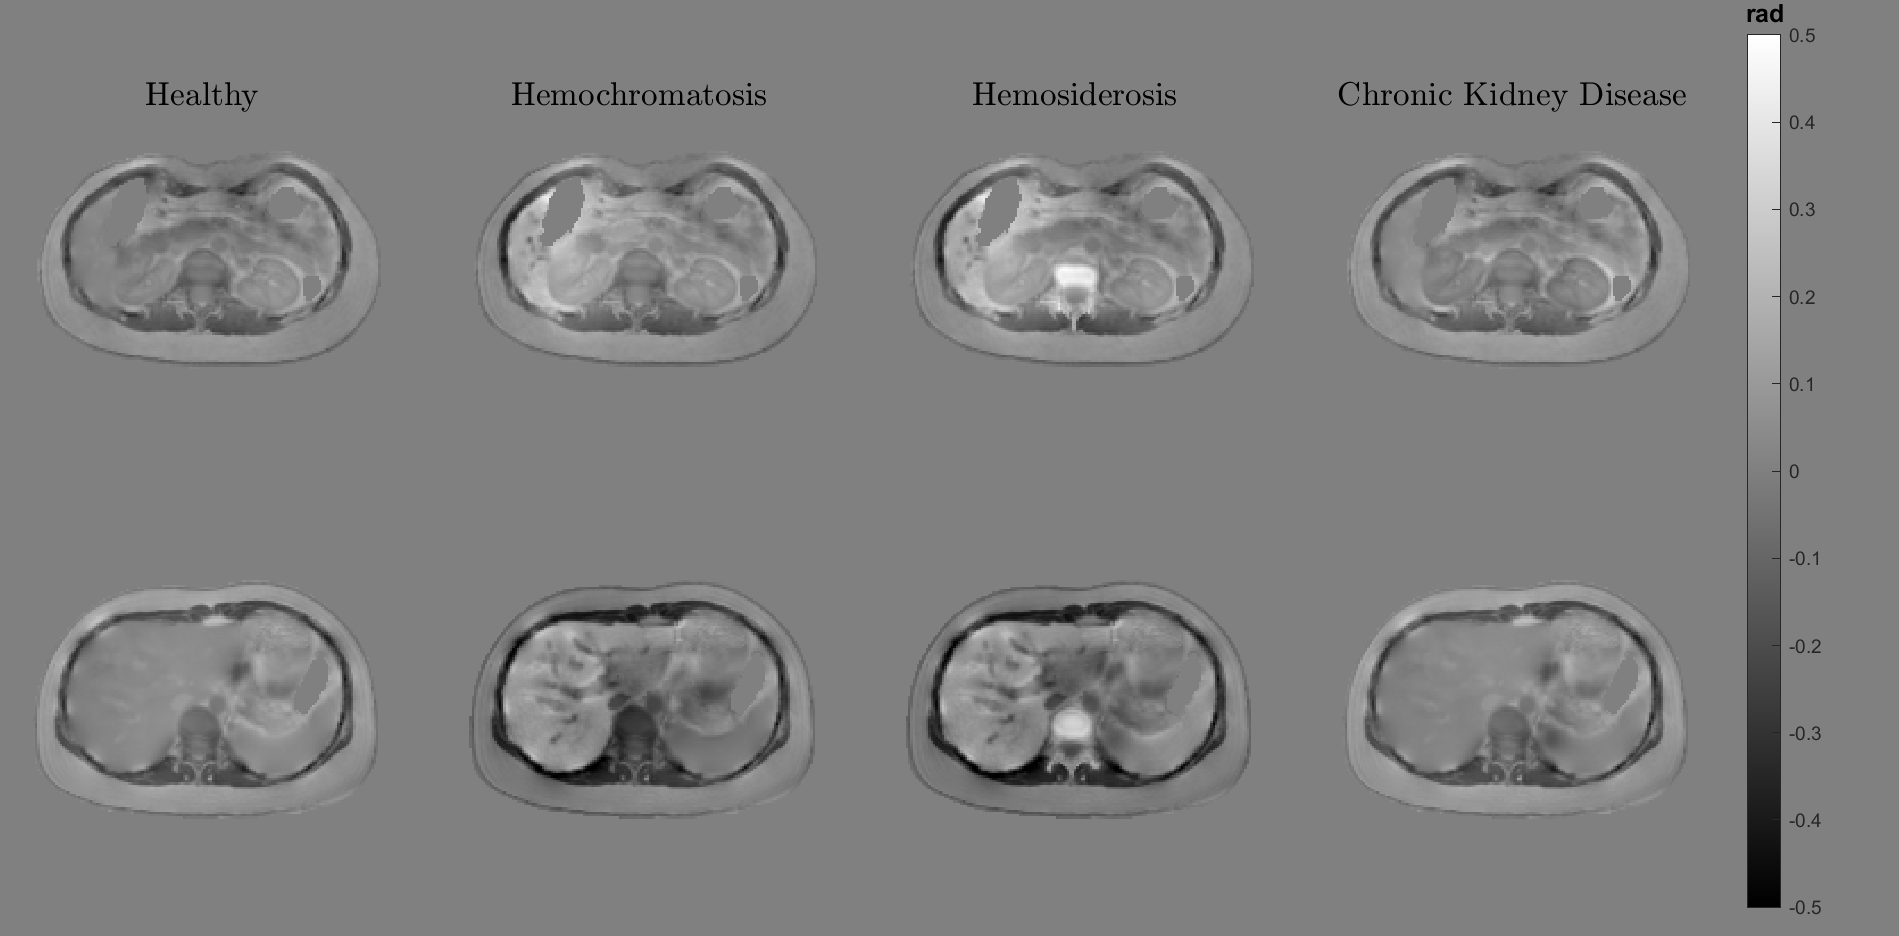
Local field simulations for different diseases.
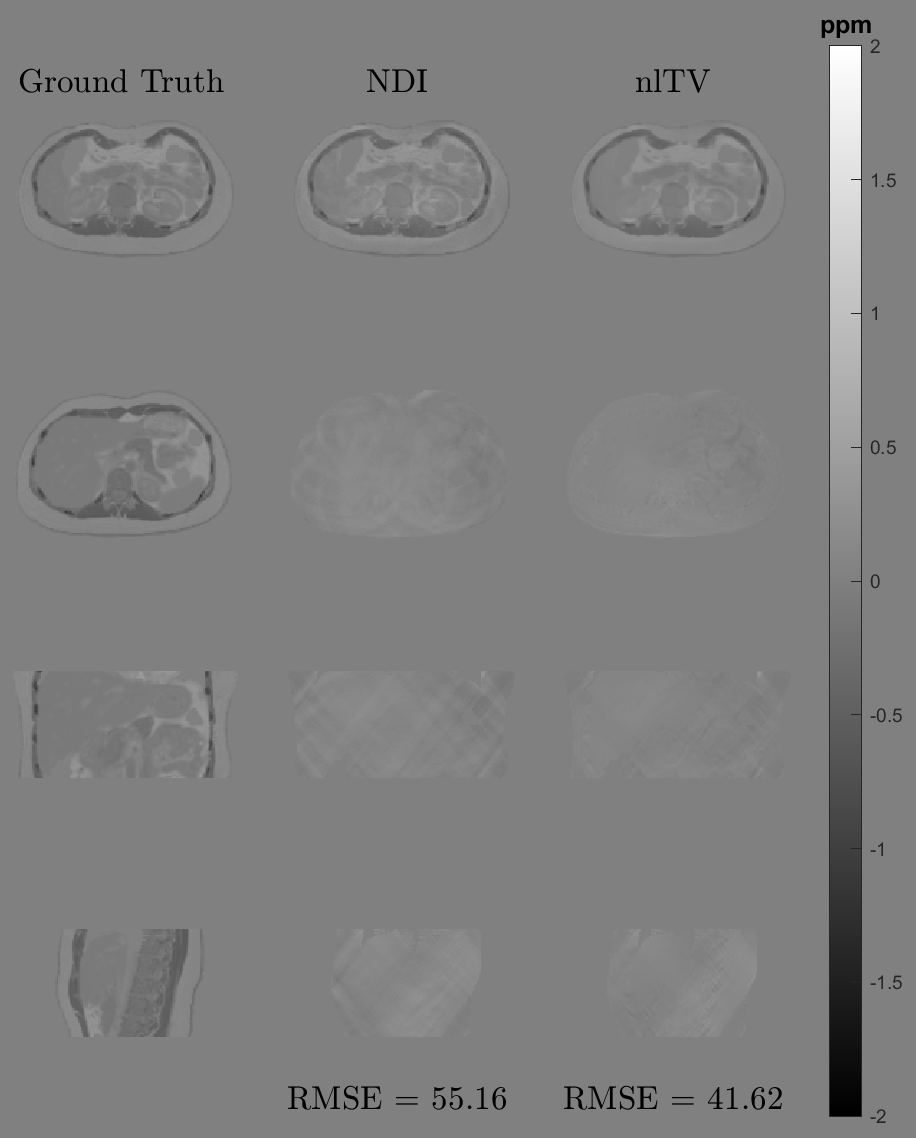
QSM reconstructions for NDI and nlTV (FANSI).
DOI: https://doi.org/10.58530/2022/1985