1984
PedQ-NET : Unsupervised Model-Based Joint-Loss Deep learning for Pediatric QSM1Department of Electrical and Electronic Engineering, Yonsei University, Seoul, Korea, Republic of, 2Division of Biomedical Engineering, Hankuk University of Foreign Studies, Yongin, Korea, Republic of, 3Department of Radiology, Catholic University of Korea, Eunpyeong St. Mary's Hospital, Seoul, Korea, Republic of
Synopsis
In conventional QSM methods, it is difficult to analyze gray matter subcortical in pediatrics, because of small contrast difference between gray matter and white matter. In addition, there are no deep learning approaches that reflect the characteristics of the pediatric brain. In this study, we propose an unsupervised model-based joint-loss deep learning network for pediatric QSM, PedQ-NET. The proposed method achieved better edge preservation on the deep gray matter subcortical areas in pediatric QSM. According to the evaluation of in-vivo pediatric data, QSM generated by PedQ-NET shows enhanced edges in the subcortical areas and clear details with reduced artifacts.
Introduction
Quantitative susceptibility mapping (QSM) is a novel MR technique that can estimate the spatial distribution of magnetic susceptibility in brain tissues.1 Therefore, QSM is increasingly used as an indirect measure of biomarkers associated with brain development in deep gray matter subcortical areas in neonates and infants.2,3 However, since minimal iron content is seen in infants4, deep gray matter nuclei boundaries are not well preserved in the conventional QSM reconstruction methods so it makes clinical analysis difficult. In addition, various supervised deep learning methods have been recently proposed to solve the QSM inverse problem. However, they are not suitable for pediatrics since they do not reflect the characteristics of children and rely on a large amount of ground-truth training data. Therefore, there are still many limitations in the clinical use of pediatric QSM by current supervised deep learning methods.To address these limitations of pediatric QSM, we propose an unsupervised model-based joint-loss deep learning method which is referred to as PedQ-NET which enhances subcortical edges and reduces artifacts.
Methods
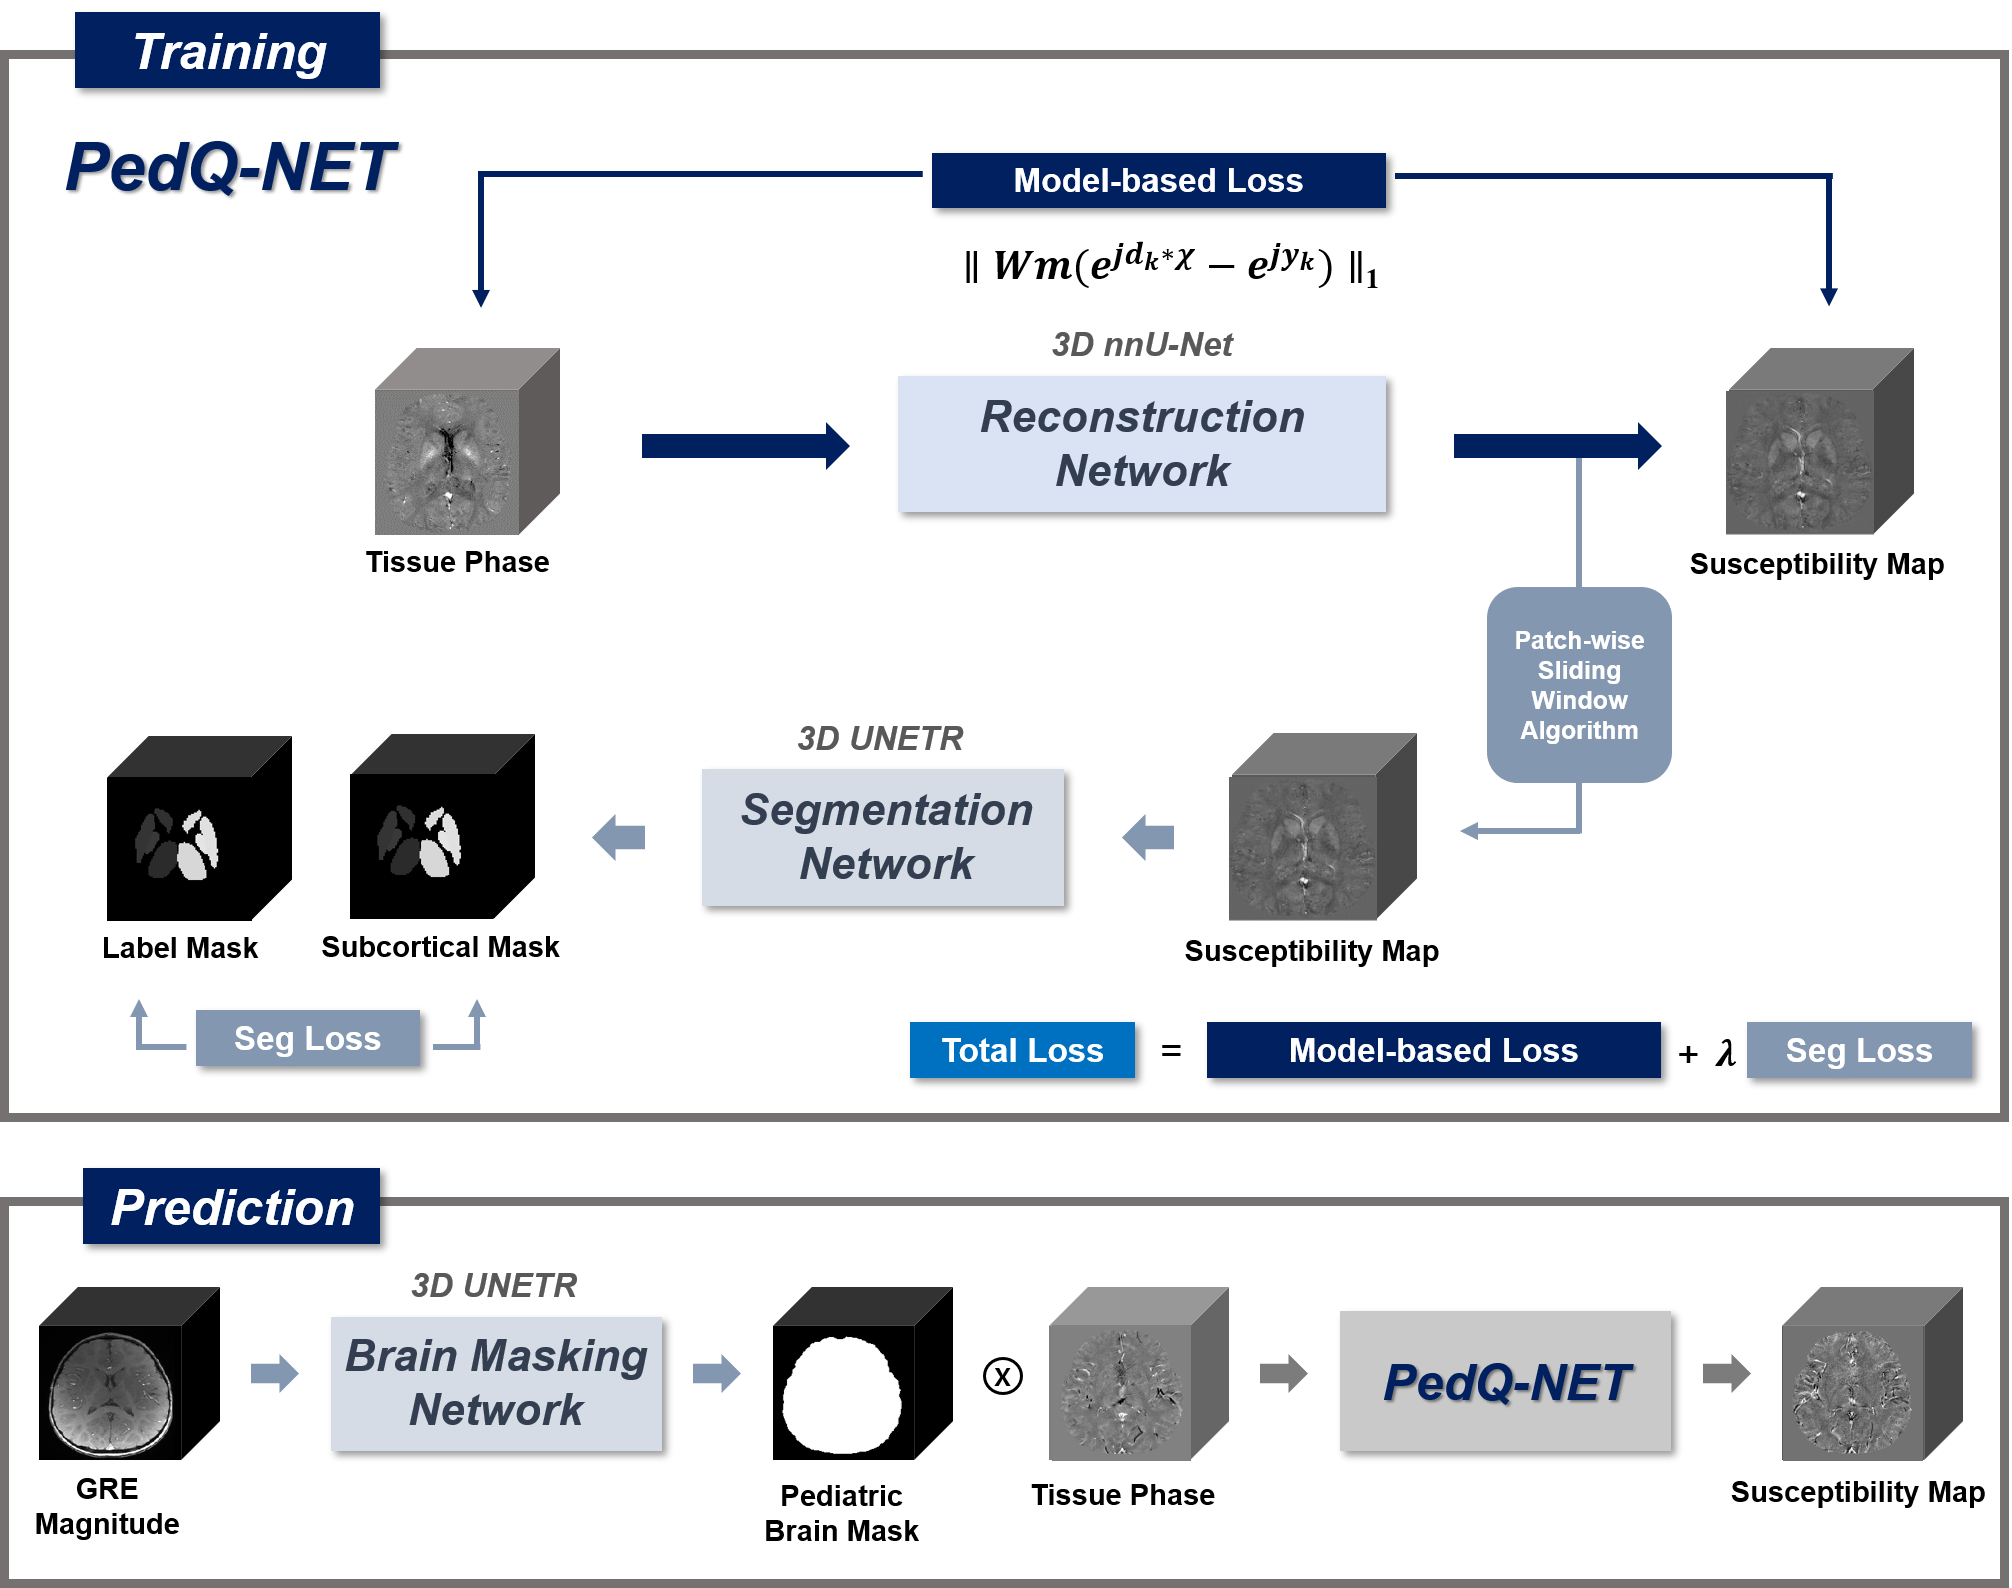
The schematic illustration of the whole procedure was shown in Figure 1. The whole process can be divided into two stages, training and prediction.[PedQ-NET]
- Network Architecture: The architecture of PedQ-NET is composed of a reconstruction network using 3D nnU-Net5 .To further accentuate the contrast in deep gray matter regions, a subcortical segmentation network using 3D UNETR6 was combined. The reconstruction network was trained with the input of the local field and the output of the reconstructed QSM. The segmentation network was trained with the input of fully reconstructed QSM and label of subcortical masks by FIRST7(FSL, L,R of Caudate; Putamen; Globus Pallidus; Thalamus). The segmentation network was attached to the final iteration of the reconstruction network. QSM that is fully reconstructed by reconstruction network using a patch-based sliding window approach enters to the attached network as an input. Finally, we used a weighted linear combination of model-based loss $$$L_{model}=\parallel Wm(e^{jd_{k}*\chi}-e^{jy_{k}})\parallel_{1}$$$ from reconstruction network where $$$W$$$ is weighting term calculated by magnitude image, $$$m$$$ is brain mask, $$$d_{k}$$$ is dipole kernel, $$$\chi$$$ is output QSM and $$$y_{k}$$$ is local field and combination of soft dice loss and cross-entropy loss $$$L_{seg}$$$ from segmentation network for training. The total loss is $$$L_{Total}=L_{model}+\lambda L_{seg}$$$.
- Training Data: The 2016 QSM challenge data8 was used for training. Since the network does not need matched QSM label data, we used 6 local field images with different orientations cropping them randomly with 3D patch in size of 96x96x96.
- Network Architecture: To reduce background artifacts due to inaccurate masks in pediatric QSM, a 3D UNETR was utilized for automatic pediatric brain masking with the input of GRE magnitude image and output of binary brain mask. A combination of soft dice loss and cross-entropy loss was used for training.
- Training Data: A total of 40 GRE magnitude images of neonates and infants with chronological age (CA) of 0-11 months (mean 4.8 weeks) were used for training. Each subject was scanned on 3T Siemens scanner with data acquisition parameters: matrix size= 256x256x80, voxel size = 0.78x0.78x2 mm3, TR/TE = 24.0/4.92ms. Brain masks were firstly generated by BET(FSL)9 and errors were manually corrected before being used as a label data. For training, images were randomly cropped with 3D patch in size of 96x96x96.
- Evaluation Data: To evaluate the whole procedure, 4 normal subjects(neonate: 7days, 8days; infant: 11months,15months) were used. Each subject for evaluation was scanned in the same way as Brain Masking Network data. Input local field maps were created from the magnitude and phase of the 3D GRE images. Brain masks were generated with our Brain Masking Network. Within the masks, the phase images were unwrapped by Laplacian-based phase unwrapping10 and local field maps were generated by V-SHARP11.
Results
Figure 2 shows the brain mask result generated by our brain masking model and BET. The network performs more accurately comparing to BET.Figure 3 shows QSM results in subjects of age under 1M. Compared with conventional methods, PedQ-NET shows more clear details and reduced blooming artifacts especially in the internal cerebral vein.
Figure 4 shows QSM results in subjects of age near 1Y. Compared with conventional methods, subcortical edges in QSM are well preserved in deep learning approaches. When comparing nnU-Net_TV and PedQ-NET, PedQ-NET shows further enhanced subcortical edges.
Discussion
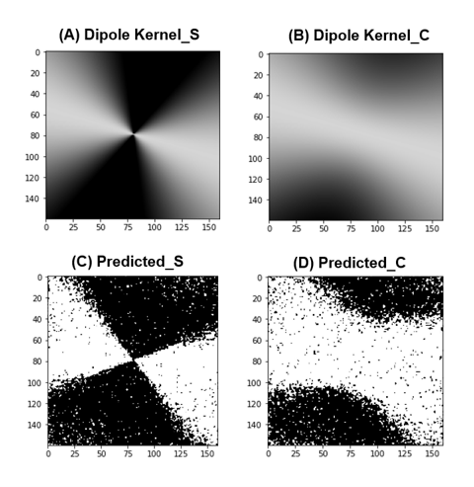
Since the pediatric clinical data are usually obtained with various tilted orientations, we used various orientations and dipole kernels that were calculated to fit in each data’s B0 direction. Figure 5 shows predicted dipole kernels calculated backward from PedQ-Net output. It remains unclear which of the predicted QSM and conventional QSM is more accurate because of no golden standard of QSM and lack of quantitative assessment. However, the result from Fig 5 can be a measure that shows indirectly the correctness of PedQ-NET.Conclusion
We have proposed a novel deep learning method for pediatric QSM reconstruction, PedQ-NET. It can reconstruct QSM well regardless of dynamic brain development in pediatrics. Pediatric QSM with clearer deep gray matter subcortical edges and reduced artifact from PedQ-NET can also be powerful tool in clinical research for pediatrics.Acknowledgements
No acknowledgement found.References
1. Schweser, F., Deistung, A., Lehr, B.W., Reichenbach, J.R. Quantitative imaging of intrinsic magnetic tissue properties using MRI signal phase: an approach to in vivo brain iron metabolism?. NeuroImage. 2011;54:2789–2807.
2. Darki F, Nemmi F, Moller A, Sitnikov R, Klingberg T. Quantitative susceptibility mapping of striatum in children and adults, and its association with working memory performance. NeuroImage. 2016;136:208–214.
3. Carpenter KL, Li W, Wei H, et al. Magnetic susceptibility of brain iron is associated with childhood spatial IQ. NeuroImage. 2016;132:167–174.
4. Zhang Y, Wei H, Cronin MJ, He N, Yan F, Liu C. Longitudinal atlas for normative human brain development and aging over the lifespan using quantitative susceptibility mapping. NeuroImage. 2018;171:176–189.
5. Isensee, F., Jaeger, P.F., Kohl, S.A.A. et al. nnU-Net: a self-configuring method for deep learning-based biomedical image segmentation. Nat Methods. 2021;18: 203–211.
6. Hatamizadeh, A.; Yang, D.; Roth, H.; Xu, D. Unetr: Transformers for 3D Medical Image Segmentation. arXiv. 2021;2103.10504.
7. Patenaude, B., Smith, S.M., Kennedy, D., and Jenkinson M. A Bayesian Model of Shape and Appearance for Subcortical Brain. NeuroImage. 2011;56(3):907-922.
8. Langkammer C, Schweser F, Shmueli K, et al. Quantitative Susceptibility Mapping: Report from the 2016 Reconstruction Challenge. Magnetic Resonance in Medicine. 2018;79:1661–1673.
9. S.M.Smith. Fast robust automated brain extraction. Hum.Brain Mapp. 2002;17:143-155.
10. Schofield, M. A. and Y. Zhu. Fast phase unwrapping algorithm for interferometric applications. Optics letters. 2003;28(14):1194-1196.
11. Wu, B., W. Li, A. Guidon and C. Liu. Whole brain susceptibility mapping using compressed sensing. Magnetic Resonance in Medicine. 2012;67(1):137-147.
Figures