1982
Quantitative Susceptibility Mapping (QSM) Using High-resolution Ultra-Short Echo Time (UTE) MRI with Rosette k-space Pattern1Elmore Family School of Electrical and Computer Engineering, Purdue University, West Lafayette, IN, United States, 2Weldon School of Biomedical Engineering, Purdue University, West Lafayette, IN, United States, 3School of Health Sciences, Purdue University, West Lafayette, IN, United States, 4Department of Radiology, Medical Physics, Medical Center – University of Freiburg, Faculty of Medicine, University of Freiburg, Freiburg, Germany, 5Wellcome Centre for Integrative Neuroimaging, University of Oxford, Oxford, United Kingdom, 6School of Materials Engineering, Purdue University, West Lafayette, IN, United States
Synopsis
We developed a method of acquiring high-resolution MRI for the generation of Quantitative Susceptibility Mapping (QSM) using Ultra-short echo time (UTE) MRI with a novel 3D rosette k-space trajectory. This method was used to generate high-resolution (0.94 mm3 isotropic) magnetic susceptibility maps in an Iron-Chloride phantom and the human brain. Generated maps were then compared with the susceptibility maps reconstructed from low-resolution data acquired using multi-echo UTE acquisition. Susceptibility values were comparable with current literature demonstrating the promise of this novel method in the generation of QSM.
Introduction
Quantitative Susceptibility Mapping (QSM) is used to measure the concentrations of certain substances, like Iron, using the local change in magnetic susceptibility [1]. The paramagnetic nature of Iron increases the local magnetic field and hence, the precession, causing the relative phase to accumulate over the echo time (TE). The magnetic field becomes more inhomogeneous with increased iron content, which results in a shorter transverse relaxation time (T2*). Previous in-vivo attempts to monitor the iron content using conventional gradient echo (GRE) techniques include quantitative susceptibility mapping (QSM) but pose a challenge due to Iron's very short T2* values. Due to the extremely short T2* values, susceptibility measurements require Ultrashort echo (UTE), Zero echo time (ZTE), or Sweep Imaging with Fourier Transform (SWIFT) [2] to quantify the higher concentration of magnetic particles [3]. In this study, we propose the use of novel Ultrashort echo time MRI with rosette trajectory to acquire high resolution 0.94mm3 isotropic images for the susceptibility mapping.Methods
Five healthy subjects underwent brain scans with a whole-body 3T MRI scanner (PRISMA, Siemens Healthineers, Erlangen, Germany). A vendor-supplied 20-channel receiver head coil was used for all volunteers. A 3D dual-echo UTE sequence with rosette k-space sampling sequence was performed with parameters of field of view (FOV) = 240×240×240mm3, matrix size = 120×120×120, readout dwell time = 10μs, flip angle = 7o, TR = 7ms, Readout duration = 2.1ms. Two repeated dual-echo UTE scans were performed with varied TEs. The first TEs were 20μs and 1ms followed by second echoes of 2μs and 3ms, respectively. Total acquisition of a single dual-echo acquisition was 4.2 minutes. In addition, a higher resolution 3D dual-echo UTE (TE1 = 20μs and TE2 = 4ms) sequence with rosette k-space sampling sequence was performed with parameters of field of view (FOV) = 240×240×240mm3, matrix size = 256×256×256, flip angle = 7o, TR = 7 ms, Readout duration = 4.1 ms, acceleration factor = 2. Total acquisition of a single dual-echo high-resolution acquisition was 8.7 minutes. Phantom (iron chloride (FeCl2)) experiments were conducted with identical parameters.The iron chloride phantom was prepared by filling 15mL cylindrical vials with different concentrations of iron chloride solution (0.5, 1, 2, 3.5, 5, 7.5, 10, 25 and 50mM ) with 1% of agar. These vials were further suspended in a container filled with 1% agar.
Image reconstruction and post-processing steps were performed on MATLAB (MathWorks, USA) platform. Non-uniform fast Fourier transform (NUFFT) was used to calculate the forward encoding transform of the acquired k-space data [4]. A compressed sensing approach was used for image reconstruction, using total generalized variation (TGV) as the sparsifying penalty [5].
The 3D volume images procured were then used in producing QSM using the Morphology Enabled Dipole Inversion (MEDI) algorithm [6]. For the 2-mm3 isotropic resolution in-vivo data, susceptibility maps were generated using four echoes i.e., echo times 20μs, 1ms, 2ms and 3ms and using only two echoes i.e., 20μs and 2ms echoes. Susceptibility mapping for the high-resolution data (0.94mm3 isotropic) was carried out using echo times 20μs and 4ms. Similarly, susceptibility maps were generated using five echo times, 20μs, 0.6ms, 1ms, 2ms, 3ms and two echoes, 20μs, 2ms with the Iron chloride phantom images of 2mm3 isotropic resolution.
Results
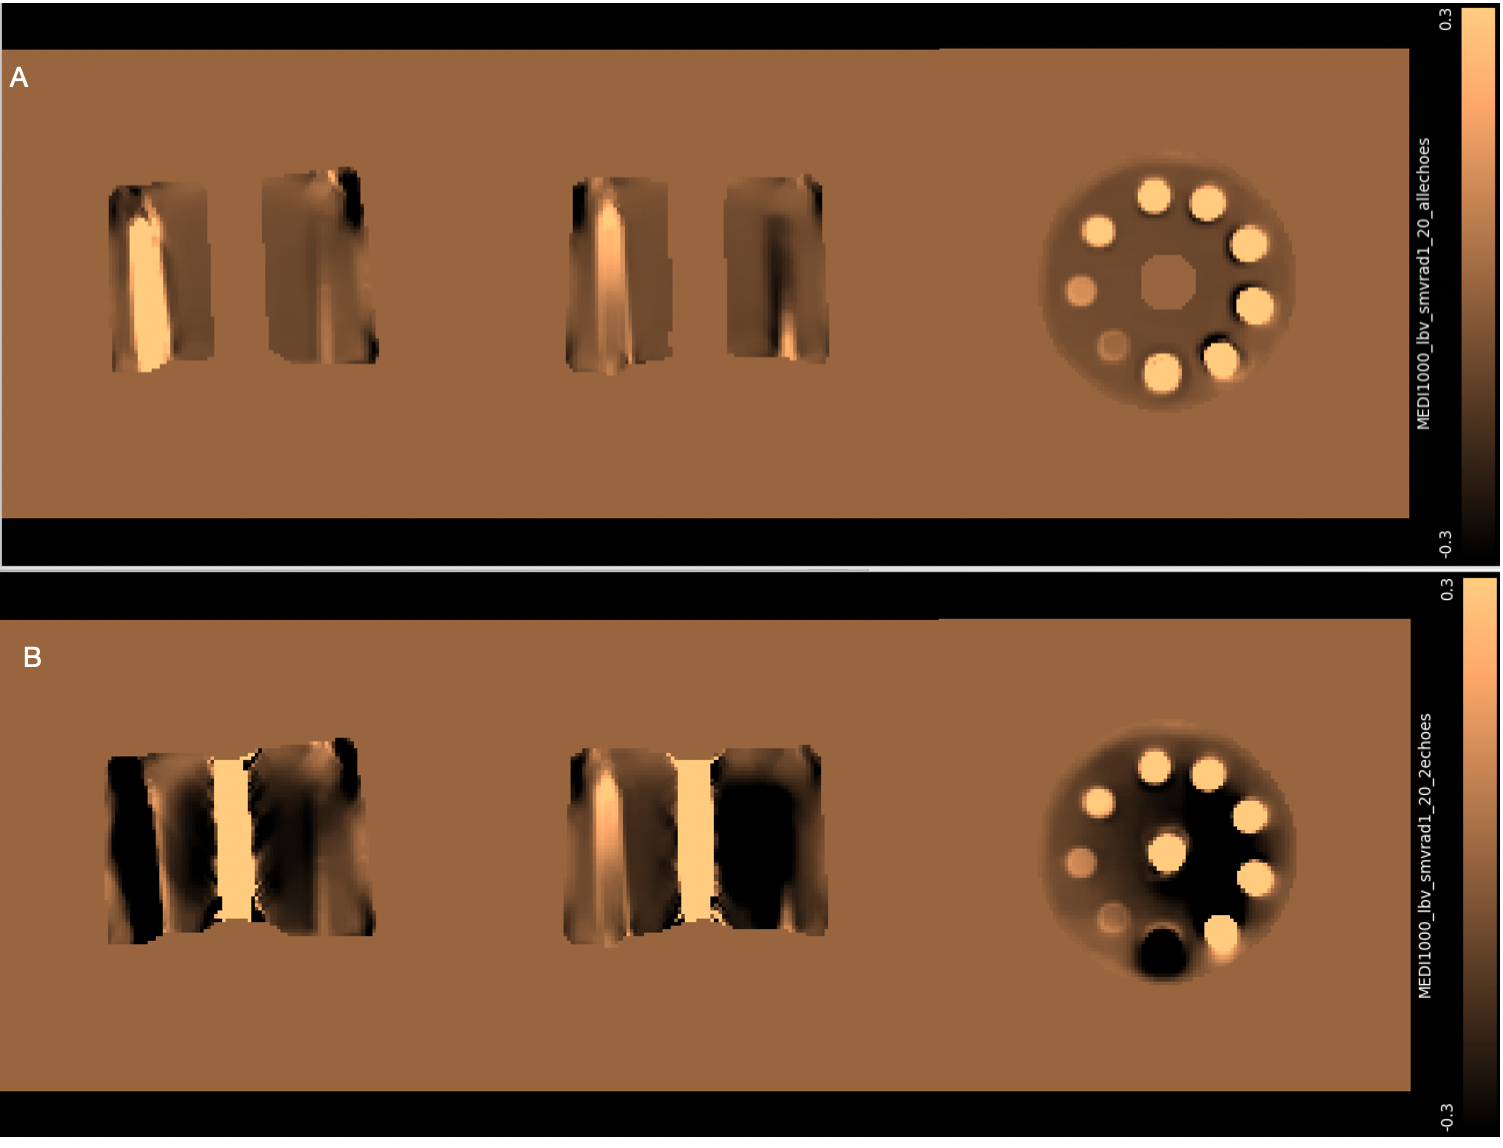
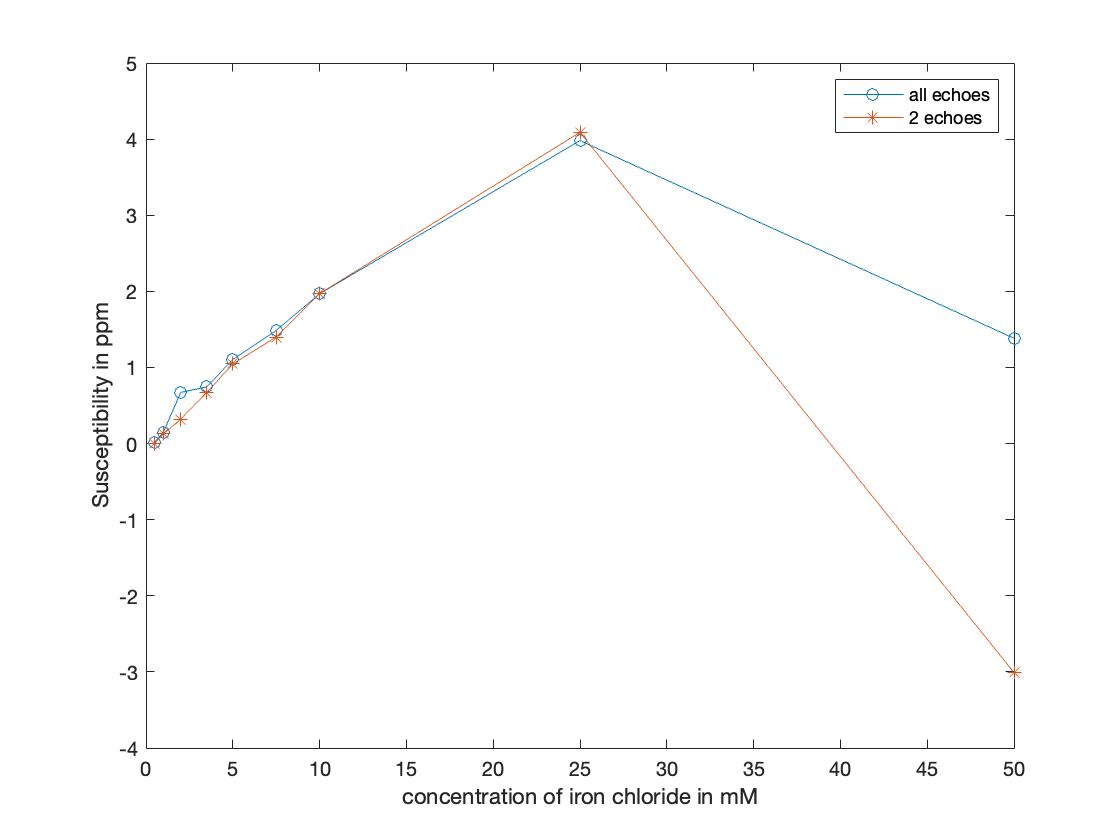
Figure1 shows the susceptibility maps for the Iron Chloride phantom. A linear relationship was observed between the susceptibility measurements and the iron chloride concentration (Figure2). Structural Similarity Index (SSIM) was calculated to be 0.9542 for the maps constructed from two echoes (20μs and 2ms) using the susceptibility maps generated from five echoes (20μs, 0.6ms, 1ms, 2ms and 3ms) as a reference.Figure3 shows the QSM results for all techniques used for the in-vivo data. Susceptibility measurements that were recorded from significant areas of the brain for all three methods of generating QSM were comparable with the existing literature [7-9]. SSIM was used to compare the maps generated from each technique. QSM constructed using data from four echoes was used as the reference image for each analysis. Susceptibility maps generated using two echoes had an SSIM of 0.9603, whereas high-resolution data QSM had an SSIM of 0.9495.
Discussion
As seen in Figure2 , a linear relationship exists between the concentration of iron chloride and the susceptibility measurements for lower concentrations. At 50mM, it deviates. This can be explained by the high dependence of susceptibility measurements on the iron loading, echo times and ΔTE.[3]The comparable susceptibility measurements recorded from all techniques of QSM generation for in-vivo data and the high structural similarity indices indicate that the proposed method provides moderately accurate measurements with a high resolution (0.94mm3 isotropic).
Acknowledgements
Data acquisition was supported in part by NIH grant S10 OD012336 - 3T MRI Scanner dedicated to Life Sciences Research.References
[1] Langkammer, Christian, et al. "Quantitative susceptibility mapping (QSM) as a means to measure brain iron? A post mortem validation study." Neuroimage 62.3 (2012): 1593-1599.
[2] Zhang, Jinjin, et al. "Quantifying iron‐oxide nanoparticles at high concentration based on longitudinal relaxation using a three‐dimensional SWIFT look‐locker sequence." Magnetic resonance in medicine 71.6 (2014): 1982-1988.
[3] Lu, Xing, et al. "Simultaneous quantitative susceptibility mapping (QSM) and for high iron concentration quantification with 3D ultrashort echo time sequences: An echo dependence study." Magnetic resonance in medicine 79.4 (2018): 2315-2322.
[4] Fessler, Jeffrey A., and Bradley P. Sutton. "Nonuniform fast Fourier transforms using min-max interpolation." IEEE transactions on signal processing 51.2 (2003): 560-574.
[5] Knoll, Florian, et al. "Second order total generalized variation (TGV) for MRI." Magnetic resonance in medicine 65.2 (2011): 480-491.
[6] Wang, Yi, and Tian Liu. "Quantitative susceptibility mapping (QSM): decoding MRI data for a tissue magnetic biomarker." Magnetic resonance in medicine 73.1 (2015): 82-101.
[7] Oshima, Sonoko, et al. "Brain MRI with quantitative susceptibility mapping: relationship to CT attenuation values." Radiology 294.3 (2020): 600-609.
[8] Murakami, Y., et al. "Usefulness of quantitative susceptibility mapping for the diagnosis of Parkinson disease." American Journal of Neuroradiology 36.6 (2015): 1102-1108.
[9] Treit, Sarah, et al. "R2* and quantitative susceptibility mapping in deep gray matter of 498 healthy controls from 5 to 90 years." Human Brain Mapping 42.14 (2021): 4597-4610.
Figures