1979
Microstructure Imaging of Head and Neck Cancers using an Oscillating Diffusion Gradient Sequence and a Random Walk with Barriers Model1Department of Radiation Oncology, University of Michigan, Ann Arbor, MI, United States, 2Siemens Healthcare GmbH, Erlangen, Germany, 3Department of Otolaryngology, University of Michigan, Ann Arbor, MI, United States, 4Department of Radiology, University of Michigan, Ann Arbor, MI, United States
Synopsis
In vivo microstructure imaging based on diffusion weighted imaging can provide valuable information on tumor characteristics and response to cancer therapy. An oscillating diffusion gradient spin-echo sequence was used to acquire DW images with short diffusion times, along with those acquired by a pulsed diffusion gradient spin-echo sequence. Using a random walk with barriers model, microstructure/diffusion parameters in primary and nodal head and neck tumors were estimated prior to, and after two weeks of cancer treatment. Results show feasibility of this method to detect significant changes in these parameters, across the two imaging time points.
Introduction
In vivo microstructure imaging based upon modeling water diffusion in tissue structures with cell membrane hindrance has the potential for assisting in tumor characterization, grading and assessment of response to cancer therapy. This study reports on image acquisition using an oscillating diffusion gradient spin-echo (OGSE) sequence1 to quantify microstructure parameters using a random walk with barriers model (RWBM) in head and neck cancers (HNC).Methods
Fourteen patients with HNC enrolled on IRB approved protocols had MRI scans prior to chemoradiation therapy (pre-CRT). Six of these subjects had repeated scans after 2 weeks of CRT (2wk).Diffusion Weighted (DW) images were acquired on a 3.0T scanner (Skyra, Siemens) with a prototype sequence at 3 or 4 diffusion times (ts) from 5.3 to 46.6 ms using combined trapezoid sine OGSE with frequencies of 30 to 65 Hz and pulsed gradient spin echo (PGSE). DW images had diffusion weighting in 3 orthogonal directions, b-values from 50-1300 s/mm2, TE/TR = 89/3100 ms, voxel size = 2.34 X 2.34 X 7.5 mm3, and 9 axial slices.
All DW images, after spatial alignment to resolve intra-session motion within each time-point, were low-pass filtered for noise reduction. A mono-exponential diffusion model was then fit to yield apparent diffusion coefficient (ADC) maps at each diffusion time ts.
The RWBM describes water diffusion with permeable cell membranes, which can be used to characterize microstructure and diffusion parameters2. In the RWBM, variations of the time-dependent diffusion coefficients are characterized by short and long-time limits. In the short-time limit (STL), during which water molecules encounter a limited number of cell boundaries during the diffusion (measurement) time, the time-dependent diffusion coefficient is described as2:
$$ D(t) = D_{0}\left[1-\frac{S}{Vd}\left(\frac{4\sqrt{D_{0}t}}{3\sqrt{\pi}}-\kappa t\right)\right] $$ (1)
(D0: unrestricted diffusivity, S/V: surface area to volume ratio of the diffusion restricted structure, d: dimension of the structure, and κ: permeability of the cell membrane). This equation holds for diffusion times ts ≪$$$\tau_{D}$$$, where $$$\tau_{D}$$$ is the time for water molecules to diffuse across the cell volume ($$$\tau_{D}=a^{2}/2D_{0}$$$, $$$a=2dV/S$$$ is an estimate of the cell size). In the long-time limit (LTL) the behavior of the diffusion coefficient is3:
$$D(t) \simeq D_{\infty} + At^{-\nu},t\rightarrow\infty$$
(2)
($$$D_{\infty}$$$: bulk diffusion coefficient, A: associated strength of the structure disorder and ν: parameter related to the global arrangement of the tissue microstructure). The LTL can follow two types of disorders: Hyperuniform Disorder (HD), where structural fluctuations are suppressed and the tail of the cumulative D(t) follows the equation with ν = 1; and Extended Disorder (ED), where randomly located structural walls lead to a slow tail of the signal with ν = 1/2 . If ts is greater than the residence time ($$$\tau_{R}=\frac{V}{\kappa S}$$$), ED is valid, otherwise the time-dependent diffusion follows the trend described by HD.
Validity of the STL (Equation 1) was examined initially using 2-3 ADCs measured at short ts and ignoring the permeability term to estimate $$$\frac{S}{V}$$$ and D0. Then, $$$\tau_{D}$$$ was estimated by fitting all three terms in Equation 1. Similarly, validity of HD or ED of the LTL was examined using estimated $$$\tau_{R}$$$ to select the HD-LTL or ED-LTL. Finally, $$$D_{\infty}$$$ was estimated and κ was recalculated as the LTL $$$ \kappa = \frac{S}{2Vd}\frac{D_{\infty}}{\frac{D_{0}}{D_{\infty}}-1}$$$.
The RWBM was applied to primary and nodal gross tumor volumes (GTVs) contoured by a physician on post-contrast T1W images as well as subvolumes of tumors classified by fuzzy c-means clustering of ADC maps at the shortest diffusion time into groups of high and low ADC values.
Results
Figure 1 shows example DW images and ADC maps at four different diffusion times from 50Hz OGSE, 35Hz OGSE and two PGSE sequences. Figure 2 shows examples of time-dependent ADCs in primary and nodal GTVs from a patient. Our data approximately satisfied the criteria for the first two terms of the STL and the HD-LTL. Estimated values of V/S, D0 , $$$D_{\infty}$$$ and κ of primary and nodal GTVs of all patients are summarized in Figure 3. Changes in the parameters after 2 weeks of treatment are presented in Figure 4. Note that $$$D_{\infty}$$$, the bulk diffusion coefficient, is approximately 3 times smaller than D0, the free diffusion coefficient, due to diffusion restriction imposed by tissue microstructure. Compared to the high ADC regions at the shortest diffusion time, the low ADC regions had low D0, high V/S and κ, and similar $$$D_{\infty}$$$. Compared to pre-CRT,$$$D_{\infty}$$$ , V/S and κ showed considerable increases with the most significant increase in $$$D_{\infty}$$$ within primary tumors (p< 0.04) after 2-weeks of CRT. D0 changed little at 2wk of CRT compared to before treatment (p > 0.4).Discussion and Conclusion
It is feasible to use the OGSE sequence to acquire DW images at short diffusion times on a clinical scanner and quantify microstructure parameters using the RWBM in the patients with HNC. Further optimization of acquisition and pathological validation of the estimated parameters are on-going.Acknowledgements
The authors would like to thank Siemens Healthineers for providing the prototype MRI sequence used in this studyReferences
1. Does DD, Parsons EC, Gore J: “Oscillating Gradient Measurements of Water Diffusion in Normal and Globally Ischemic Rat Brain” 2003, Magn. Reson. Med. 49:206
2. Novikov DS, Fieremans E, Jensen JH, Helpern JA. “Random walk with barriers”, Nat Phys. 2011 Jun 1;7(6):508-514
3. Lemberskiy G, Fieremans E, Veraart J, Deng F, Rosenkrantz AB, Novikov DS, “Characterization of Prostate Microstructure Using Water Diffusion and NMR Relaxation”, Front. Phys. 2018, 25(6): 91
Figures
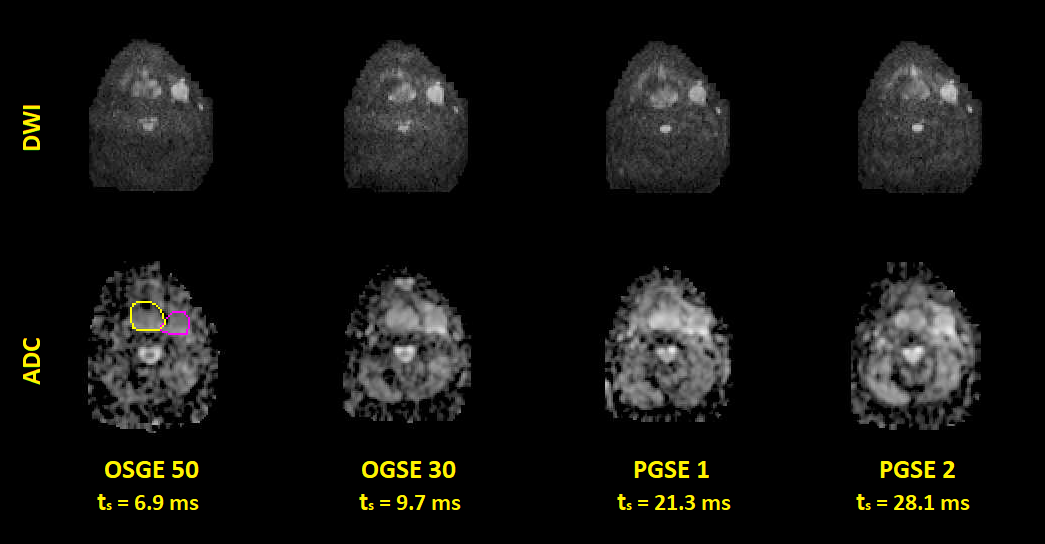
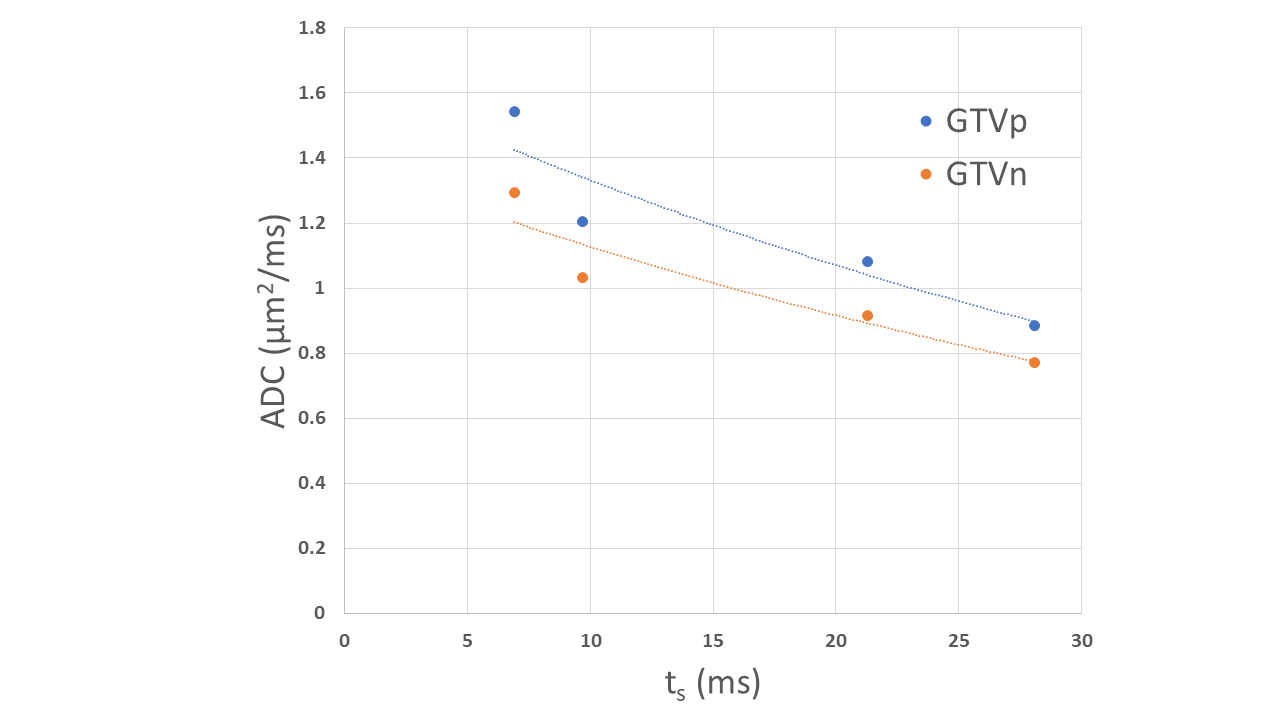
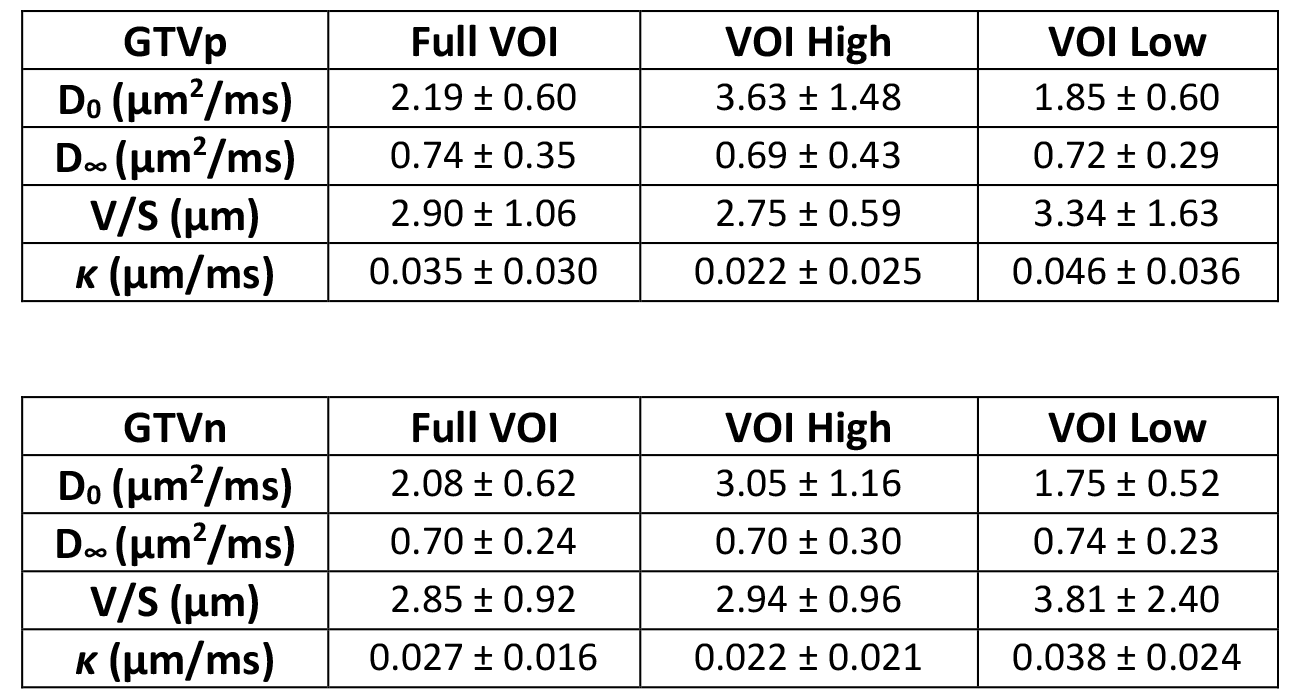
Figure 3. Mean and standard deviation of estimated parameters (V/S, D0, Dinf and κ) in the primary and lymph nodal GTVs across all 14 patients as well as in the subvolumes of GTVs with high and low ADC values at the shortest diffusion time.
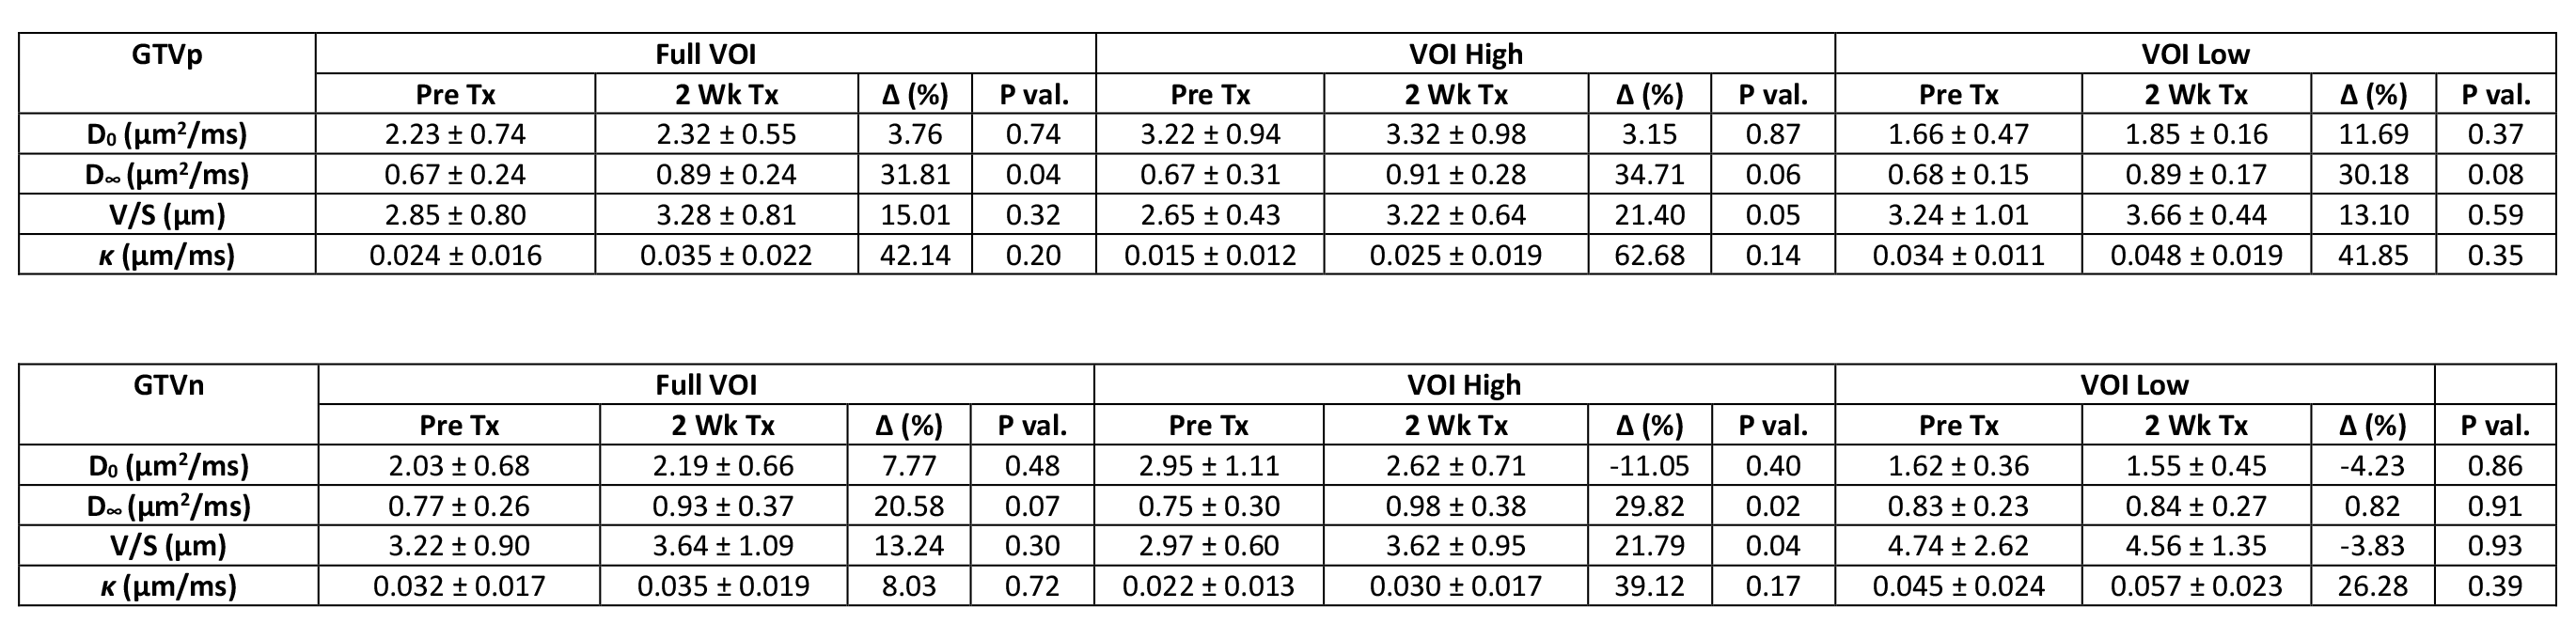
Figure 4. Mean and standard deviation of estimated parameters (V/S, D0, Dinf and κ) in the primary and lymph nodal GTVs of 6 patients pre-CRT and after starting 2 weeks of CRT, as well as in the subvolumes of GTVs with high and low ADC values at the shortest diffusion time.