1978
Advanced diffusion-weighted MRI and proteomic analysis as potential predictors of renal tumor histopathology1Department of Radiology, Icahn School of Medicine at Mount Sinai, New York, NY, United States, 2BioMedical Engineering and Imaging Institute, Icahn School of Medicine at Mount Sinai, New York, NY, United States, 3Department of Urology, Icahn School of Medicine at Mount Sinai, New York, NY, United States, 4Division of Oncological Sciences, Icahn School of Medicine at Mount Sinai, New York, NY, United States
Synopsis
In this prospective, single-center study, we evaluated the use of intravoxel incoherent motion model of diffusion (IVIM-DWI) and high-throughput urine proteomics associated with inflammation for diagnosis and characterization of small renal masses. IVIM-DWI parameters had good to excellent diagnostic performance in identifying clear-cell renal cell carcinomas (ccRCC), as well as in distinguishing between stages of ccRCC. In a subset of patients with IVIM-DWI and proteomics, we observed significant correlations between IVIM and proteomic analytes which had differential expression between ccRCC and non-ccRCC, and are involved in promoting the recruitment, expansion and activation of innate and adaptive immune cells.
Introduction
Partial nephrectomy (PN) has been the treatment of choice for patients with small renal masses (SRMs) in the past 15 years1, 2. Due to heterogeneity of renal masses, and to limited diagnostic accuracy of biopsies, pre-operative distinction of benign lesions from renal cell carcinoma (RCC), and particularly from clear cell (cc)RCC, the subtype with the greatest risk of recurrence and poorest survival1, 2, is an unmet need. Attempts have been made to find serum3, urine and imaging biomarkers that allow the detection of cases that may not benefit from PN or where the risks of this procedure outweigh the benefits and to profile the tumor microenvironment without pre-operative tumor sampling. Advanced diffusion-weighted MRI such as intravoxel incoherent motion model of diffusion (IVIM-DWI) can address the microstructural complexity of SRM by characterizing tissue cellularity separately from capillary perfusion. The purpose of our study was to establish feasibility of a novel approach composed of IVIM-DWI and high throughput urine proteome analysis from patients with SRM for histologic classification and characterization.Methods
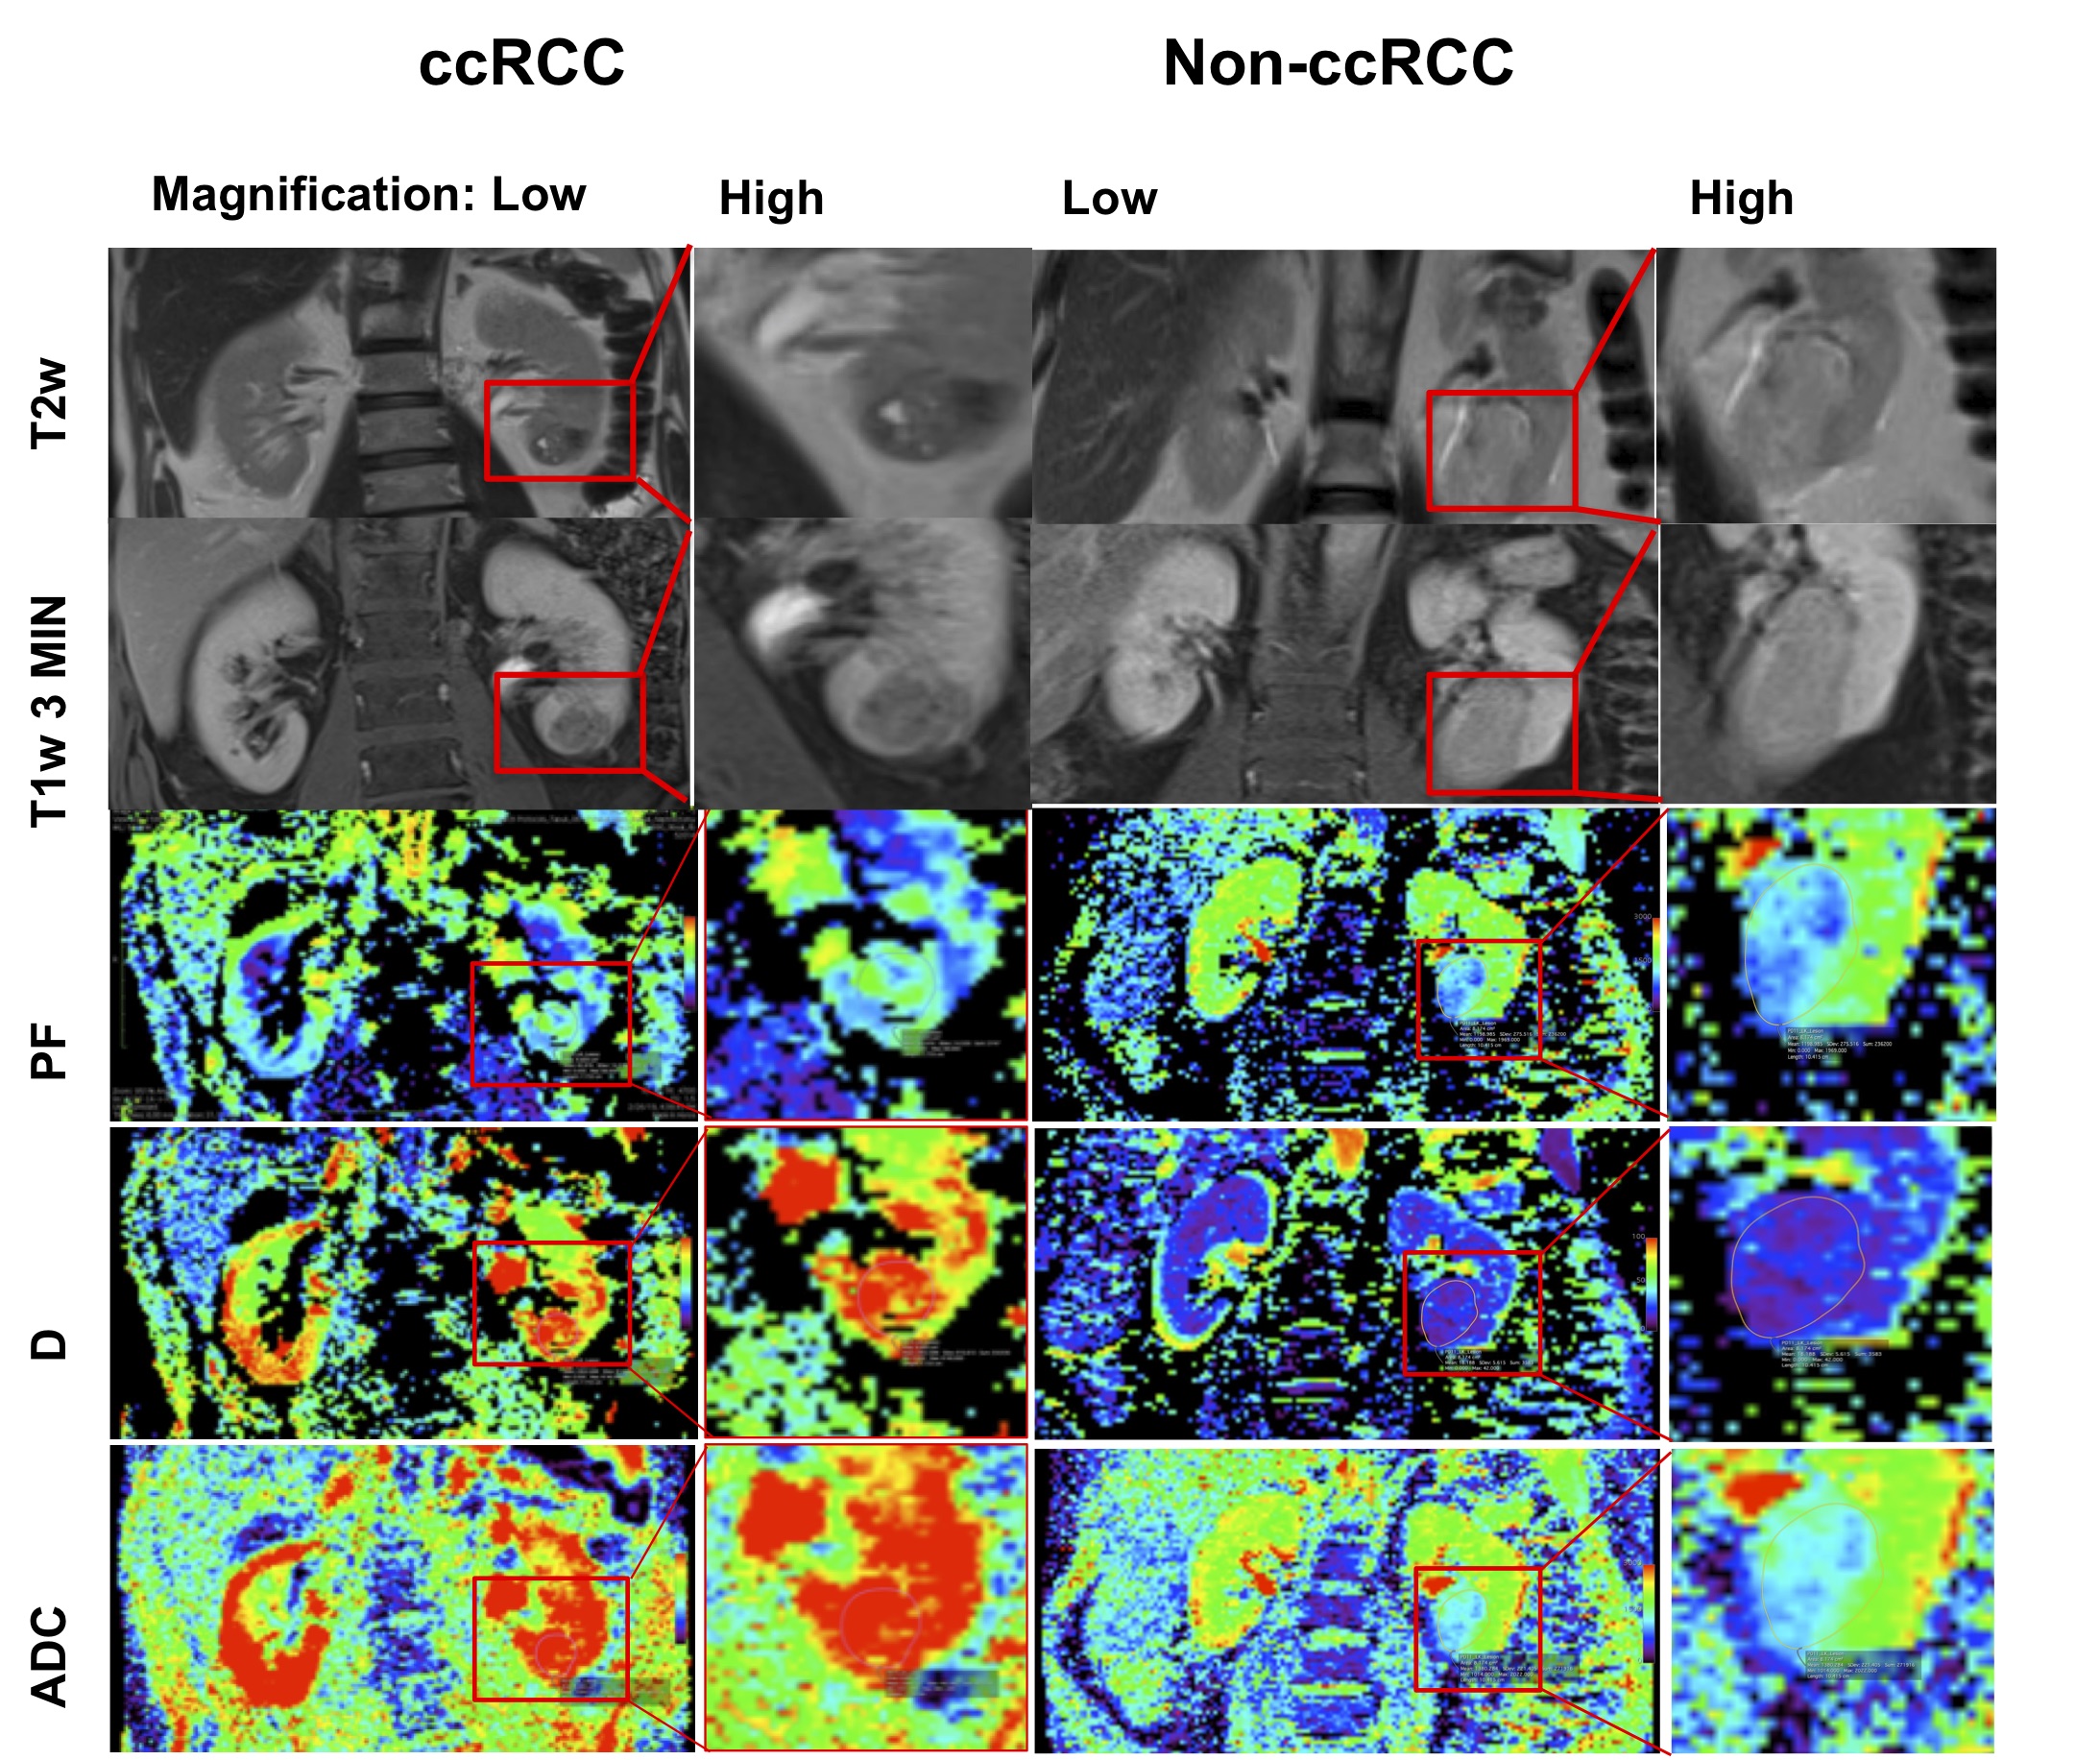
Thirty prospectively enrolled patients (M/F: 22/8, 60±11.3 years) with SRMs scheduled to undergo robotic PN between 10/2018-06/2021 underwent advanced IVIM-DWI MRI at 1.5T (Aera, Siemens Healthcare). All patients underwent a multiparametric MRI protocol, including IVIM-DWI acquisition (2D SS EPI, TR/TE: 4700/81 ms, FOV=400 x 375 mm, 20 slices, slice thickness 6 mm, matrix 192x154) with 9 b-values (0,10,30,50,80,120,200,400,800 s/mm2)4. A radiologist with 10 years of experience identified the SRMs and traced ROIs covering all visible slices of the tumor on DWI in Horos (Horos Project). IVIM parameters (true diffusion D, pseudo-diffusion Ds, and perfusion fraction PF)4 were calculated using a biexponential Bayesian fit for each pixel comprised in the tumor ROIs, and ADC was calculated using a monoexponential fit over all b-values>100 s/mm2. An R-square statistic >0.7 was considered the goodness of fit threshold for inclusion of the parametric data generated by each tumor pixel. A subset of 10 patients (M/F: 5/5, 58±12 years) also underwent a high throughput analysis of urine using a panel of 92 inflammation-related markers from Olink proteomics3. Urine samples were collected on the day of PN. Clinical histopathology of the resected renal masses identified tumor type, tumor, node, metastasis (TNM) stage and World Health Organization (WHO) grade. Examples of patients with clear-cell renal carcinoma (ccRCC) are shown in Figure 1. Mann-Whitney U test and ROC analysis were used for distinction of ccRCC versus other SRM and for tumor stage. Spearman correlation was used to correlate IVIM parameters with ccRCC WHO grade. In our preliminary analysis, we correlated IVIM-DWI parameters with proteomic markers by false-discovery-rate-adjusted correlations.Results
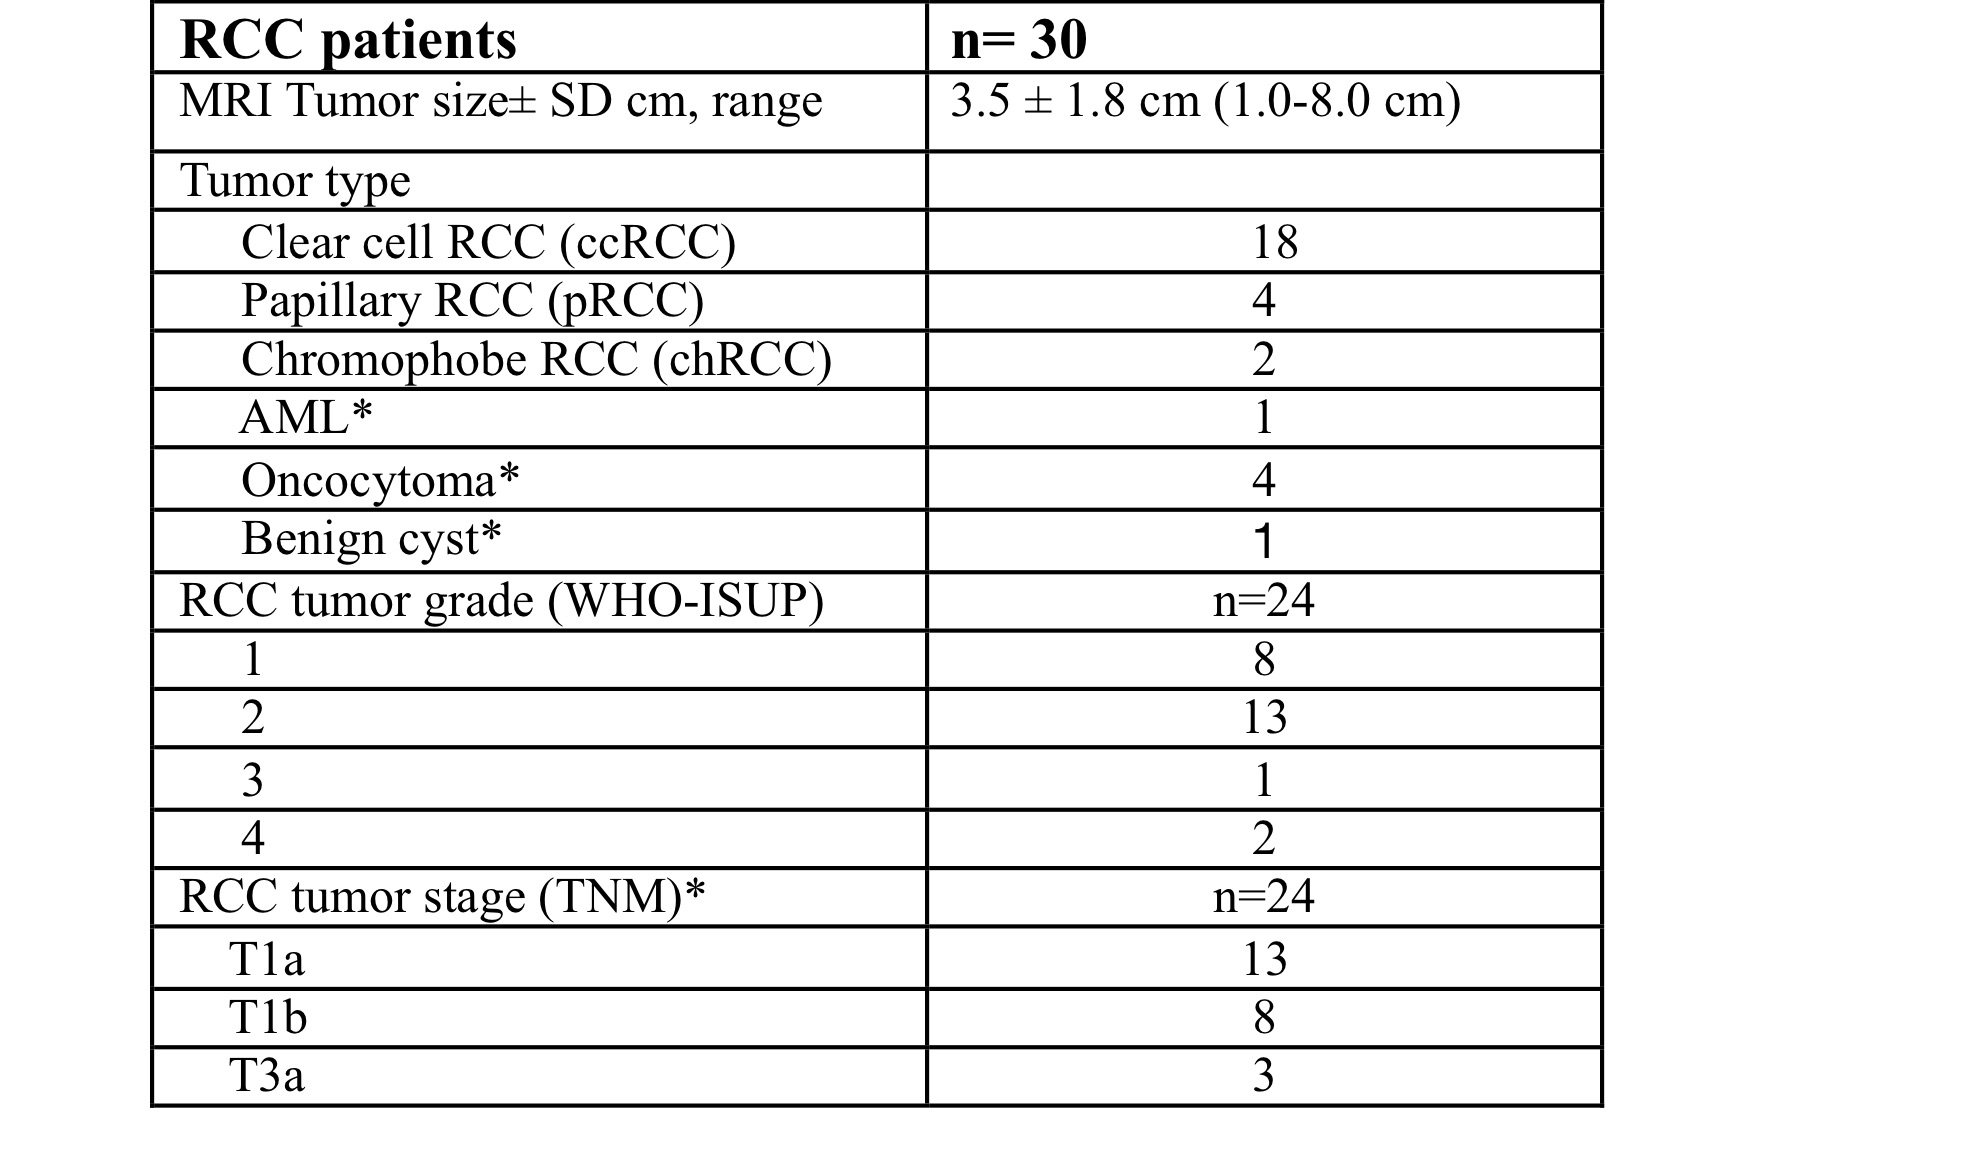
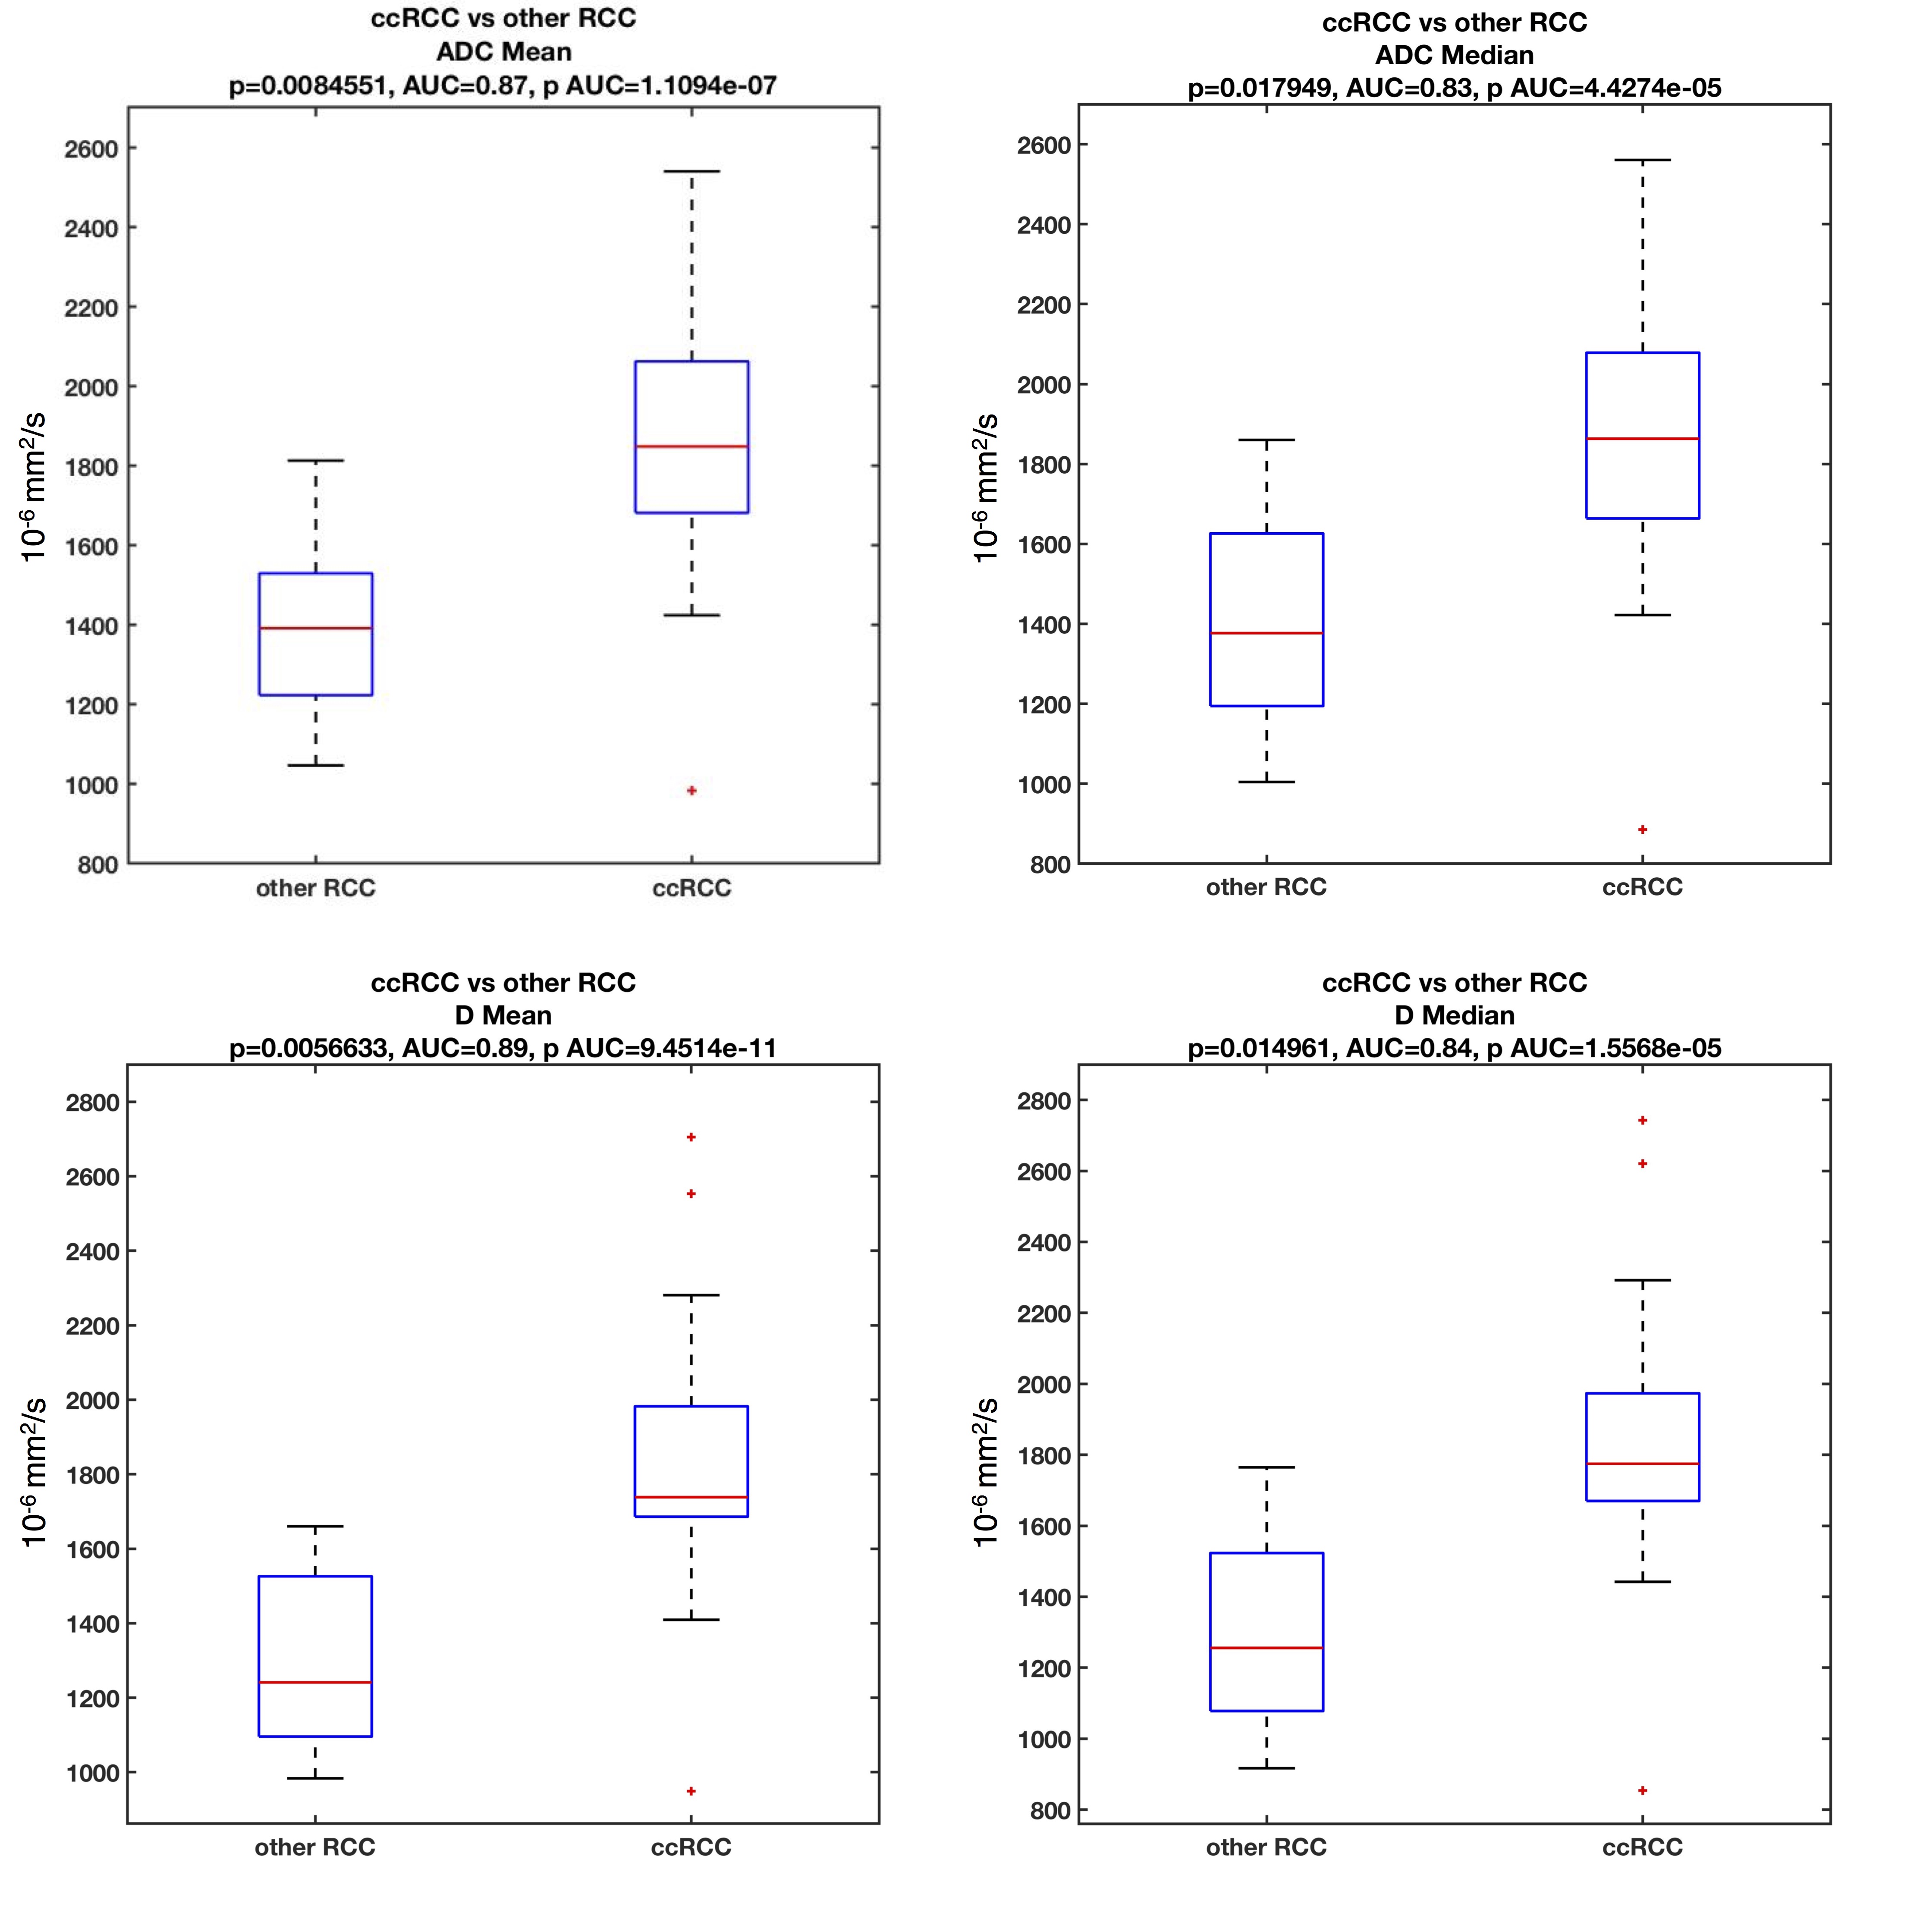
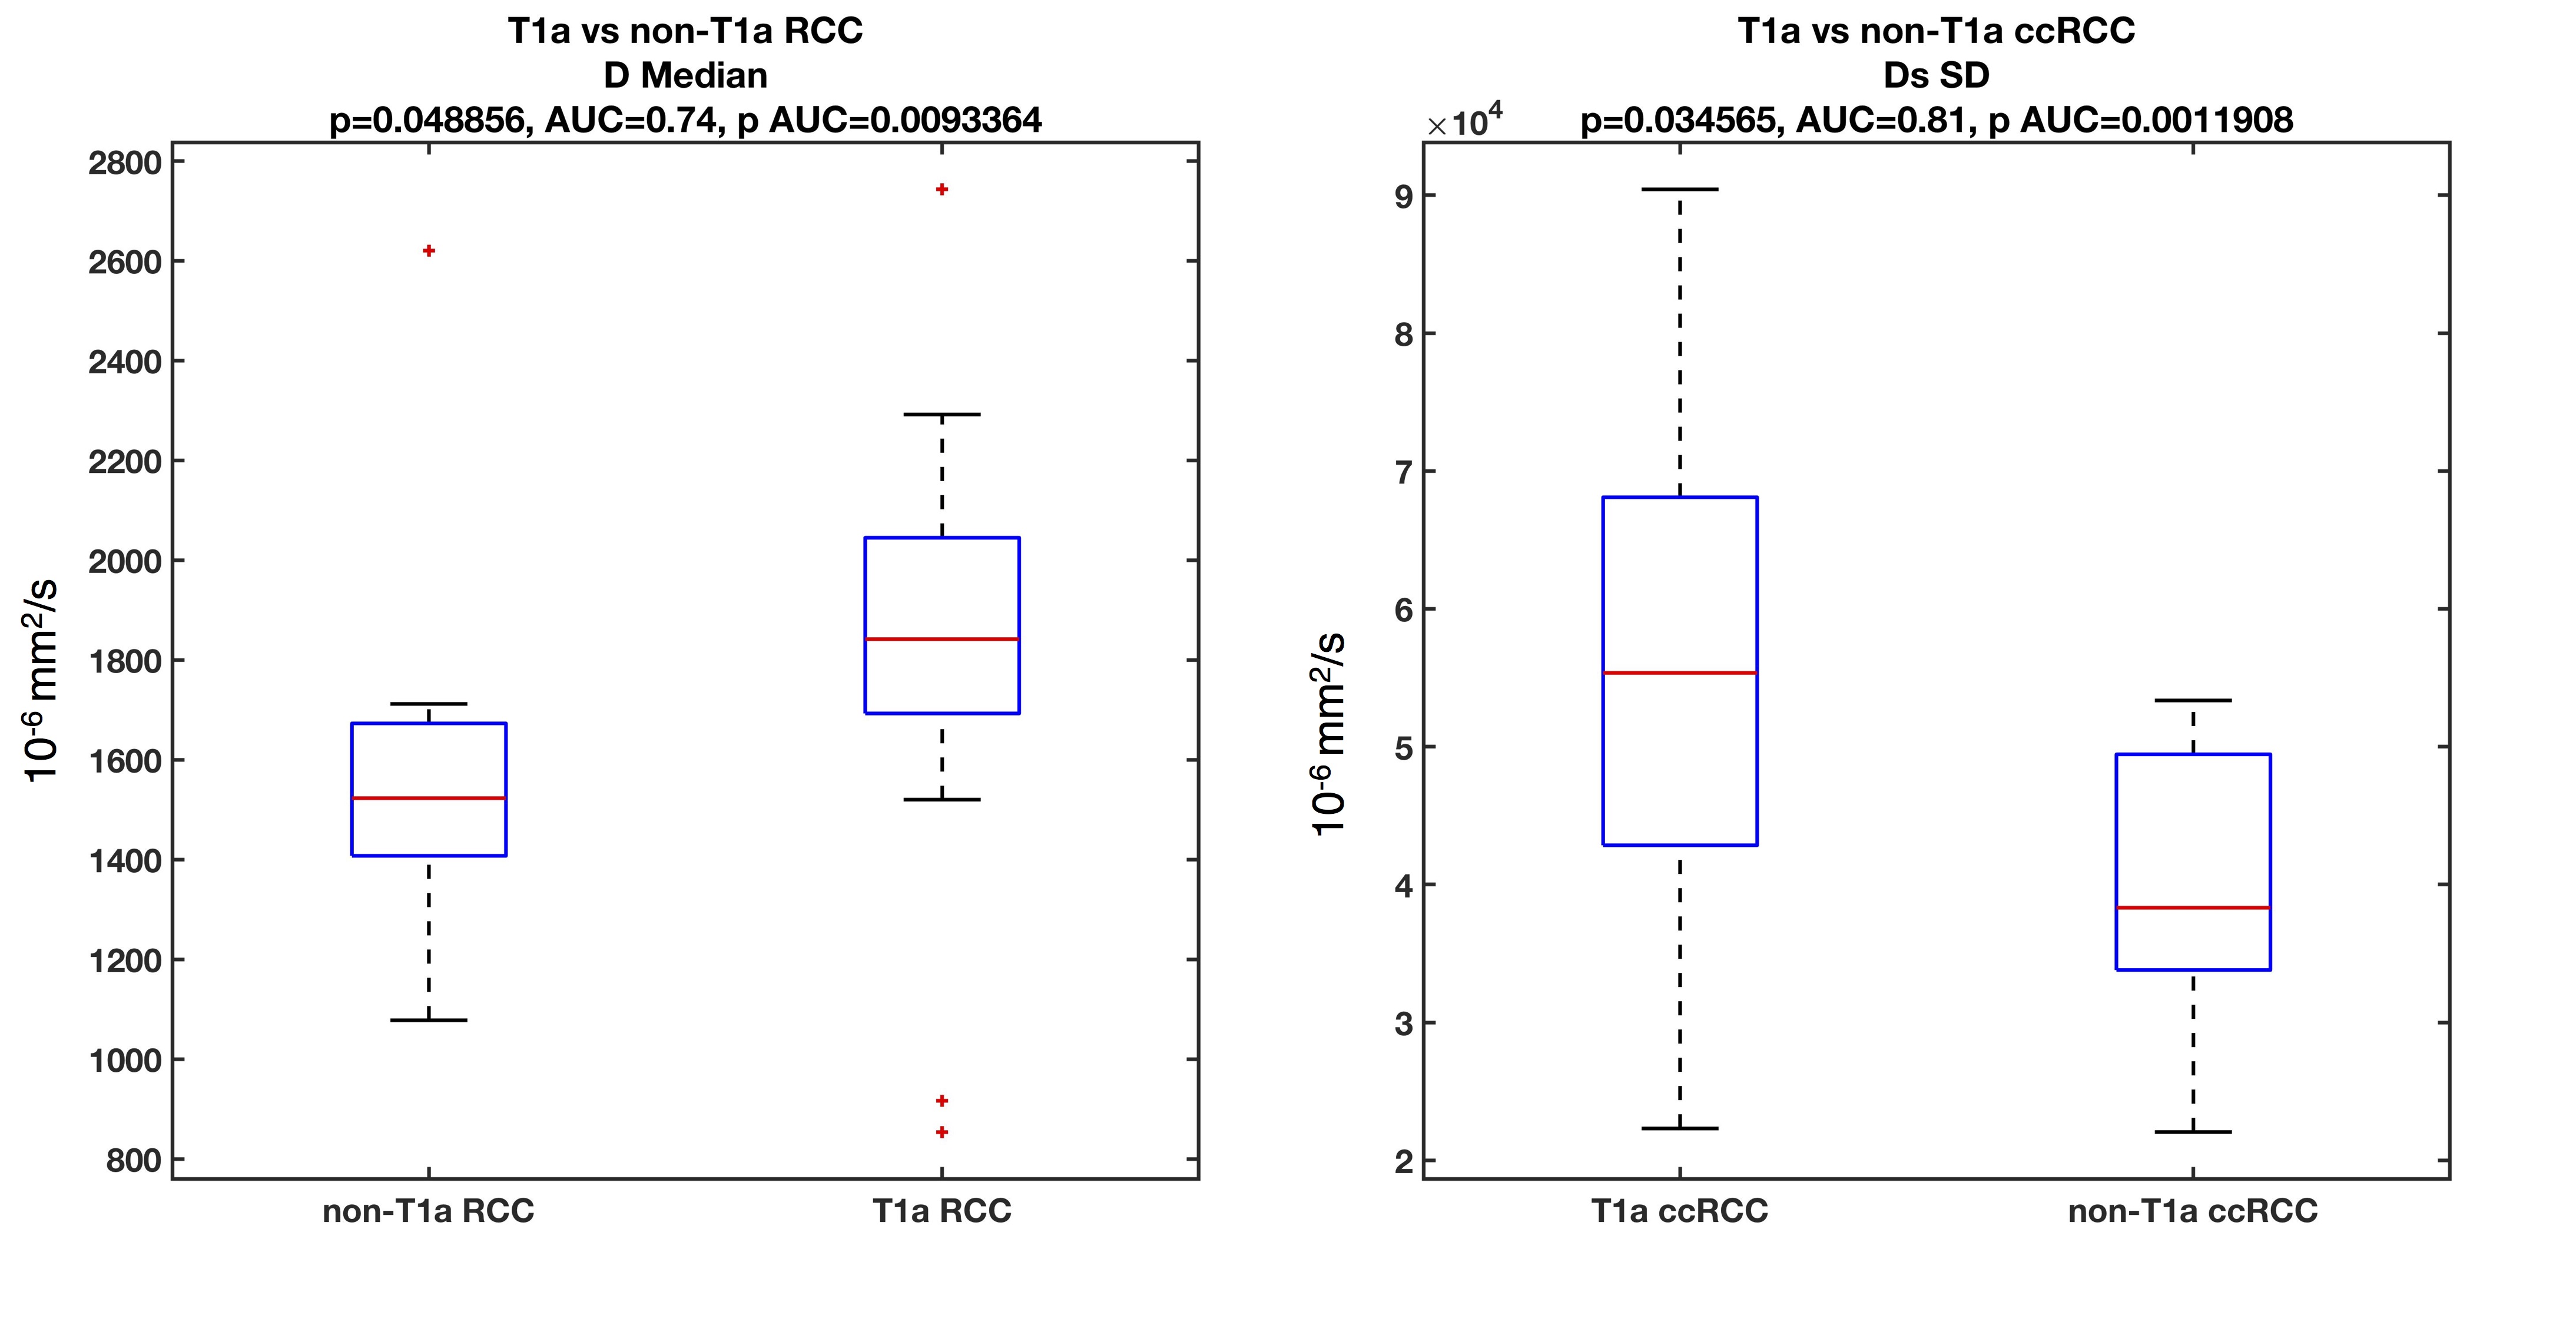
We examined 30 lesions (Table 1: 18 ccRCC, 6 non-ccRCC, and 6 benign) in 30 patients. Over half RCCs (13/24) were stage T1a (tumor restricted to the kidney, <4 cm in largest diameter), and had WHO grade 2 (n=13/24). In the subset of patients with proteomics and DWI, pathology of SRMs revealed 7 ccRCC, 1 non-ccRCCs (chromophobe RCC), and 2 benign masses (oncocytoma and angiomyolipoma). Mean (p=0.008) and median (p=0.018) ADC, and mean (p=0.006) and median (p=0.015) D were significantly elevated in ccRCC vs. other RCC subtypes (Figure 2), and distinguished ccRCCs from other RCCs with good diagnostic performance (AUC>0.8). Mean D was also significantly elevated in T1a RCC (p=0.048), while the standard deviation of the pseudo-diffusion parameter Ds was significantly elevated in T1a ccRCCs vs. other stages of T1a RCC (Figure 3). No IVIM-DWI parameters were correlated with tumor grade (p>0.075). Protein expression clustering analysis of the markers with significant differential expression across the groups showed a predominant upregulation of the urine inflammation markers in ccRCC cases (p<0.045), and downregulation of the serum and urine analytes in benign cases (p<0.045). Compared to ccRCC, non-ccRCC show upregulation of serum inflammatory markers, and downregulation of urine markers (p<0.045). We observed strong false-discovery-rate-adjusted correlations (Figure 4) between the urine inflammatory protein EN-RAGE and mean ADC (r=0.9, p=0.0003), mean PF (r=0.79, p=0.0003), and D (r=0.9 p=0.003), and the chemokine CCL23 and PF (r=0.63, p=0.048).Discussion
The role of inflammatory biomarkers in genitourinary cancers is currently under active investigation. We observed significant differences in IVIM parameters between ccRCC and non-ccRCC tumors, confirming previous published work that showed good diagnostic performance of IVIM parameters for identifying RCCs and ccRCCs5-7. In addition, we observed significant correlations between IVIM and proteomic analytes with differential expression between ccRCC and non-ccRCC. Previous studies have shown that EN-RAGE and CCL23 are involved in promoting the recruitment, expansion and activation of innate and adaptive immune cells. Up-regulation of EN-RAGE in ccRCC has been previously associated with poorer overall survival8, while up-regulation of CCL23, a chemokine with highly chemotactic activity for resting T-cells and monocytes, has been associated with development of malignancy9.Conclusion
SRMs may produce a local inflammatory response in the kidney that is reflected in changes in expression of inflammatory proteins in the urine. IVIM parameters were found to correlate with urine protein expression, which suggests that a combined non-invasive approach of imaging and proteomics would be beneficial in stratifying patients with renal masses for treatment. Validation of this approach is needed in a larger number of cases.Acknowledgements
This study received research funding from Bayer Investigator Initiated Study IIR-US-2018-5862 grant (PI: SL) and from the Department of Radiology at the Icahn School of Medicine at Mount Sinai (PI: SL).References
1. Ljungberg B, Albiges L, Abu-Ghanem Y, et al. European Association of Urology Guidelines on Renal Cell Carcinoma: The 2019 Update. (1873-7560 (Electronic))
2. Siegel RA-O, Miller KA-O, Fuchs HE, Jemal A. Cancer Statistics, 2021. (1542-4863 (Electronic))
3. Zhong W, Edfors F, Gummesson A, Bergström G, Fagerberg L, Uhlén M. Next generation plasma proteome profiling to monitor health and disease. Nature Communications. 2021/05/03 2021;12(1):2493. doi:10.1038/s41467-021-22767-z
4. Bane O, Hectors SJ, Gordic S, et al. Multiparametric magnetic resonance imaging shows promising results to assess renal transplant dysfunction with fibrosis. Kidney international. Feb 2020;97(2):414-420. doi:10.1016/j.kint.2019.09.030
5. Ding Y, Tan Q, Mao W, et al. Differentiating between malignant and benign renal tumors: do IVIM and diffusion kurtosis imaging perform better than DWI? European radiology. Dec 2019;29(12):6930-6939. doi:10.1007/s00330-019-06240-6
6. Ding Y, Zeng M, Rao S, Chen C, Fu C, Zhou J. Comparison of Biexponential and Monoexponential Model of Diffusion-Weighted Imaging for Distinguishing between Common Renal Cell Carcinoma and Fat Poor Angiomyolipoma. Korean journal of radiology. Nov-Dec 2016;17(6):853-863. doi:10.3348/kjr.2016.17.6.853
7. Rheinheimer S, Stieltjes B, Schneider F, et al. Investigation of renal lesions by diffusion-weighted magnetic resonance imaging applying intravoxel incoherent motion-derived parameters--initial experience. European journal of radiology. Mar 2012;81(3):e310-6. doi:10.1016/j.ejrad.2011.10.016
8. Eckel-Passow JE, Serie DJ, Bot BM, et al. Somatic expression of ENRAGE is associated with obesity status among patients with clear cell renal cell carcinoma. Carcinogenesis. Apr 2014;35(4):822-7. doi:10.1093/carcin/bgt485
9. Aversa J, Song M, Shimazu T, et al. Prediagnostic circulating inflammation biomarkers and esophageal squamous cell carcinoma: A case-cohort study in Japan. International journal of cancer. Aug 1 2020;147(3):686-691. doi:10.1002/ijc.32763
Figures