1977
Use of MRI- and microscopy-compatible bioreactor for validation of qMRI diffusion measurements via fluorescence microscopy
Megan F LaMonica1, Megan E Poorman2, David A Hormuth, II1, Thomas E Yankeelov1, and Kathryn E Keenan2
1Biomedical Engineering, UT Austin, Austin, TX, United States, 2NIST, Boulder, CO, United States
1Biomedical Engineering, UT Austin, Austin, TX, United States, 2NIST, Boulder, CO, United States
Synopsis
Quantitative magnetic resonance imaging (qMRI) could complement qualitative MRI analysis by providing quantitative diagnostic information standardized across patients. However, it is difficult to determine how microscopic tissue properties affect MR signal. A microscopy- and MRI-compatible bioreactor was filled with different concentrations of fluorescent beads in gel to explore this relationship. Higher bead count was associated with lower ADC. A 59% ADC decrease was observed at 100 beads/mm3 when varying gradient pulse separation from 16 to 20 ms, illustrating sensitivity to different length scales per the Einstein-Smoluchowski relationship. This work is a step towards validating qMRI with fluorescence microscopy.
Introduction
Quantitative magnetic resonance imaging (qMRI) has the potential to allow clinicians to make diagnoses based on quantitative, standardized MR data as a complement to qualitative information. Part of developing and standardizing qMRI is determining how the MR signal is affected by the underlying tissue properties. For example, cell size may change during disease or after therapy, and diffusion imaging can be designed to capture these changes.1,2 The goal of this project is to use a microscopy- and MR-compatible bioreactor to map changes observable at the microscopic scale to changes observable in macroscopic MR images.3Methods
To study this problem, a MR-compatible bioreactor3 was imaged using microscopy and MRI (Figure 1). The bioreactor was loaded with two concentrations of 10 μm diameter fluorescent beads (100 and 500 beads/mm3) mixed in agar gel.3,4 The bioreactor and its contents were imaged via optical fluorescence microscopy and MRI for each concentration. Diffusion-weighted spin-echo MR scans were used to generate ADC maps (Figure 2). Structural MR images were used to manually determine a central region of interest (ROI) of 5x5 MR pixels for each experimental group. The average ADC value in each ROI was found. Then, the corresponding microscopy images were manually registered against the MR ROI images and the microscopy ROI section was isolated for masking and bead counting in ImageJ.5 The general signal equation used to generate ADC maps is: $$S = S_0e^{-b*ADC}$$ Where S0 is the baseline MR signal, b is the b value, and ADC is the apparent diffusion coefficient for a given MR voxel.6 The b value is defined as follows: $$b = γ^2*G^2*δ^2*(Δ−δ/3)$$ Where γ is the gyromagnetic ratio, G is the gradient pulse magnitude, δ is the gradient pulse duration, and Δ is the time interval between pulses.6 If we vary Δ and keep the other parameters constant, our resulting measurements are sensitive to average molecular displacements defined by the Einstein-Smoluchowski relationship:7 $$<r^2> =6*ADC*Δ$$ Where <r> is the average molecular displacement. Two different diffusion experiments were performed by varying Δ such that r = 13.9μm (Δ=16 ms) and r = 15.5 μm (Δ=20 ms).Results & Discussion
Figure 3 shows the types of images collected and analyzed for this project. As seen in the ADC map column for the Δ=16 ms experiment (Figure 3), ADC decreases as bead concentration increases. We observed decreased ADC in the center of the bioreactor in the Δ=20 ms experiment (2h and 2i) compared to the Δ=16 ms experiment (2e and 2f).This could be due to the high concentration of fluorescent beads hindering the diffusion of water through much of the bioreactor at the diffusion length scale reached during the Δ=20 ms experiment.Figure 4 shows a plot of MRI ADC value versus microscopy bead count. At a concentration of 100 beads/mm3 and a gradient pulse duration of 16 ms, diffusion of water in the bioreactor appears quite similar to that of the control group, with an average ADC of 1.9 x 10⁻³ mm2/s, suggesting that water is not impeded by beads at that length scale and bead concentration. However, that same bead concentration with a 20 ms gradient pulse duration shows a 59% decrease in ADC from 1.9 x 10⁻³ mm2/s to 1.13 x 10⁻³ mm2/s. The four additional milliseconds of gradient pulse separation allows diffusion to be characterized on a longer length scale, which manifests as restricted diffusion due to the opportunity for water to encounter more beads. This corresponds with the increase in r from 13.9 μm (Δ= 16 ms) to 15.5 μm (Δ= 20 ms). We note a large standard deviation, particularly in the ADC value obtained with Δ= 20 ms, which could be due to a lower signal-to-noise ratio (SNR) for that experimental group. SNR in b=0 images was 11.82, 8.06, and 3.83 for control, 100 beads/mm3, and 500 beads/mm3 respectively.
Conclusion
Preliminary results suggest that differences in bead count quantified via optical microscopy images are associated with measurable differences in qMRI ADC values, offering an early proof of concept for connecting microscopy and MR data across spatial scales. Differences in gradient pulse duration were shown to cause measurable differences in the apparent diffusion of water around beads of a known concentration. The shifts in ADC value dependent upon bead concentration parallel differences seen between ADC values of different cell and tissue types.2 While fluorescent beads were used in this particular project, the beads serve as a proxy for cells. Living cells could be used in future experiments once the bioreactor fabrication process and experimental setup are optimized to support them. Future work could include 3D automated registration of microscopy data to MR data rather than relying on manual registration. Additionally, T1 and T2 relaxation times could be measured and included in this analysis to explore an association between those qMR parameters and microscopy data.Acknowledgements
This project was funded by the Ruth L. Kirschstein National Research Service Award (NRSA) training grant from the National Institute of Biomedical Imaging and Bioengineering (NIBIB) within the National Institutes of Health (NIH).References
1. Xu J, Jiang X, Li H, et al. Magnetic resonance imaging of mean cell size in human breast tumors. Magn Reson Med. 2020;83(6):2002-2014. doi:10.1002/mrm.280562. Xu J, Xie J, Jourquin J, et al. The Influence of Cell Cycle Phase on ADC in Synchronized Cells Detected Using Temporal Diffusion Spectroscopy. Magn Reson Med Off J Soc Magn Reson Med Soc Magn Reson Med. 2011;65(4):920-926. doi:10.1002/mrm.22704
3. Megan Poorman, Slavka Carnicka, Jeanne E BarthoId, et al. MR imaging of a 3D-printed bioreactor with a dedicated radiofrequency coil for cellular level validation of quantitative MR metrics. ISMRM 2018
4. Fluoresbrite® YG Microspheres 10.0µm. Accessed November 8, 2021. https://www.polysciences.com/default/fluoresbrite-yg-microspheres-100m-43708
5. Schneider CA, Rasband WS, Eliceiri KW. NIH Image to ImageJ: 25 years of image analysis. Nat Methods. 2012;9(7):671-675. doi:10.1038/nmeth.2089
6. b-value diffusion. Questions and Answers in MRI. Accessed November 8, 2021. http://mriquestions.com/what-is-the-b-value.html
7. Morozov S, Sergunova K, Petraikin A, et al. Diffusion processes modeling in magnetic resonance imaging. Insights Imaging. 2020;11(1):60. doi:10.1186/s13244-020-00863-w
Figures
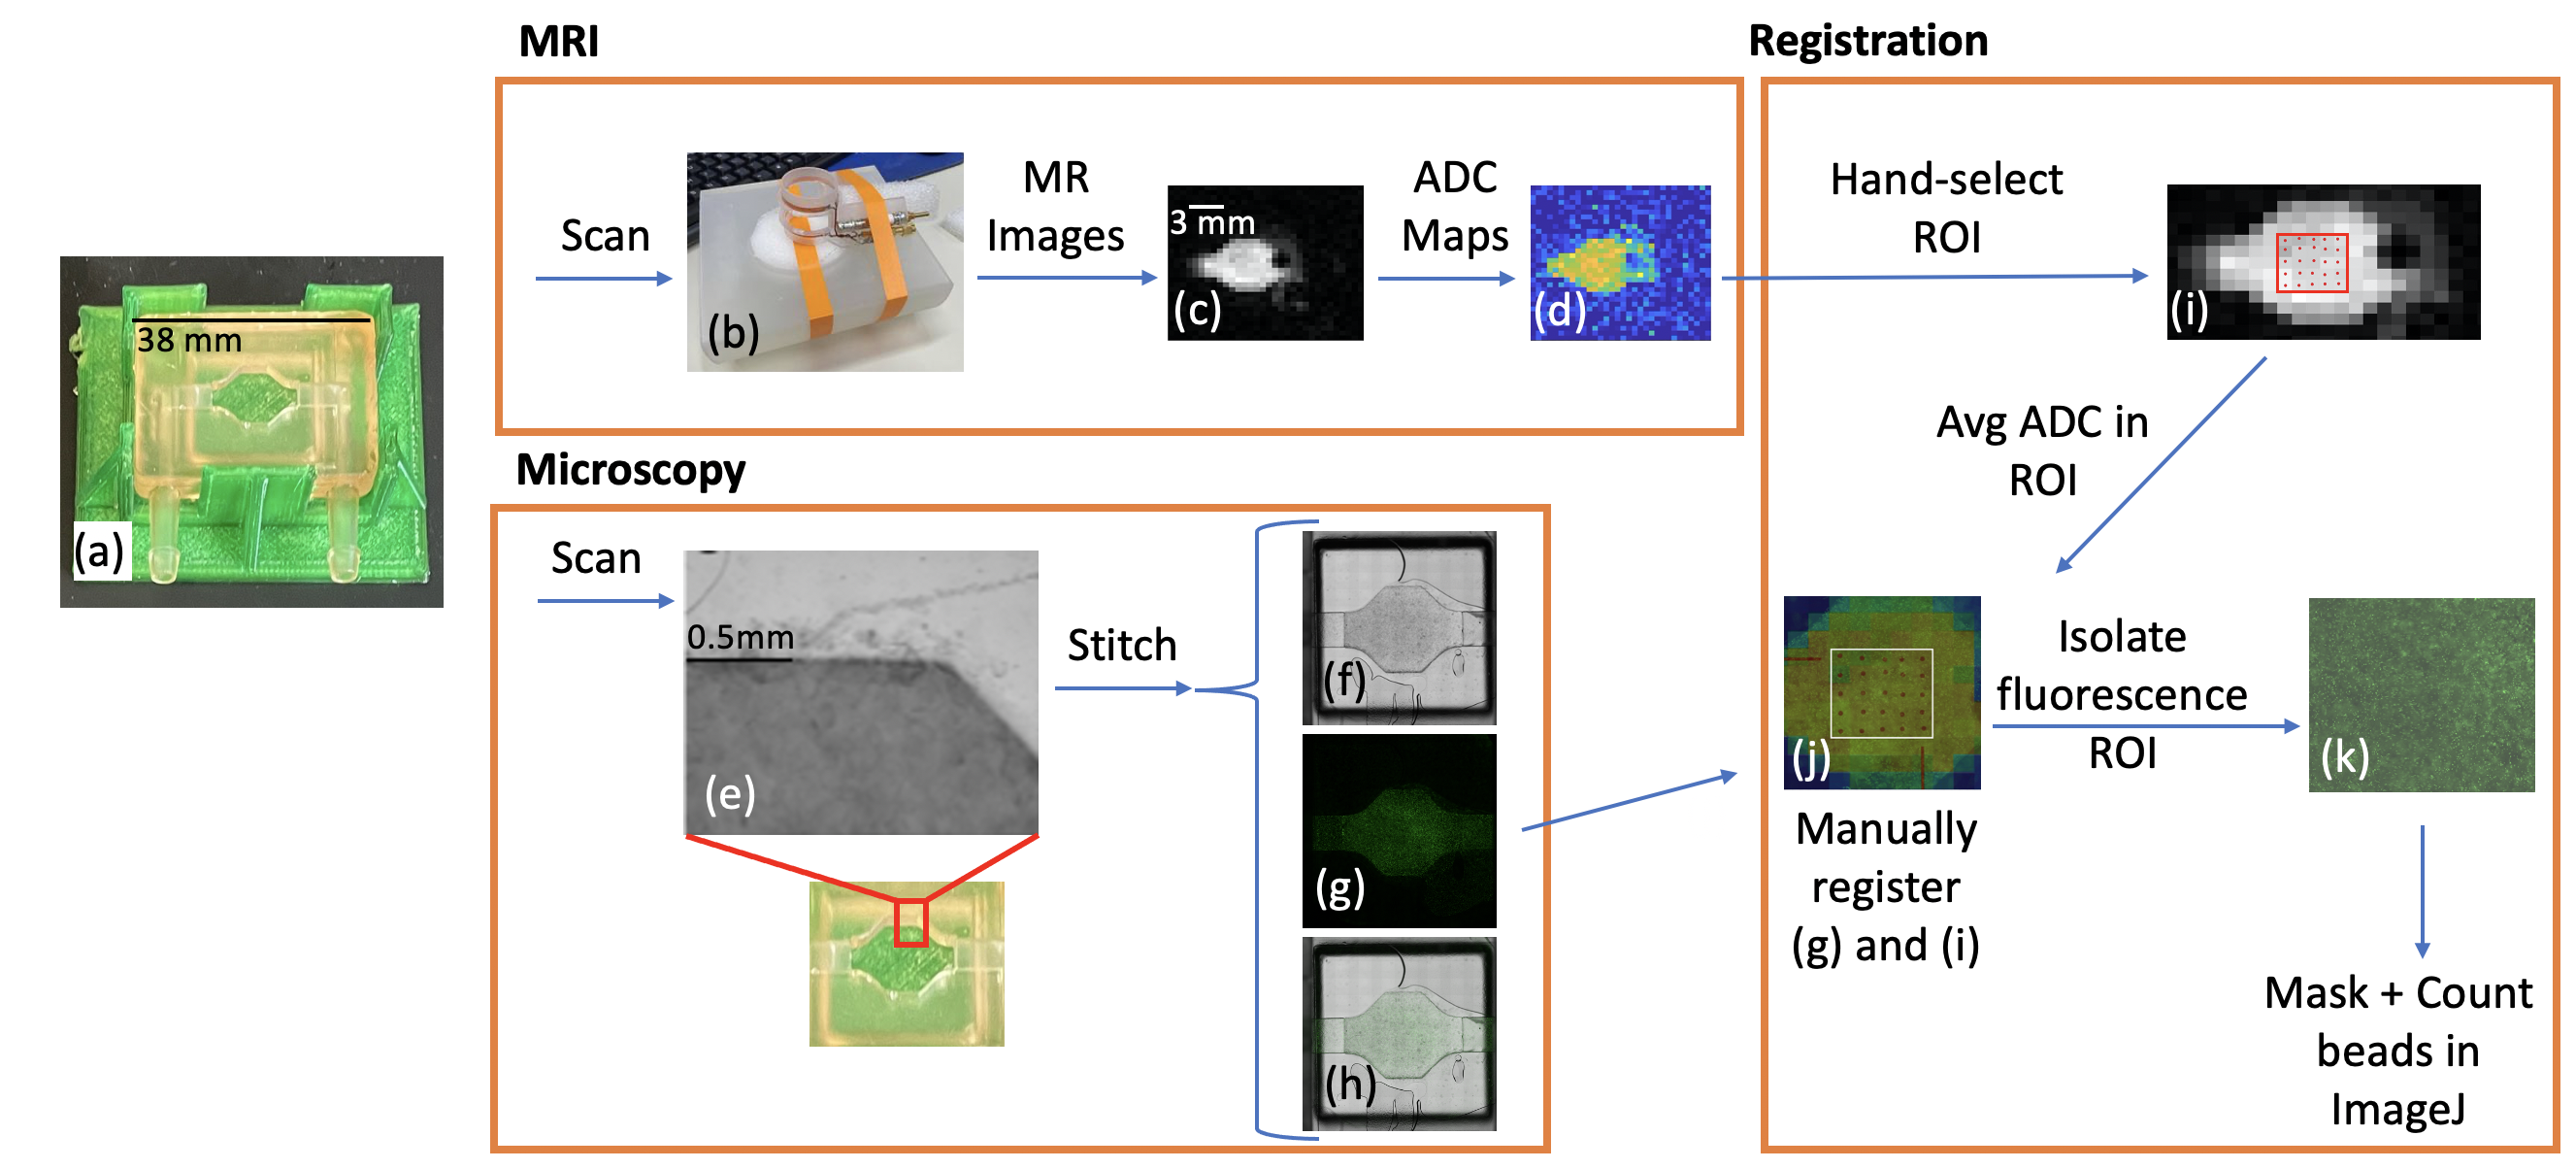
Figure 1: Experimental pipeline. MRI: (a) Assemble bioreactor. (b) Use dedicated coil to scan bioreactor in MR scanner. (c) Acquire MR scans. (d) Obtain qMRI data. Microscopy: (e) Obtain sectional bioreactor images. Stitch together to form complete image in brightfield (f), fluorescent (g), & combined (h) channels. Registration: (i) Hand-select ROI for registration, find average ADC in ROI. (j) Manually register ADC map & fluorescence image. (k) Isolate fluorescence ROI for bead counting in ImageJ.
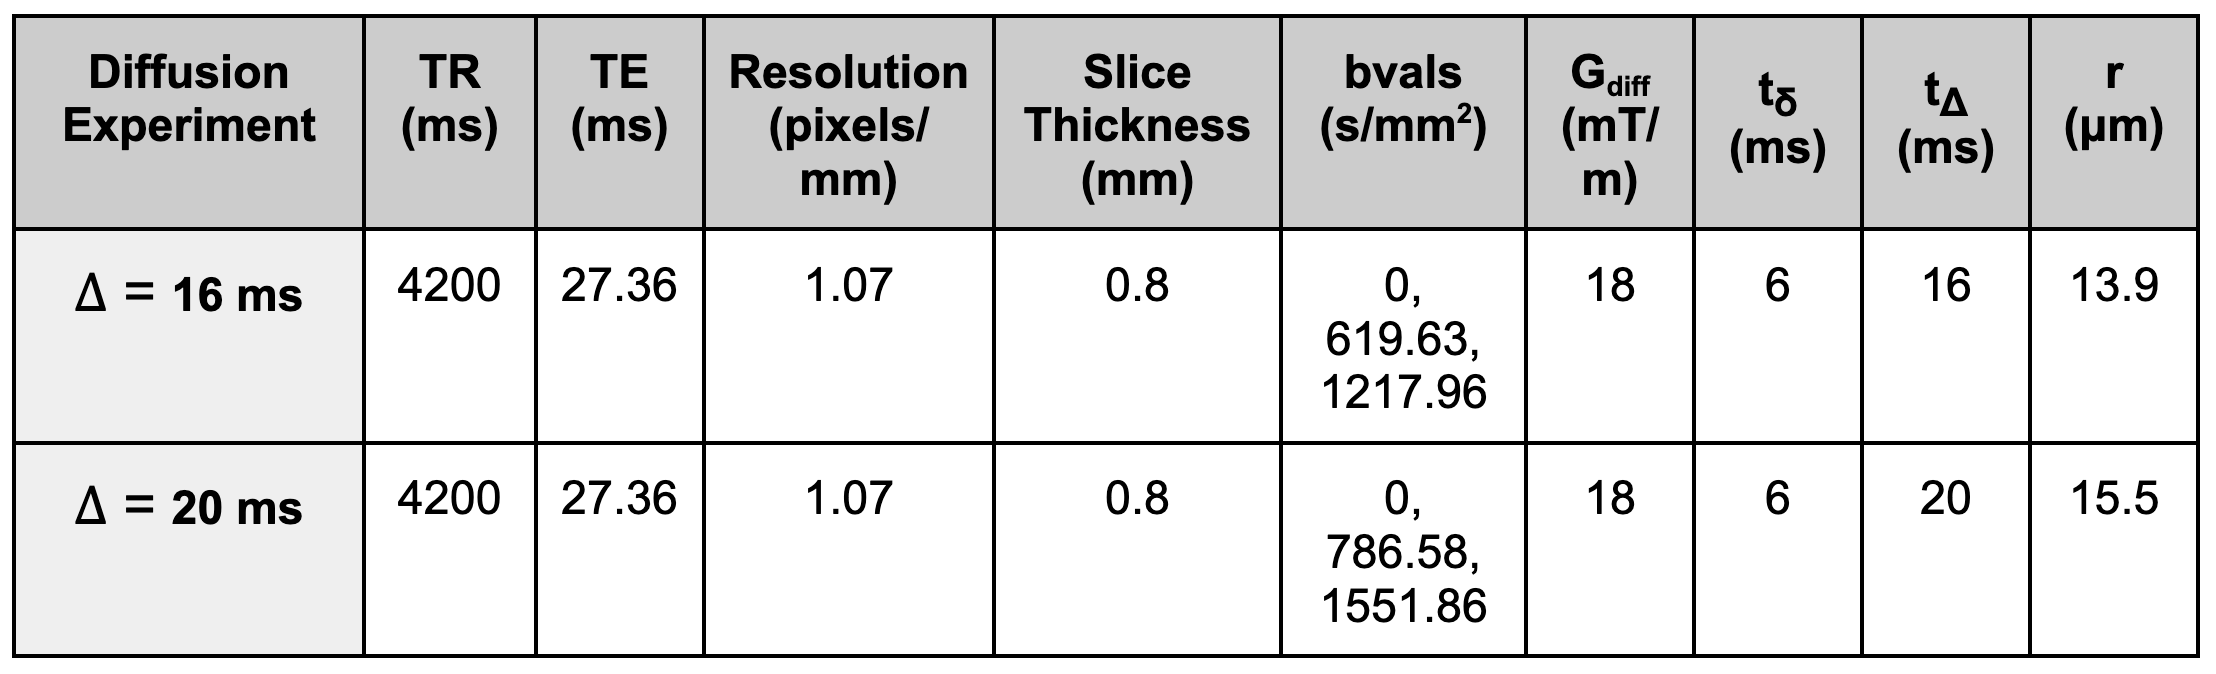
Figure 2: MR scan parameters.
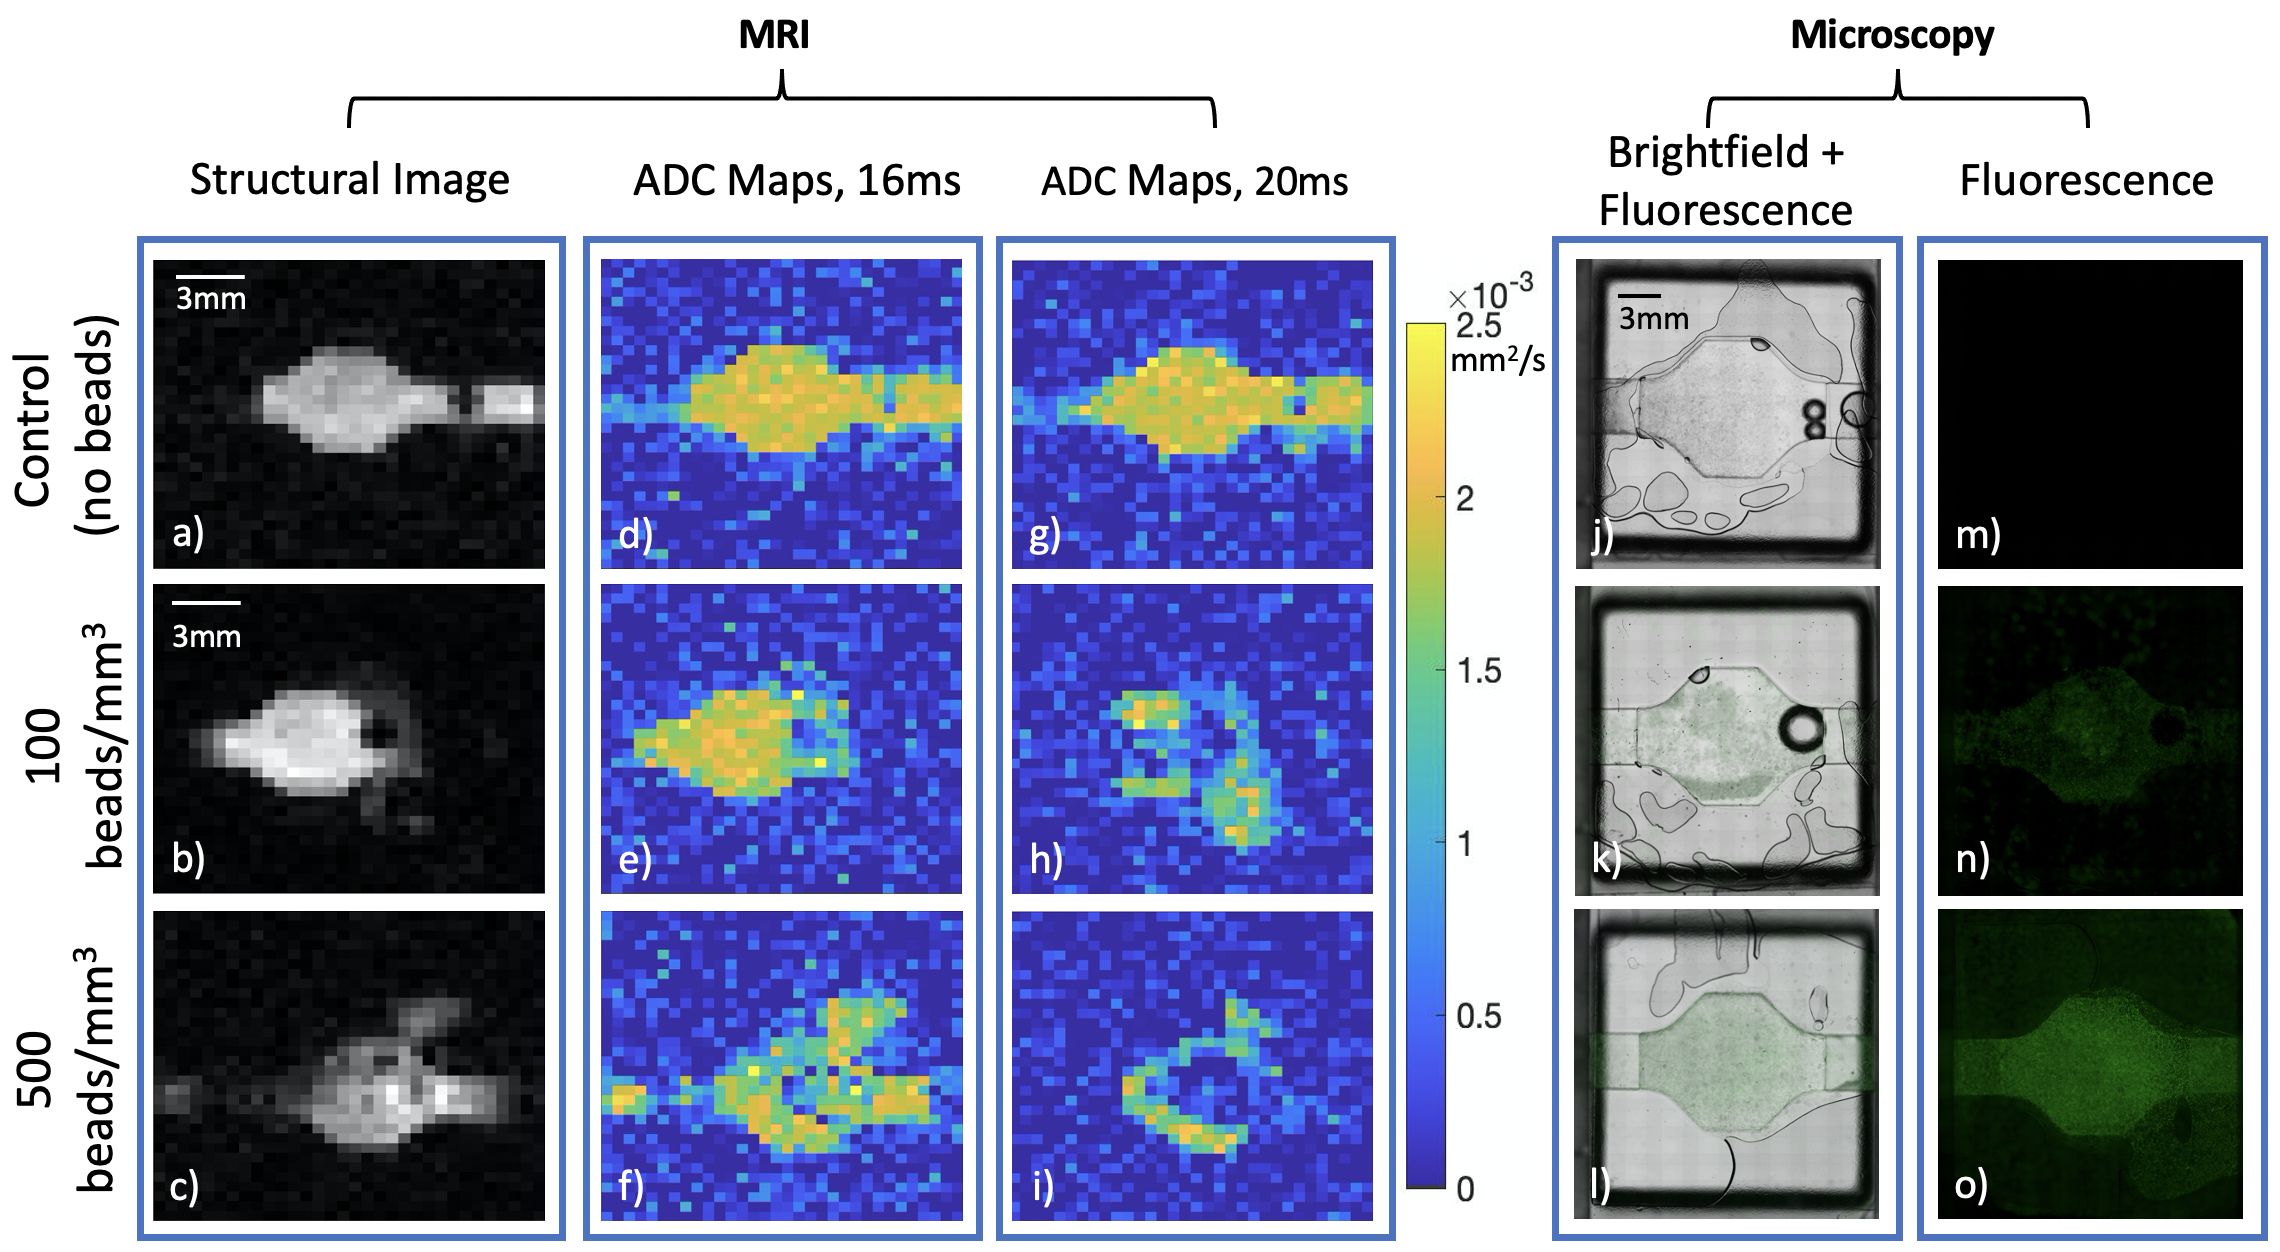
Figure 3: Left side axis denotes fluorescent bead concentration in corresponding row: a-c) Structural MR Images of bioreactor; d-f) Bioreactor ADC maps using 16 ms between diffusion gradients; g-h) Bioreactor ADC maps using 20 ms between diffusion gradients; j-l) Brightfield microscopy images of bioreactor with fluorescence overlay; m-o) Fluorescence channel isolated.
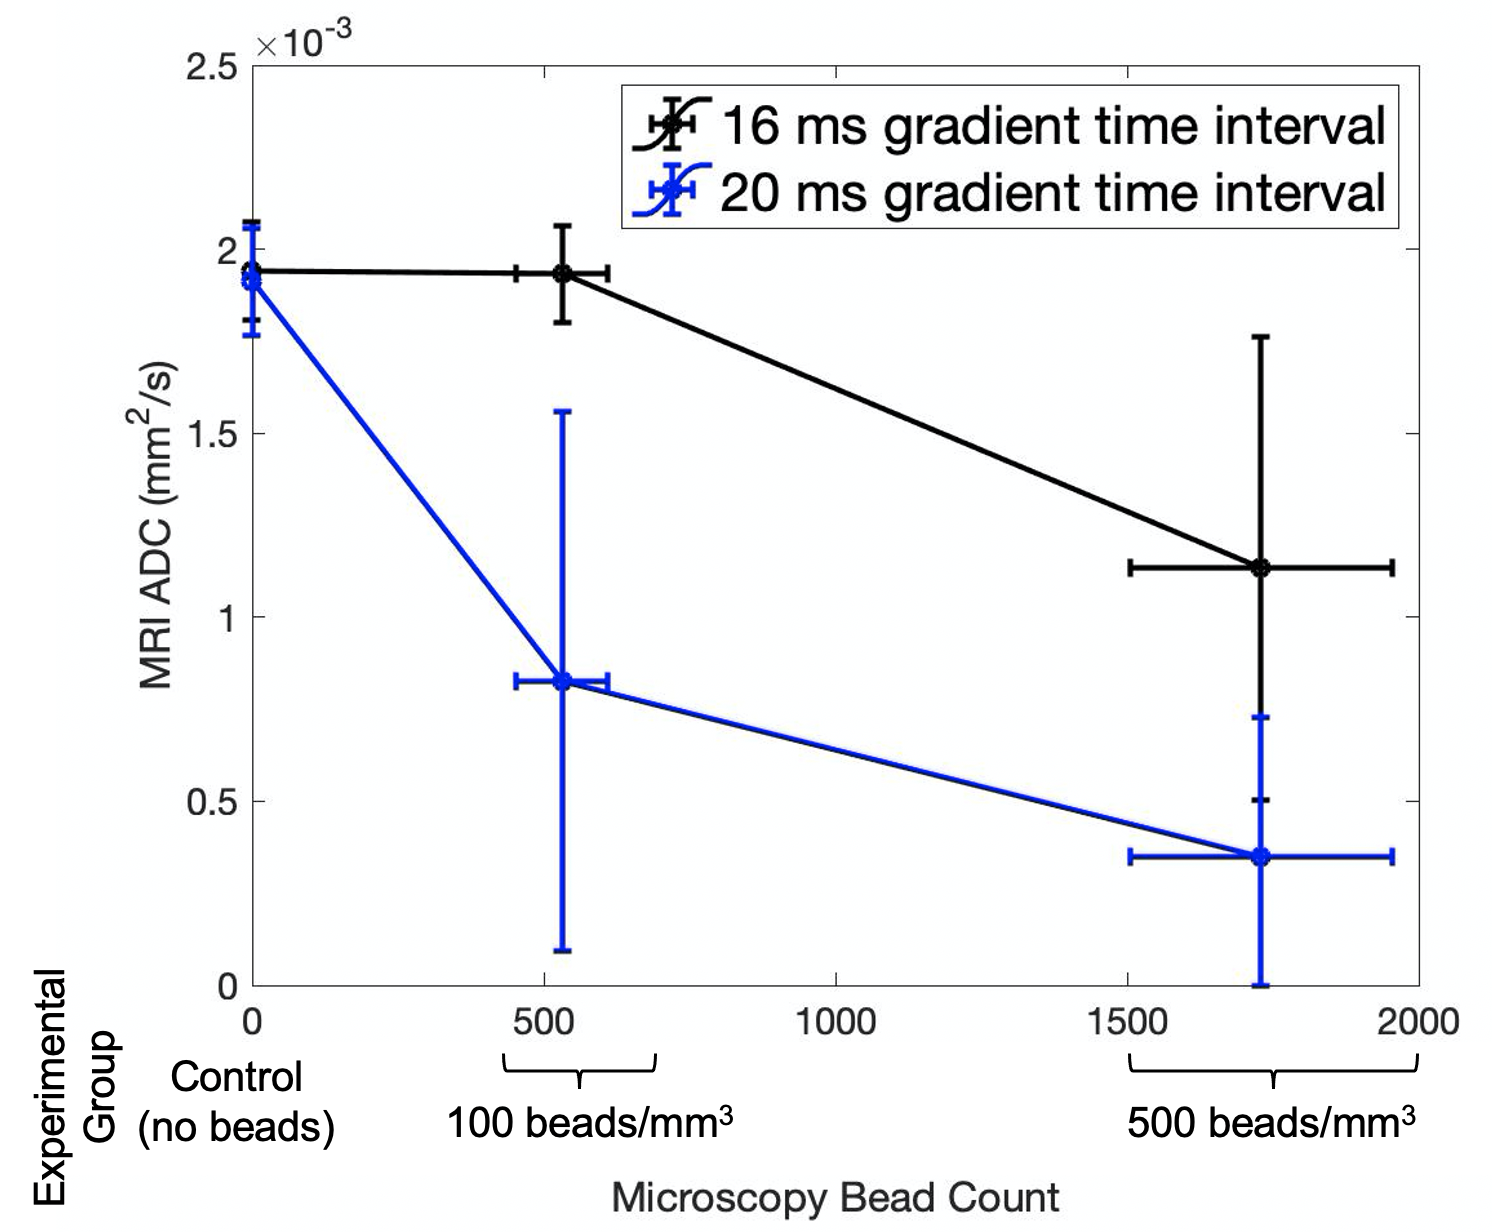
Figure 4: Average (+/- 1 SD) ADC value in hand-selected ROI vs microscopy bead count quantified using ImageJ. Bead concentration experimental group shown along x axis for clarity.
DOI: https://doi.org/10.58530/2022/1977