1976
Quantitative MRI to characterize diffusion-controlled release of gadolinium from a calcium sulphate matrix1Medical Biophysics, Western University, London, ON, Canada, 2Robarts Research Institute, London, ON, Canada, 3Bone & Joint Institute, London, ON, Canada
Synopsis
Calcium sulfate (CS) is commonly used to deliver antibiotics to treat periprosthetic joint infection, which is a leading cause of early revision. There is an unmet need for non-invasive measurement of antibiotic release from CS, which would improve understanding of antibiotic delivery in-vivo. Through the use of a gadolinium-based contrast agent as a surrogate, this study shows that quantitative MRI (R2* and QSM) can be used to track diffusion-controlled release. We demonstrate this in a phantom study consisting of a cylindrical CS core surrounded by agar, where gadolinium diffuses out of the core and through the agar sample.
Introduction
Drug delivery is an important factor in the effectiveness of pharmacological intervention. Ideally, drugs would be applied directly to diseased tissue, have exactly the correct therapeutic concentration over an optimal time period and precisely target the cause of the disease.1 Localized drug delivery systems aim to achieve these ideals by incorporating drugs into a carrier material that is placed at the disease site. Calcium sulphate (CS) hemihydrate is a well-established carrier for the delivery of small molecules in a variety of applications, such as the delivery of antibiotics,2,3 cancer-related drugs,4 and other bioactive agents.5 CS is commonly used to deliver antibiotics to treat periprosthetic joint infection (PJI)6, which is currently the leading cause of early revision of both hip and knee infections in North America7,8 and is likely to grow more prominent,9 particularly as implant design improves fixation and mechanical stability. Techniques to track periprosthetic antibiotic release are an active area of research,10,11 but there remains a need for a clinically viable means of tracking drug release.12There have been numerous in-vitro studies of drug diffusion from CS antibiotic carriers via chemical analysis of eluants2,3,13 but these methods have limited clinical utility as this type of analysis necessitates frequent invasive sampling. These factors contribute to a need for a means of non-invasive measurement, such as imaging, of antibiotic release from CS; such a method would improve our understanding of localized antibiotic delivery in the treatment of PJI. The objective of this study is to quantitatively measure the release and diffusion of a gadolinium-based contrast agent loaded into a CS carrier. We employ quantitative imaging (R2* and QSM) to track the diffusion-controlled release of contrast agent, as a surrogate for antibiotics, into an agar volume surrounding a CS carrier core.
Methods
Experimental Setup: 50 mmol/L Gadobutrol solution was prepared by diluting Gadovist (Bayer Inc., Leverkusen, Germany) with distilled water. Calcium sulphate hemihydrate powder (Stimulan, Biocomposites Ltd., England) was then mixed with 6 ml of the dilute Gadovist and set in a cylindrical mold (17 mm radius and 40 mm length; Figure 1A). The experimental setup consists of a 3D-printed enclosure with a central cylindrical core made of CS loaded with dilute Gadovist that releases into the surrounding agar (Figure 1B).Imaging: Imaging was performed on a 3T scanner with a vendor-supplied 32-channel head coil. Scans were acquired using a 3D multi-echo GRE sequence with matrix size=160x160x60, 16 cm FOV, 1 mm3 resolution, ETL=10 (4.16 ms, 5.52 ms, 6.88 ms, 8.26 ms, 9.76 ms, 11.67 ms, 14.00 ms, 16.34 ms, 18.67 ms, and 21.00 ms), TR=24 ms, BW=1010 Hz/pixel, and a total acquisition time of ~ 4 minutes. The phantom was scanned in the coronal orientation, with the samples placed perpendicular to B0. Scans were acquired 3 hours and 10 hours after pouring the agar, followed by scans at 32 h, 56 h, 80 h, 1 week, 2 weeks and 4 weeks. Complex images were processed using the B0-NICE algorithm14-16 to generate fat fraction, R2*, and B0 maps from the 10 echoes. QSM maps were generated using the MEDI algorithm.17
Data analysis: Circular markers embedded in the phantom were used to register the images acquired at different time points prior to processing and to enable averaging of data (along radial lines) about the centre of the sample, thereby increasing SNR. The radial symmetry of the phantom also enabled modelling of the diffusion-controlled release of gadolinium through an exponential plateau model derived from Fick’s laws of diffusion18 using R2* as a measure of concentration. QSM values from the CS core were averaged from an 8-mm circular ROI.
Results
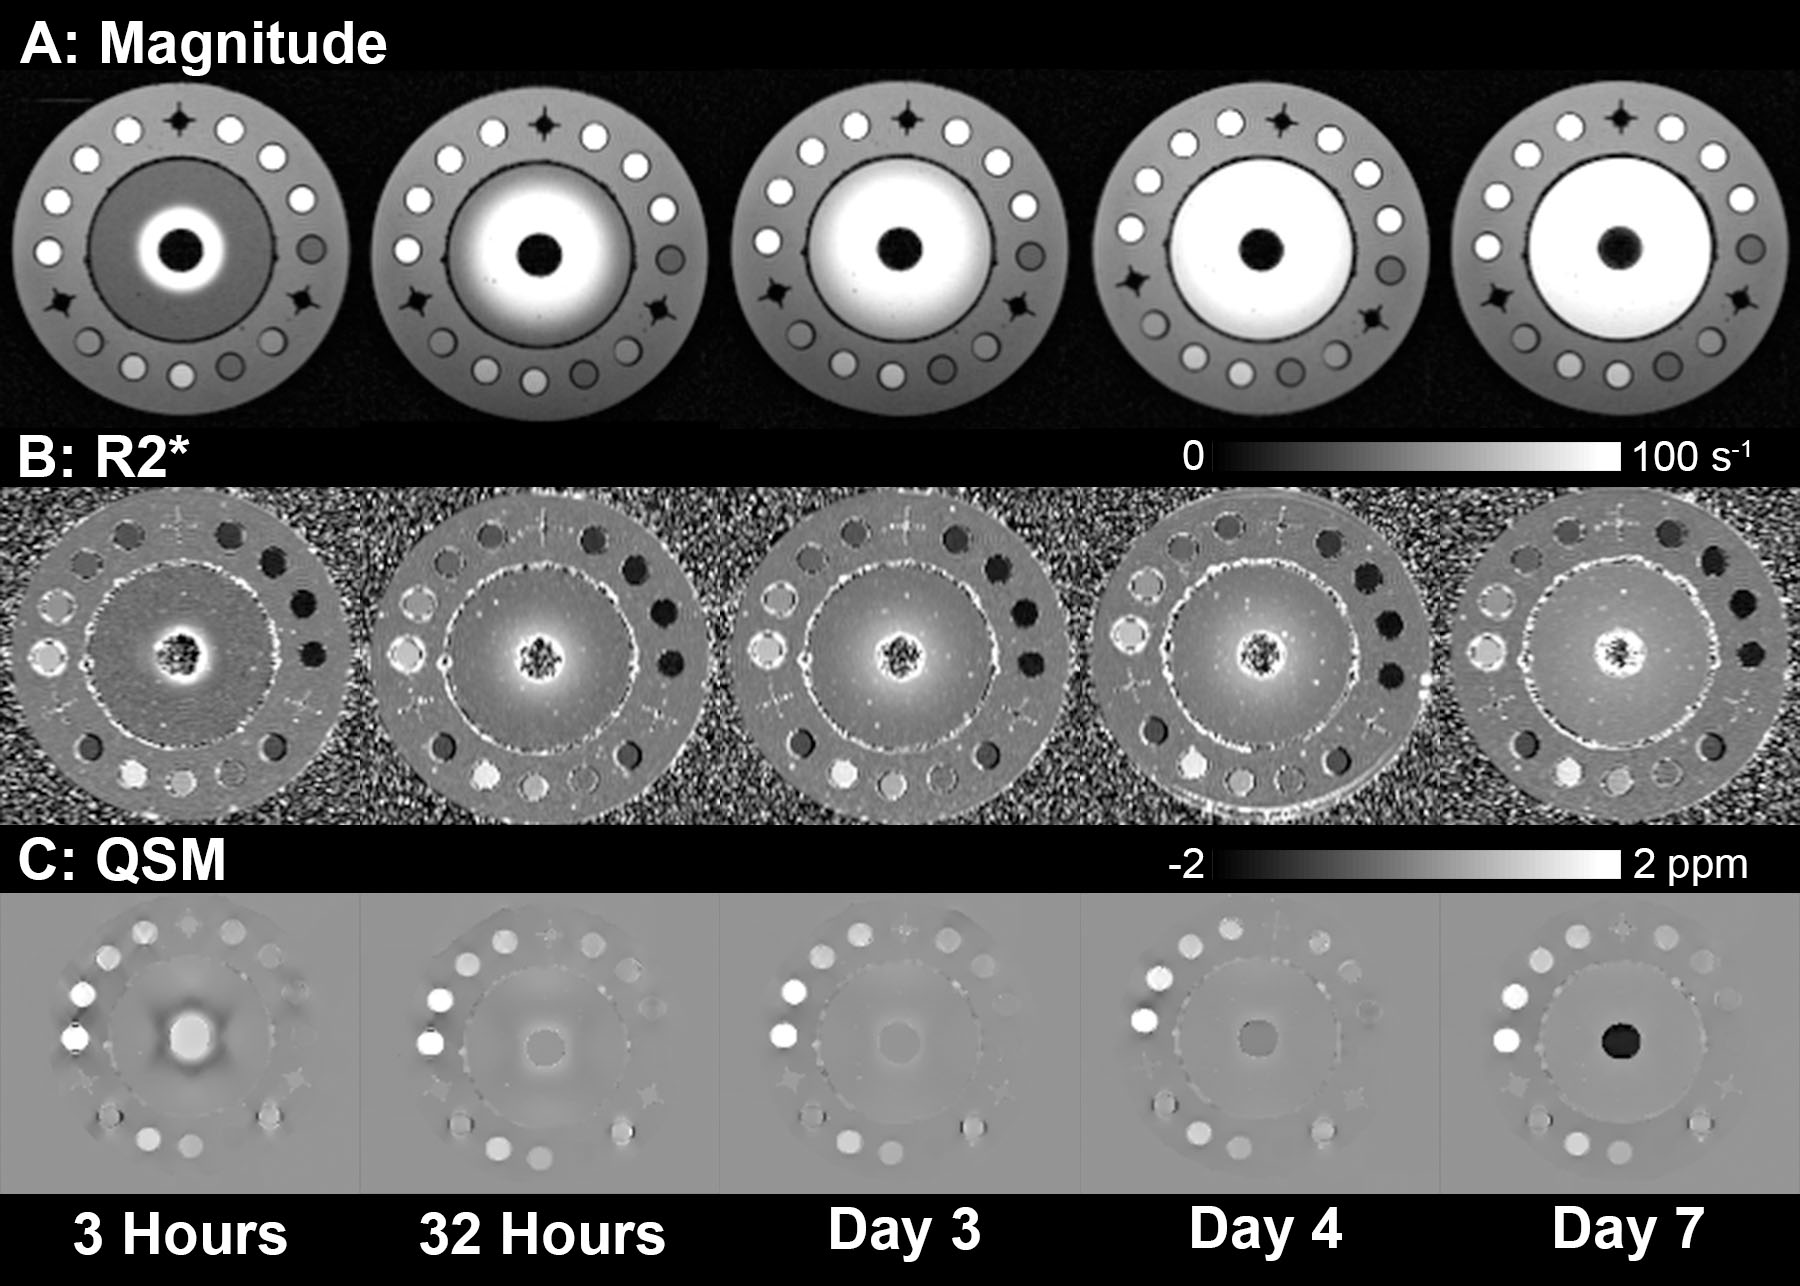
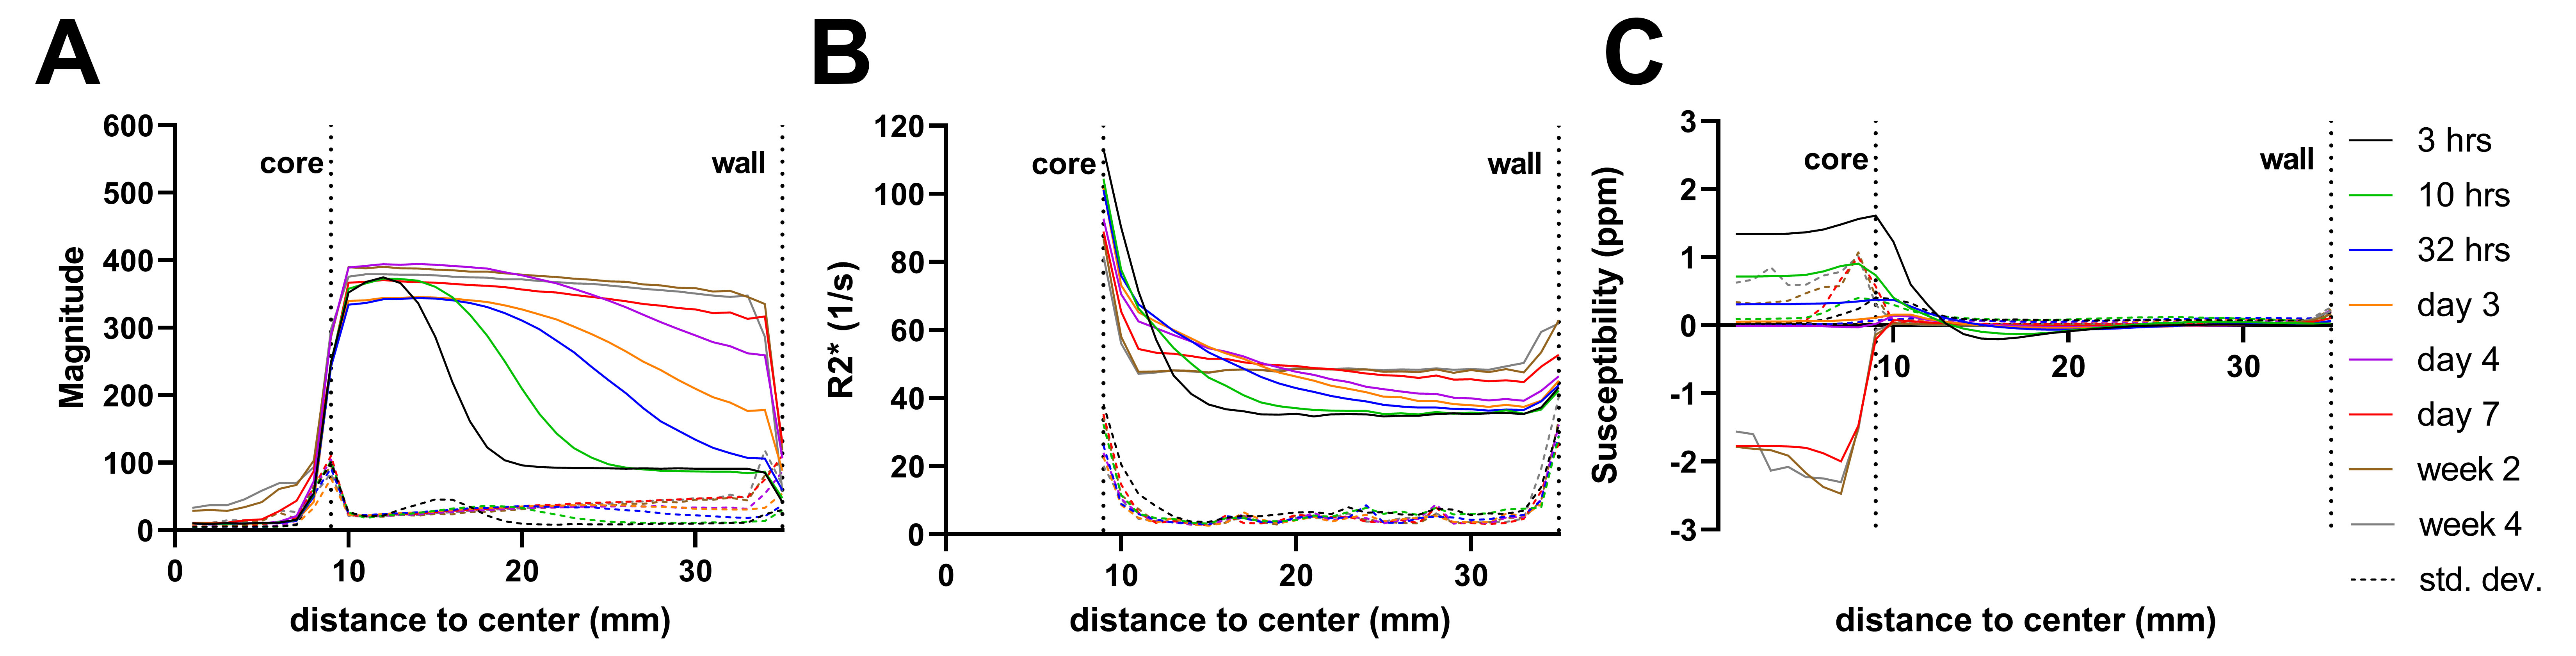
The release of gadolinium contrast was successfully tracked over time in the magnitude images, as well as the R2*, and QSM maps, as shown in Figure 2. Figure 3 shows radially averaged line profiles of magnitude, R2*, and QSM, highlighting the changes over time. The quantitative data fit the exponential plateau model well (Figure 4), enabling the calculation of the diffusion constant governing the release of gadolinium from the CS carrier. The calculated diffusion constant is similar to that found in a similar experiment using Iohexol in micro-CT.19Discussion/Conclusion
We have shown that MRI can be used to monitor diffusion-controlled small molecule release in a commonly used antibiotic carrier used in orthopedic applications. We observed substantial signal enhancement surrounding the CS core, which could be used as a simple surrogate marker of drug clearance. R2* is useful for measuring changes in concentration within the agar sink, which is valuable for modelling a release curve and thus deriving a diffusion constant. QSM measures the loss of gadolinium in the core, which is likely to be a more reliable measurement in a clinical context. Through this study, we have demonstrated that adding gadolinium-based contrast agent to CS-based carriers could allow MRI to fulfill the clinical need for a non-invasive measure of antibiotic release in PJI treatment.Acknowledgements
This work was supported by funding from the Canadian Institutes of Health Research, Ontario Research Fund and the New Frontiers in Research Fund. We also acknowledge support from The Centre for Functional and Metabolic Mapping Internal Funding Program and the Brain Canada Platform Support Grant. G.H., T.K., and S.C are supported in part by a Transdisciplinary Bone & Joint Training Award from the Collaborative Training Program in Musculoskeletal Health Research at The University of Western Ontario.References
1. Tibbitt MW, Dahlman JE, Langer R. Emerging frontiers in drug delivery. J Am Chem Soc 2016;138(3):704-717.
2. Maale GE, Eager JJ, Mohammadi DK, Calderon FA, 2nd. Elution profiles of synthetic caso(4) hemihydrate beads loaded with vancomycin and tobramycin. Eur J Drug Metab Pharmacokinet 2020;45(4):547-555.
3. Laycock PA, Cooper JJ, Howlin RP, Delury C, Aiken S, Stoodley P. In vitro efficacy of antibiotics released from calcium sulfate bone void filler beads. Materials (Basel) 2018;11(11).
4. Phillips H, Maxwell EA, Schaeffer DJ, Fan TM. Simulation of spatial diffusion of platinum from carboplatin-impregnated calcium sulfate hemihydrate beads by use of an agarose gelatin tissue phantom. Am J Vet Res 2018;79(6):592-599.
5. Orellana BR, Hilt JZ, Puleo DA. Drug release from calcium sulfate-based composites. J Biomed Mater Res B Appl Biomater 2015;103(1):135-142.
6. Lum ZC, Pereira GC. Local bio-absorbable antibiotic delivery in calcium sulfate beads in hip and knee arthroplasty. J Orthop 2018;15(2):676-678
7. Canadian Institute for Health Information. Hip and knee replacements in canada, 2017–2018: Canadian joint replacement registry annual report. Ottawa, ON: CIHI; 2019.
8. American Academy of Orthopaedic Surgeons. American joint replacement registry annual report 2019. Rosemont, IL: AAoS; 2019.
9. Schwartz AM, Farley KX, Guild GN, Bradbury Jr TL. Projections and epidemiology of revision hip and knee arthroplasty in the united states to 2030. The Journal of arthroplasty 2020.
10. Liu J, Bu J, Bu W, Zhang S, Pan L, Fan W, Chen F, Zhou L, Peng W, Zhao K, Du J, Shi J. Real-time in vivo quantitative monitoring of drug release by dual-mode magnetic resonance and upconverted luminescence imaging. Angew Chem Int Ed Engl 2014;53(18):4551-4555.
11. Miller RJ, Thompson JM, Zheng J, Marchitto MC, Archer NK, Pinsker BL, Ortines RV, Jiang X, Martin RA, Brown ID, Wang Y, Sterling RS, Mao HQ, Miller LS. In vivo bioluminescence imaging in a rabbit model of orthopaedic implant-associated infection to monitor efficacy of an antibiotic-releasing coating. J Bone Joint Surg Am 2019;101(4):e12.
12. Romanò CL, Petrosillo N, Argento G, Sconfienza LM, Treglia G, Alavi A, Glaudemans A, Gheysens O, Maes A, Lauri C, Palestro CJ, Signore A. The role of imaging techniques to define a peri-prosthetic hip and knee joint infection: Multidisciplinary consensus statements. J Clin Med 2020;9(8).
13. Moore K, Os RW, Dusane DH, Brooks JR, Delury C, Aiken SS, Laycock PA, Sullivan AC, Granger JF, Dipane MV, McPherson EJ, Stoodley P. Elution kinetics from antibiotic-loaded calcium sulfate beads, antibiotic-loaded polymethacrylate spacers, and a powdered antibiotic bolus for surgical site infections in a novel in vitro draining knee model. Antibiotics (Basel) 2021;10(3).
14. Christiansen SD, Liu J, Boffa MB, Drangova M. Simultaneous r(2(*)) and quantitative susceptibility mapping measurement enables differentiation of thrombus hematocrit and age: An in vitro study at 3 t. J Neurointerv Surg 2019;11(11):1155-1161.
15. Liu J, Christiansen SD, Drangova M. Single multi-echo gre acquisition with short and long echo spacing for simultaneous quantitative mapping of fat fraction, b0 inhomogeneity, and susceptibility. Neuroimage 2018;172:703-717.
16. Liu J, Drangova M. Method for b0 off-resonance mapping by non-iterative correction of phase-errors (b0-nice). Magn Reson Med 2015;74(4):1177-1188.
17. Liu J, Liu T, de Rochefort L, Ledoux J, Khalidov I, Chen W, Tsiouris AJ, Wisnieff C, Spincemaille P, Prince MR, Wang Y. Morphology enabled dipole inversion for quantitative susceptibility mapping using structural consistency between the magnitude image and the susceptibility map. Neuroimage 2012;59(3):2560-2568.
18. Siepmann J, Siepmann F. Modeling of diffusion controlled drug delivery. J Control Release 2012;161(2):351-362.
19. Khazaee T, Norley CJ, Nikolov H, Pollmann S, Holdsworth D. Micro-CT imaging technique to characterize diffusion of small-molecules: SPIE; 2020.Figures