1974
Mapping human brain development at new spatial resolutions using deep learning and high-resolution quantitative MRI
Georgia Doumou1,2, Hongxiang Lin2,3, Sara Lorio1, Lenka Vaculčiaková4, Kerrin J. Pine4, Nikolaus Weiskopf4,5, Jonathan O'Muircheartaigh6,7,8, Daniel C. Alexander2, and David W. Carmichael 1
1Biomedical Engineering and Imaging Sciences, King's College London, London, United Kingdom, 2Centre for Medical Image Computing, Department of Computer Science, University College London, London, United Kingdom, 3Research Center for Healthcare Data Science, Zhejiang Lab, Hangzhou, China, 4Department of Neurophysics, Max Planck Institute for Human Cognitive and Brain Sciences, Leipzig, Germany, 5Felix Bloch Institute for Solid State Physics, Faculty of Physics and Earth Sciences, Leipzig University, Leipzig, Germany, 6Department of Forensic & Neurodevelopmental Sciences, King's College London, London, United Kingdom, 7Centre for the Developing Brain, Department of Perinatal Imaging and Health, King's College London, London, United Kingdom, 8MRC Centre for Neurodevelopmental Disorders, King's College London, London, United Kingdom
1Biomedical Engineering and Imaging Sciences, King's College London, London, United Kingdom, 2Centre for Medical Image Computing, Department of Computer Science, University College London, London, United Kingdom, 3Research Center for Healthcare Data Science, Zhejiang Lab, Hangzhou, China, 4Department of Neurophysics, Max Planck Institute for Human Cognitive and Brain Sciences, Leipzig, Germany, 5Felix Bloch Institute for Solid State Physics, Faculty of Physics and Earth Sciences, Leipzig University, Leipzig, Germany, 6Department of Forensic & Neurodevelopmental Sciences, King's College London, London, United Kingdom, 7Centre for the Developing Brain, Department of Perinatal Imaging and Health, King's College London, London, United Kingdom, 8MRC Centre for Neurodevelopmental Disorders, King's College London, London, United Kingdom
Synopsis
High-resolution quantitative MRI using ultra-high field scanners (7T) could advance a range of research and clinical applications if limitations, both practical (e.g. long acquisitions) and technical (e.g. B1 non-uniformity), can be avoided. This could be achieved by using 7T information to enhance conventional field strength images. To test this approach, paired 3T-7T R1 maps were used to train a U-Net variant to enhance 3T R1 maps. Leave-one-out cross-validation, quantitative evaluation, as well as external validation on an external clinical dataset, demonstrated promising enhancement with visual and quantitative metrics more similar to 7T R1 maps than the 3T equivalents.
Introduction
Imaging at higher resolutions facilitated by the increased SNR available at 7T has shown promising results for the detection of small cortical pathological abnormalities, a common cause of drug resistant focal epilepsy1, while also improving cortical thickness measurements2, an important measure of development. Quantitative maps (e.g. R1=1/T1) may also improve reproducibility and reduce sensitivity to imaging protocol variability3. However, quantitative high-resolution scans at 7T are long, making data acquisition challenging, which is exacerbated in a paediatric setting. Therefore, we aimed to use the image quality transfer framework4 (IQT) to achieve the resolution currently possible at 7T in compliant subjects 0.5mm by enhancing 1mm resolution R1 maps obtained at 3T in paediatric patients.Methods
Quantitative R1 maps were obtained in n=10 healthy subjects at both 3T (1mm) and 7T (0.5mm) (@MPI) using multi-parameter mapping (MPM) protocol based on 3D multi-echo GRE sequence acquisitions with variable flip angles3,5 and the hMRI toolbox6. A one-to-one mapping of the paired R1 maps was achieved via masking the brain, before co-registering and re-slicing the 3T to the 7T R1 map. Using IQT, a library of paired 3T-to-7T patches (without providing spatial information) was created from 9/10 subjects and used to train the U-Net variant as described by Lin et al7. The network hyper-parameters optimized via initial testing and visual assessment can be seen in table 1.A leave-one-out cross-validation was performed repeatedly (nrepeats=7) leaving a different subject out from the training process before reconstructing the excluded subject’s enhanced 3T map. Quantitative evaluation was performed by creating percentage absolute difference maps and by calculating four metrics8-10 (root mean squared error (RMSE), peak-signal-to-noise ratio (PSNR), structural similarity image metric (SSIM) and universal quality index (UQI)) between a) 3T-7T, b) 3T-3T enhanced, and c) 7T-3T enhanced R1 maps. A t-test was also performed to show any significant differences between a-c.
Finally, to assess the generalizability of the network, we reconstructed 3T enhanced maps using 8 paediatric 3T R1 maps from a group of patients with focal epilepsy (GOSH). These maps were not used either for training or the validation steps. Only visual inspection has been performed so far on these enhanced images.
Results
After tuning the hyper-parameters, overall, the 3T maps were enhanced to have increased apparent resolution compared to 3T and reduced noise but similar features to 7T R1 maps based on visual inspection.When comparing the 3T to the 7T R1 maps, the difference maps showed some high spatial frequency information and motion/flow artefacts that are apparent in the 7T, but not in the 3T R1 maps (Fig. 1d) in addition to field-dependent differences in R1 values within tissue class. Similar differences were observed when comparing the 3T enhanced to the 3T R1 map (Fig. 1e), with the exception of the 7T artefacts, indicating that the 7T T1 values were broadly correctly inferred from the 3T maps while, interestingly, 7T R1 map artefacts and noise were generally not transferred to the 3T enhanced maps (Fig. 1f). It is also noted that there is no edge effect (GM-WM boundary) in the difference map between 3T enhanced and 7T R1 maps. Similar findings were confirmed quantitatively; metrics of image quality were more similar between the 3T enhanced and 7T R1 maps but were significantly different between the 3T enhanced and 3T R1 maps (Table 2).
Finally, the 3T enhanced R1 maps appeared to maintain or improve resolution of structural abnormalities (e.g. the transmantle sign, often associated with focal cortical dysplasia) that were present in 2/8 of the external clinical test dataset, but not in the training data, showing generalizability of the network (Fig. 2).
Discussion
The 3T R1 maps enhanced using IQT were more similar to the 7T R1 maps than the 3T R1 maps when assessed visually and quantitatively via reduced RMSE and increased PSNR, SSIM and UQI scores. The 7T R1 maps used for training contained artefacts (B1, B0 inhomogeneity related and white noise). Interestingly, the 3T enhanced R1 maps had visibly reduced artefacts compared to the training data, suggesting these artefacts could be further mitigated particularly with an improved training set. The similar results observed in SSIM when comparing the 3T enhanced to the 3T and 7T R1 maps could be related to the noise and artefacts in the ‘gold standard’ 7T R1 maps. Preliminary results enhancing R1 maps from a separate site, containing pathology that the network was naive to, appeared to result in high quality reconstructions. This generalizability may be explained by the potential synergy of IQT and quantitative mapping, because of the considerable reduction in inter-site data variability in the R1 maps.Conclusion
A patch-based deep-learning method applicable with limited training data has been applied to quantitative R1 maps obtained at 3T at 1mm and 7T at 0.5mm isotropic resolutions. 3T enhanced maps demonstrated high quality compared to the 7T maps and generalisability was demonstrated in data from a different site with pathology not present in the training data, suggesting a synergy between parameter mapping and IQT approaches. Further quantitative and radiological validation is required in a larger sample to validate these promising initial findings.Acknowledgements
This project is funded by the Biotechnology and Biological Sciences Research Council (BBSRC) and the student (GD) is part of the London Interdisciplinary Doctoral Training Programme (LIDo DTP). This work was also supported by core funding from the Wellcome/EPSRC Centre for Medical Engineering [WT203148/Z/16/Z]. NW received funding from the European Research Council under the European Union's Seventh Framework Programme (FP7/2007-2013) / ERC grant agreement n° 616905, and from the European Union's Horizon 2020 research and innovation programme under the grant agreement No 681094. The Max Planck Institute for Human Cognitive and Brain Sciences has an institutional research agreement with Siemens Healthcare. NW holds a patent on acquisition of MRI data during spoiler gradients (US 10,401,453 B2). NW was a speaker at an event organized by Siemens Healthcare and was reimbursed for the travel expenses. The external clinical dataset was provided by Great Ormond Street Hospital (GOSH). The research to acquire these data was funded by the Henry Smith Charity and Action Medical Research (GN2214) and supported by the National Institute of Health Research (NIHR) Great Ormond Street Hospital Biomedical Research Centre.References
- Wang, I., Oh, S., Blümcke, I., Coras, R., Krishnan, B., Kim, S., et al. Value of 7T MRI and post-processing in patients with nonlesional 3T MRI undergoing epilepsy presurgical evaluation. Epilepsia. 2020;61:2509–20
- Lüsebrink, F., Wollrab, A., and Speck, O. Cortical thickness determination of the human brain using high resolution 3T and 7T MRI data. Neuroimage. 2013; 70, 122-131
- Weiskopf, N., Suckling, J., Williams, G., Correia, M.M., Inkster, B., Tait, R. C.Ooi, Bullmore, E.T, Lutti, A. Quantitative multi-parameter mapping of R1, PD(*), MT, and R2(*) at 3T: a multi-center validation. Front. Neurosci. 2013; 7, 95
- Alexander, D.C., Zikic, D., Ghosh, A., Tanno, R., Wottschel, V., Zhang, J., Kaden, E., Dyrby, T.B., Sotiropoulos, S.N., Zhang, H., Criminisi, A. Image quality transfer and applications in diffusion MRI. NeuroImage. 2017;152, 283–2985.
- Trampel, R., Bazin, P.-L., Pine, K., and Weiskopf, N. In-vivo magnetic resonance imaging (MRI) of laminae in the human cortex. Neuroimage, 2019;197, 707-715K.
- Tabelow, E. Balteau, J. Ashburner, M.F. Callaghan, B. Draganski, G.Helms, F. Kherif, T. Leutritz, A. Lutti, C. Phillips, E. Reimer, L. Ruthotto, M. Seif, N.Weiskopf, G. Ziegler, S. Mohammadi. hMRI – a toolbox for quantitative MRI in neuroscience and clinical research. Neuroimage. 2019;194, 191-210
- Lin, H., Figini, M., Tanno, R., Blumberg, S.B., Kaden, E., Ogbole, G., Brown, B.J., D’Arco, F., Carmichael, D.W., Lagunju, I., Cross, H.J., Fernandez-Reyes, D., Alexander, D.C. Deep learning for low-field to high-field MR: image quality transfer with probabilistic decimation simulator. In: Knoll, F., Maier, A., Rueckert, D., Ye, J.C. (eds.) MLMIR 2019. LNCS, 2019;11905, 58–70. Springer, Cham
- Eskicioglu, A.M. and Fisher, P.S., "Image quality measures and their performance," IEEE '/Tans.Communications, 1998;43,29S9-2965
- Wang, Z., Bovik, A.C., Sheikh, H.R., Simoncelli, E.P.: Image quality assessment: from error visibility to structural similarity. IEEE Transactions on Image Processing 2004;13(4), 600–612
- Wang, Z., and Bovik, A. C."A universal image quality index," IEEE Signal Processing Letters, 2002
Figures
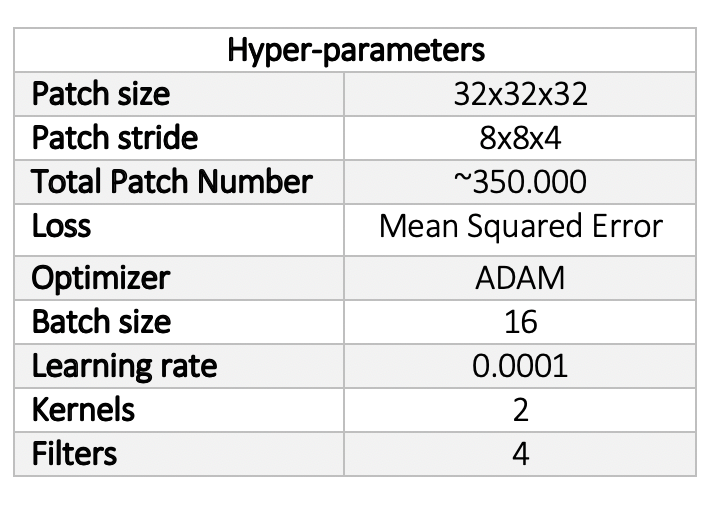
Table 1: The hyper-parameters of the network as optimised and set after initial visual assessment
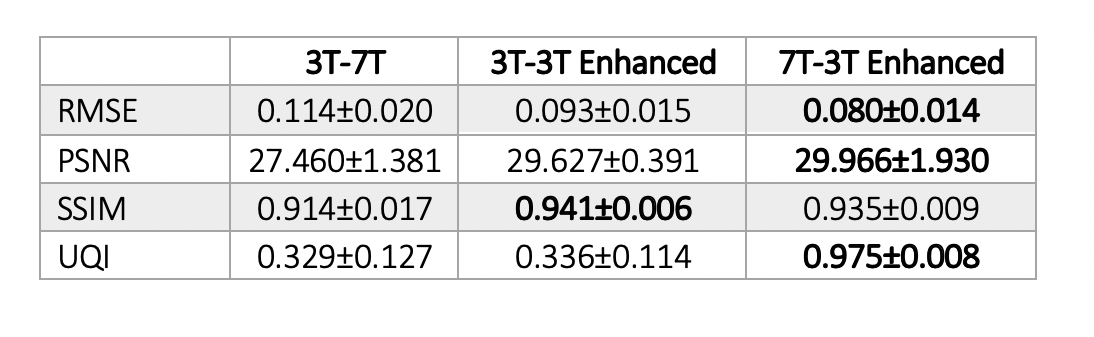
Table 2. Quantitative image quality metrics. The mean and standard deviation of RMSE, PSNR, SSIM and UQI calculated over 7 subjects for a) 3T and 7T, b) 3T and 3T enhanced, and c) 7T and 3T enhanced R1 maps. For each case, the best performance has been highlighted.
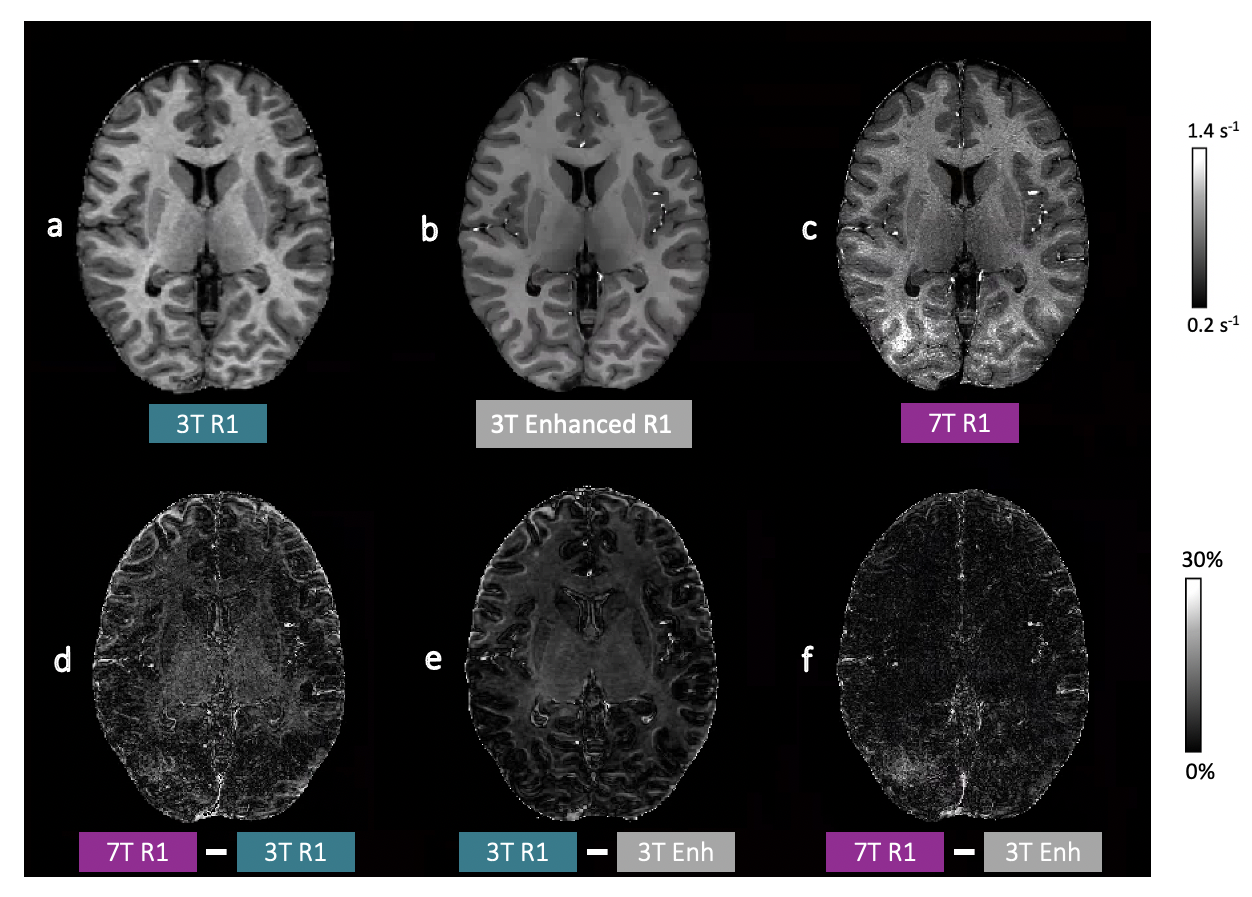
Figure 1: Example R1 maps and absolute difference maps. a) 3T, b) 3T Enhanced, and c) 7T R1 maps (top row) and difference maps from d) 3T and 7T, e) 3T and 3T enhanced, and d) 7T and 3T enhanced R1 maps (bottom row).
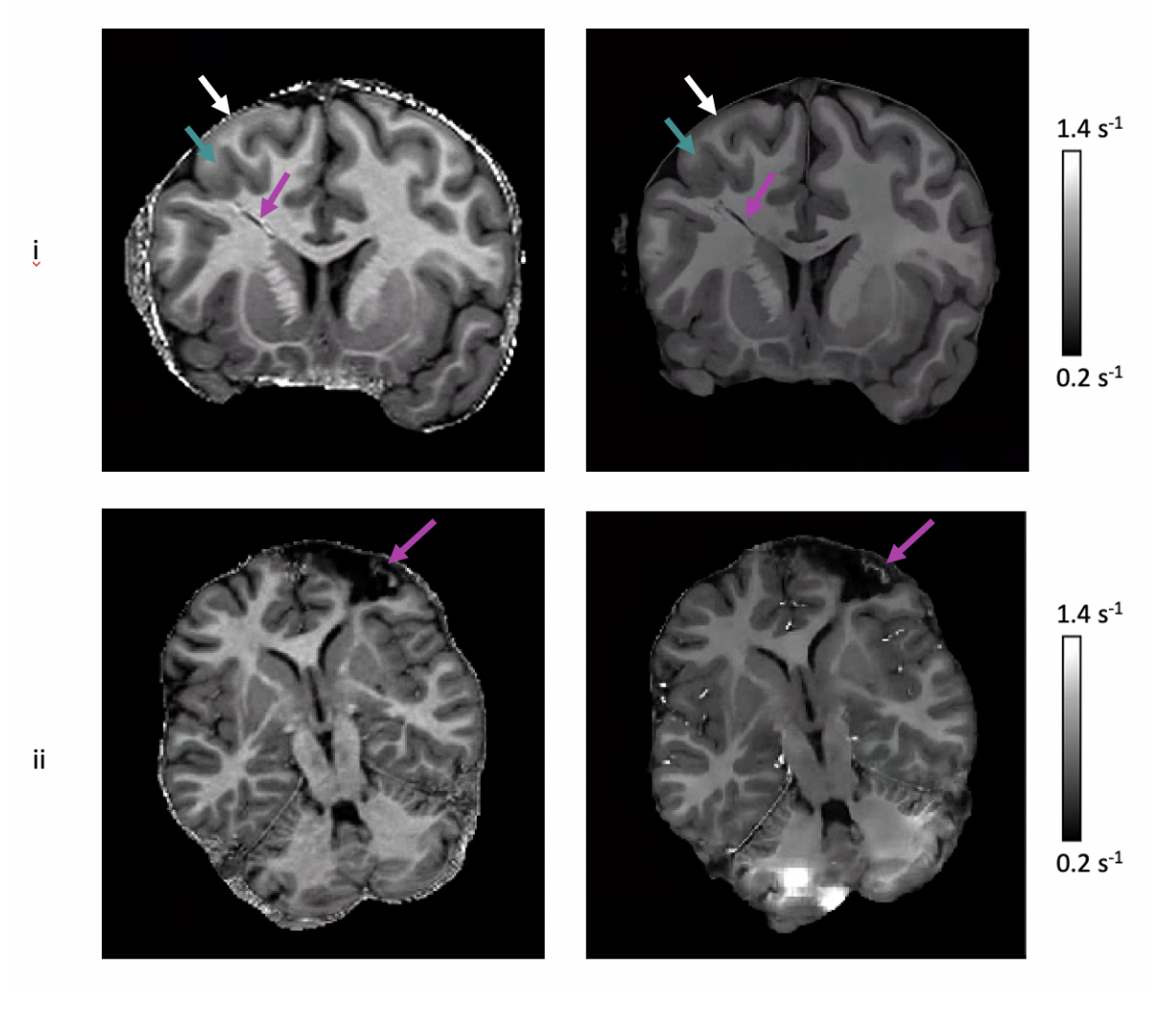
Figure 2: Examples of enhanced 3T R1 maps that were created by testing on R1 maps from 2/8 paediatric patients (i,ii) in the external clinical dataset. 3T R1 maps (left column) and enhanced 3T R1 map (right column); i) Coronal view with the purple arrows indicating the irregular hypo-intense area, green arrows the GM thickening and white arrows the blurred GM-WM junction; ii) Axial view with the purple arrows indicating the details within the resected area. “Blocky” regions in the cerebellum may be a result of the patch re-assembling method used in IQT.
DOI: https://doi.org/10.58530/2022/1974