1973
Subject classification based on functional connectivity and white matter microstructure in a rat model of Alzheimer’s using machine learning1Laboratory of Functional and Metabolic Imaging, Ecole Polytechnique Fédérale de Lausanne, Lausanne, Switzerland, 2CIBM Center for Biomedical Imaging, Lausanne, Switzerland, 3Animal Imaging and Technology, Ecole Polytechnique Fédérale de Lausanne, Lausanne, Switzerland, 4Faculdade de Ciências da Universidade de Lisboa, Lisbon, Portugal, 5Department of Radiology, Lausanne University Hospital, Lausanne, Switzerland
Synopsis
Impaired brain glucose consumption is a possible trigger of Alzheimer’s disease (AD). Previous work revealed affected brain structure and function by insulin resistance in terms of functional connectivity and white matter microstructure in a rat model of AD. Here, functional and structural metrics were further used to classify Alzheimer’s from control rats using logistic regression. Our study highlights the MRI-derived biomarkers that best discriminate Alzheimer’s vs control rats early in the course of the disease, with potential translation to human AD.
Introduction
Impaired brain glucose consumption is a possible trigger of Alzheimer’s disease (AD)1. Brain insulin resistance and AD-like features can be induced in animals by an intracerebroventricular (icv) injection of streptozotocin (STZ)2–4. However, how brain insulin resistance affects neurodegeneration is not fully understood.We performed a longitudinal study in the icv-STZ rat model to characterize alterations in functional connectivity (FC) and white matter (WM) microstructure using functional and diffusion MRI. Functional and structural metrics were further used to classify STZ from control rats using logistic regression (LR) and the importance of each feature was quantified.
Our study highlights the MRI-derived biomarkers that best discriminate Alzheimer’s vs control rats early in the course of the disease, with potential translation to human AD.
Methods
Experimental: All experiments were approved by the local Service for Veterinary Affairs. Resting-state fMRI and diffusion MRI data were acquired longitudinally at four timepoints (2, 6, 13 and 21 weeks since icv injection) (see Fig. 1 for details).Processing: FMRI data processing followed the PIRACY pipeline5. FC matrices between 28 atlas-based ROIs were computed, co-varying for the global signal5. Diffusion MRI images were denoised6, Gibbs-ringing corrected7 and EDDY-corrected8. Diffusion and kurtosis tensors were calculated9 to extract typical metrics (AxD/RD, axial/radial diffusivity, MK/AK/RK, mean/axial/radial kurtosis) and the WMTI-Watson model10 parameters (axon diffusivity $$$D_a$$$, density f, and dispersion $$$c_2$$$, extra-axonal diffusivities $$$D_{e,||}$$$/$$$D_{e,⊥}$$$) were estimated in WM voxels. Corpus callosum, cingulum and fimbria were automatically segmented using atlas-based registration. Tensor and model metrics were averaged in each ROI. Group differences were tested using t-test.
Classification: For fMRI-based classification, FC matrices were vectorized by keeping only the upper triangle so that each vector consisted of 378 correlation coefficients of each ROI pair as features. Datasets were grouped as all timepoints (Pooled, N=162), or Early (2&6 weeks, N=94) and Late (13&21 weeks, N=68). STZ/CTL classification using LR was trained and tested on each subset (Pooled, Early, Late), randomly split into training (70%) and test datasets (30%). In parallel, CTL/STZ functional connectivity differences in Pooled, Early and Late datasets were tested using non-parametric permutation tests (N=5000) with NBS11 and significant edges were extracted.For diffusion MRI-based classification, the datasets (N=83) were randomly split into training (70%) and test sets (30%). Diffusion and kurtosis tensor metrics (N=5) and WMTI-Watson model parameters (N=5) in the 3 WM ROIs were first combined as features to classify STZ and CTL rats. Second, they were separated as two feature vectors (DKI only and WMTI-Watson only) and used independently in classification.
Results
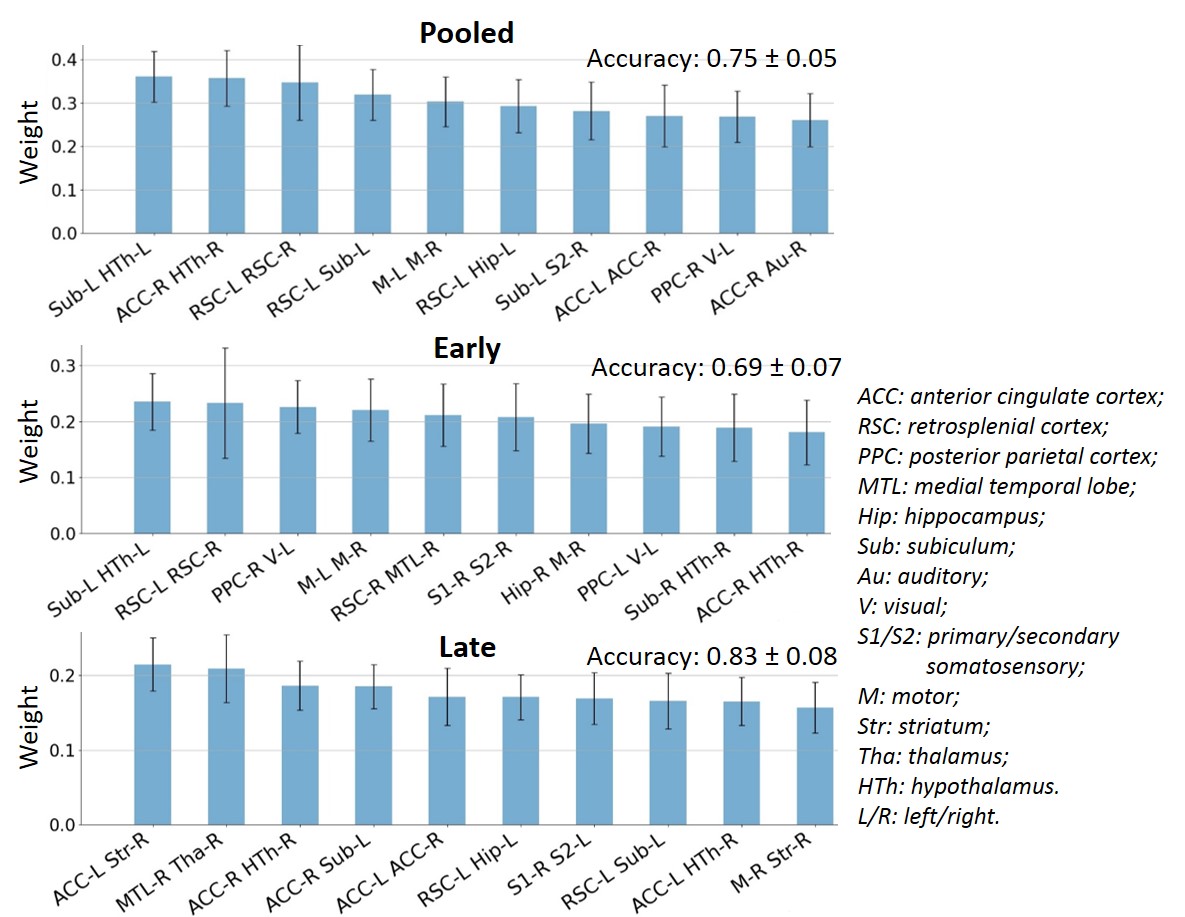
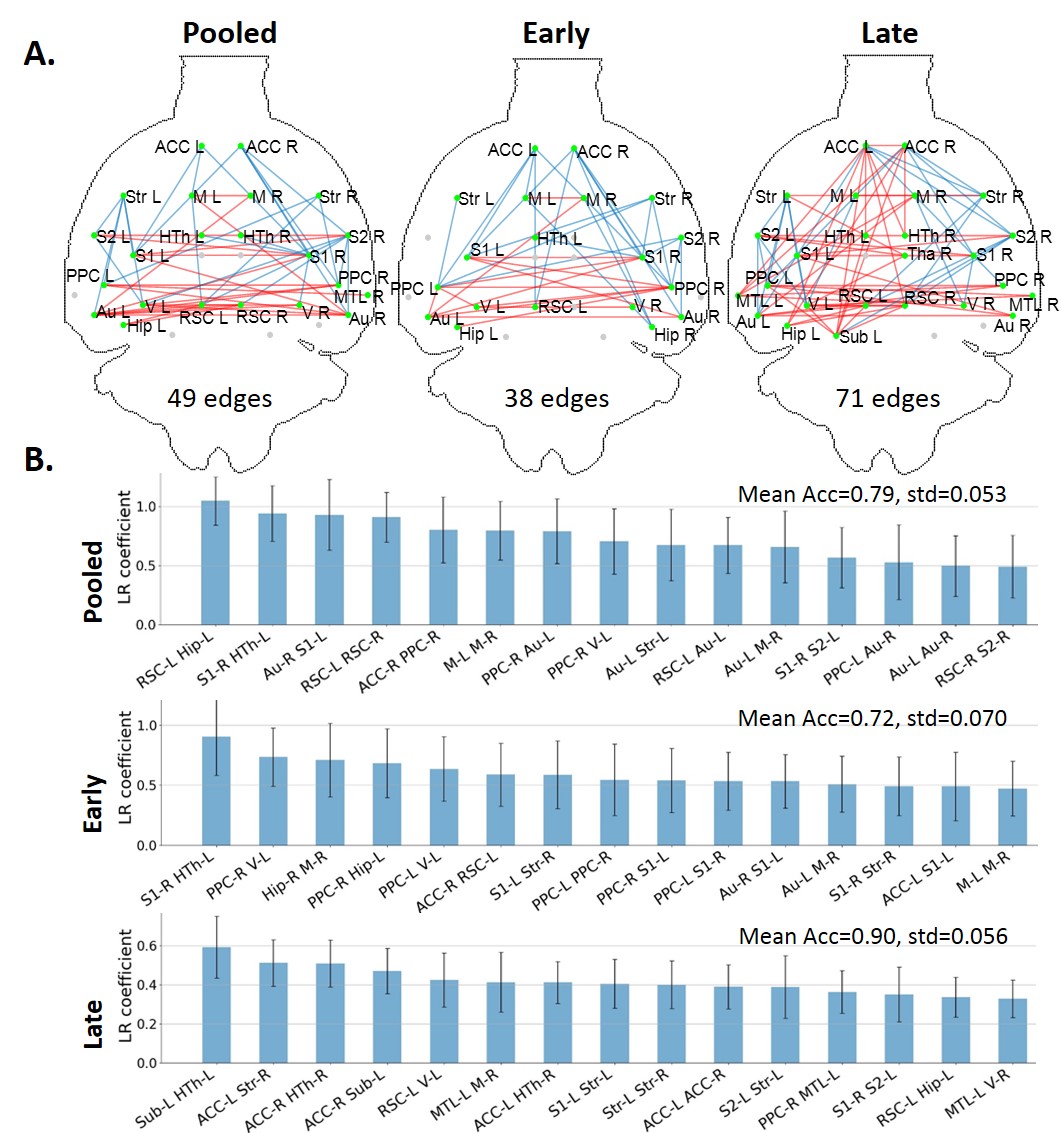
FC-based classification: When using all edges as features (N=378), accuracy on the Pooled, Early and Late datasets was 0.75, 0.69 and 0.83, respectively. The most relevant edges involved the anterior cingulate cortex (ACC), hypothalamus, retrosplenial cortex (RSC), hippocampus and subiculum (Fig. 2) and correspond to edges found as significantly different between groups in the NBS analysis (Fig. 3A).In order to reduce dimensionality, significant edges from the NBS analysis were selected as a reduced list of features for classification (N=49, 38 and 71 features in the Pooled, Early and Late datasets, respectively). Classification accuracy improved to 0.79 for Pooled, 0.72 for Early and 0.90 for Late datasets (Fig. 3B). Improved accuracy was not strictly related to feature reduction: reducing features based on principal component analysis deteriorated classification accuracy (data not shown). However, the top 10 features identified in Fig. 3B did not have strong overlap with the top 10 features identified previously (Fig. 2).
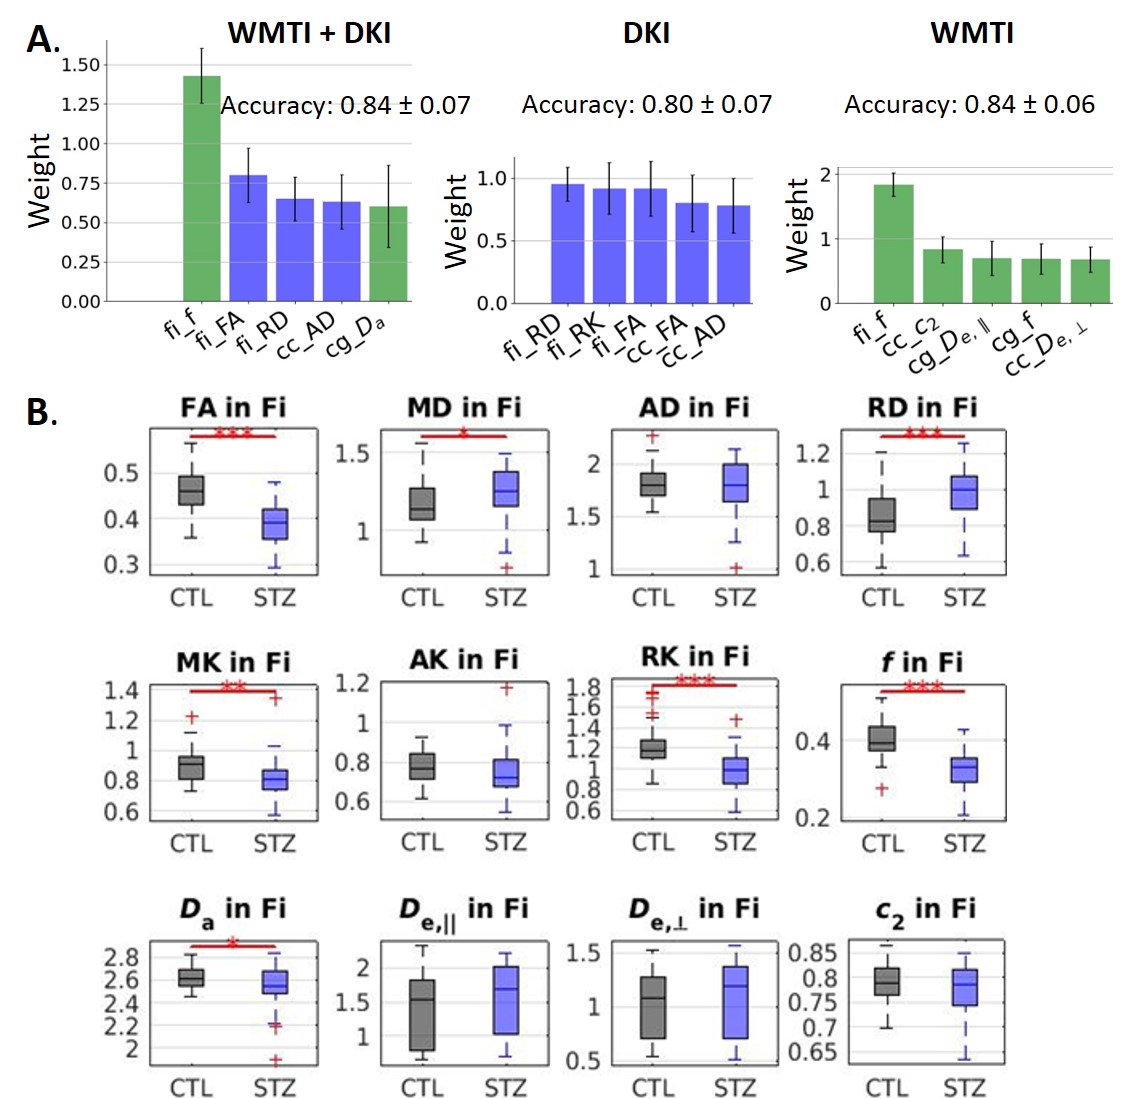
Diffusion-based classification: accuracy was 0.84, 0.80 and 0.84 on data using WMTI+DKI, DKI and WMTI features, respectively. The microstructure features that best enabled classification included f, FA and RD in fimbria (Fig. 4A). Those metrics also showed significant group differences (Fig. 4B).
Discussion and Conclusions
When using FC to classify STZ/CTL rats, the most important discriminating features were edges involving the RSC, ACC, Subiculum and Hippocampus, which are regions of the default mode network typically affected by AD12–14, as well as the Hypothalamus which is responsible for recruiting alternative sources of energy to glucose, such as ketone bodies15–19. The classification accuracy was improved in the Late vs Early timepoint, due to neurodegeneration progression. However, if only choosing connections significantly different between groups (using NBS) as features, mean classification accuracy naturally improves. In other words, edges identified as driving group differences after diagnosis could be used as features for classification in future diagnostic-blind studies.For classification based on WM microstructure, the performance using features from a biophysical model only (here WMTI-Watson) was similar to using Pooled features (WMTI-Watson + DKI) and better than only using DKI features. This suggests biophysical models have added value over empirical tensor metrics in characterizing WM degeneration and classifying subjects. Microstructural features in the fimbria played the most important roles in distinguishing STZ rats, which was consistent with the fact that hippocampus is especially vulnerable to AD20,21.
By classifying STZ rats from CTL rats using LR, we highlighted the potential of FC and WM microstructure metrics in the diagnosis of AD-related neurodegeneration, with possible translation to human studies.
Acknowledgements
The authors thank Analina Raquel Da Silva, Mario Lepore and Stefan Mitrea for assistance with animal setup and monitoring, and acknowledge access to the facilities and expertise of the CIBM Center for Biomedical Imaging, a Swiss research center of excellence founded and supported by Lausanne University Hospital (CHUV), University of Lausanne (UNIL), Ecole polytechnique fédérale de Lausanne (EPFL), University of Geneva (UNIGE) and Geneva University Hospitals (HUG).References
1. Talbot, K. et al. Demonstrated brain insulin resistance in Alzheimer’s disease patients is associated with IGF-1 resistance, IRS-1 dysregulation, and cognitive decline. J. Clin. Invest. 122, 1316–1338 (2012). 2. Knezovic, A. et al. Staging of cognitive deficits and neuropathological and ultrastructural changes in streptozotocin-induced rat model of Alzheimer’s disease. J. Neural Transm. Vienna Austria 1996 122, 577–592 (2015).
3. Kraska, A. et al. In vivo cross-sectional characterization of cerebral alterations induced by intracerebroventricular administration of streptozotocin. PloS One 7, e46196 (2012).
4. Shoham, S., Bejar, C., Kovalev, E. & Weinstock, M. Intracerebroventricular injection of streptozotocin causes neurotoxicity to myelin that contributes to spatial memory deficits in rats. Exp. Neurol. 184, 1043–1052 (2003).
5. Diao, Y., Yin, T., Gruetter, R. & Jelescu, I. O. PIRACY: An Optimized Pipeline for Functional Connectivity Analysis in the Rat Brain. Front. Neurosci. 15, (2021).
6. Veraart, J., Fieremans, E. & Novikov, D. S. Diffusion MRI noise mapping using random matrix theory: Diffusion MRI Noise Mapping. Magn. Reson. Med. 76, 1582–1593 (2016).
7. Kellner, E., Dhital, B., Kiselev, V. G. & Reisert, M. Gibbs-ringing artifact removal based on local subvoxel-shifts. Magn. Reson. Med. 76, 1574–1581 (2016).
8. Andersson, J. L. R. & Sotiropoulos, S. N. An integrated approach to correction for off-resonance effects and subject movement in diffusion MR imaging. NeuroImage 125, 1063–1078 (2016).
9. Veraart, J., Sijbers, J., Sunaert, S., Leemans, A. & Jeurissen, B. Weighted linear least squares estimation of diffusion MRI parameters: Strengths, limitations, and pitfalls. NeuroImage 81, 335–346 (2013).
10. Jespersen, S. N., Olesen, J. L., Hansen, B. & Shemesh, N. Diffusion time dependence of microstructural parameters in fixed spinal cord. NeuroImage 182, 329–342 (2018).
11. Zalesky, A., Fornito, A. & Bullmore, E. T. Network-based statistic: Identifying differences in brain networks. NeuroImage 53, 1197–1207 (2010).
12. Agosta, F. et al. Resting state fMRI in Alzheimer’s disease: beyond the default mode network. Neurobiol. Aging 33, 1564–1578 (2012).
13. Brier, M. R. et al. Loss of Intranetwork and Internetwork Resting State Functional Connections with Alzheimer’s Disease Progression. J. Neurosci. 32, 8890–8899 (2012).
14. Tristão Pereira, C. et al. Synchronous nonmonotonic changes in functional connectivity and white matter integrity in a rat model of sporadic Alzheimer’s disease. NeuroImage 225, 117498 (2021).
15. Gano, L. B., Patel, M. & Rho, J. M. Ketogenic diets, mitochondria, and neurological diseases. J. Lipid Res. 55, 2211–2228 (2014).
16. Wu, L., Zhang, X. & Zhao, L. Human ApoE Isoforms Differentially Modulate Brain Glucose and Ketone Body Metabolism: Implications for Alzheimer’s Disease Risk Reduction and Early Intervention. J. Neurosci. 38, 6665–6681 (2018).
17. Foll, C. L., Dunn-Meynell, A. A., Miziorko, H. M. & Levin, B. E. Regulation of Hypothalamic Neuronal Sensing and Food Intake by Ketone Bodies and Fatty Acids. Diabetes 63, 1259–1269 (2014).
18. Carneiro, L. et al. Evidence for hypothalamic ketone body sensing: impact on food intake and peripheral metabolic responses in mice. Am. J. Physiol.-Endocrinol. Metab. 310, E103–E115 (2016).
19. Le Foll, C. Hypothalamic Fatty Acids and Ketone Bodies Sensing and Role of FAT/CD36 in the Regulation of Food Intake. Front. Physiol. 10, 1036 (2019).
20. Mu, Y. & Gage, F. H. Adult hippocampal neurogenesis and its role in Alzheimer’s disease. Mol. Neurodegener. 6, 85 (2011).
21. Setti, S. E., Hunsberger, H. C. & Reed, M. N. Alterations in Hippocampal Activity and Alzheimer’s Disease. Transl. Issues Psychol. Sci. 3, 348–356 (2017).
Figures