1947
Peri-tumoural distribution of lipid composition in postmenopausal patients with oestrogen receptor positive breast cancer1Institute of Medical Sciences, University of Aberdeen, Aberdeen, United Kingdom, 2Donders Institute for Brain, Cognition and Behaviour, Radboud University, Nijmegen, Netherlands, 3Pathology Department, Aberdeen Royal Infirmary, Aberdeen, United Kingdom, 4Radiology Department, Royal Marsden Hospital, London, United Kingdom, 5Breast Unit, Aberdeen Royal Infirmary, Aberdeen, United Kingdom
Synopsis
Early diagnosis is crucial for the prognosis of patients with breast cancer. Postmenopausal women with oestrogen receptor positive cancer account for over half of all new diagnosis, with an imbalance of lipid composition in peri-tumoural adipose tissue. Since oestrogen is primarily modulated by mammary adipocytes, lipid composition monitoring for early sign of heterogeneous lipid deregulation is central to the accurate early detection. Novel chemical shift-encoded imaging (CSEI) allows rapid lipid mapping of whole breast. We set out to elucidate the spatial distribution in the deregulation of peri-tumoural lipid composition in postmenopausal patients with oestrogen receptor positive breast cancer using CSEI.
Introduction
Breast cancer is the most common cancer among women, with age-adjusted annual incidence of 205 per 100,0001. Postmenopausal women with oestrogen receptor positive (ER+) cancer account for over half of all new diagnosis2. Oestrogen is primarily modulated by mammary adipocytes3, and an imbalance of monounsaturated, polyunsaturated and saturated fatty acids (MUFA, PUFA, SFA) has been shown in peri-tumoural adipose tissue4, 5. The heterogeneity in tumour growth leads to initial heterogeneous lipid deregulation6, crucial for early detection and monitoring since patients with ER+ breast cancer respond well to cancer hormonal therapy. We therefore hypothesise that there is a difference in the spatial distribution of lipid composition in peri-tumoural region in patients against whole breast of healthy controls.Methods
Twelve postmenopausal patients (range 53 – 71 years) with ER+, invasive ductal carcinoma and 13 age-matched healthy controls participated in the study. Patients undergoing breast conservation surgery, with no previous malignancies, chemotherapy or radiotherapy prior to surgery were eligible. The study was approved by the North of Scotland Research Ethics Services (REC Reference: 16/NS/0077), and written informed consents were obtained from all the participants (Figure 1).Clinical Procedure
Standard clinical histopathological examination was performed on patients to determine histological tumour size and grade. Immunostaining was conducted in a single batch for tumour cellular proliferative marker Ki-677 and pro-inflammatory marker tumour-associated macrophage CD1638 with positive controls.
Lipid Composition Mapping
All images were acquired on a 3 T whole-body clinical MRI scanner (Achieva TX, Philips Healthcare, Best, Netherlands). Lipid composition images were acquired from one breast (diseased breast in patients and left breast in healthy controls) using a 2D CSEI sequence9, 10 with 174 echoes, initial echo time of 1.14 ms, echo spacing of 1.14 ms, repetition time of 200 ms, flip angle of 15°, reconstruction matrix of 64 × 64, reconstruction voxel size of 3.75 × 3.75 mm and slice thickness of 4 mm.
Data Processing
Image analysis was conducted in MATLAB (R2020a, MathWorks Inc., Natick, MA, USA) and ImageJ (v1.52p, NIH, Bethesda, MD, USA). The maps of the number of double bonds in triglycerides were computed from raw data, before subsequent calculation of quantitative maps of MUFA, PUFA and SFA as a percentage of the total amount of lipids9, 10. The boundary of tumour was delineated on the first echo of lipid composition images, with reference to anatomical and diffusion weighted images. Peri-tumoural region was defined as growth of 15mm (4 voxels) surrounding the tumour boundary (Peri-P). Whole breast was defined to contain only adipose and fibroglandular tissue in controls (WB-C), and excluding tumour in patients (WB-P). Chest cavity and subcutaneous fat were removed from image analysis in all participants. Adipose voxels with lipid signal over 60% of total signal were extracted from lipid composition maps for histogram analysis. The spatial distributions (mean, skewness, entropy and kurtosis11, 12) were subsequently computed based on histogram distribution for each lipid constituent.
Statistical Analysis
All statistical analysis was performed in the R software (v3.6.3, R Foundation for Statistical Computing, Vienna, Austria). Wilcoxon signed rank paired tests were performed for Peri-P against WB-P. Wilcoxon signed rank tests were performed for Peri-P against WB-C, and WB-P against WB-C. Spearman’s rank correlation tests were performed for each lipid constituent in peri-tumoural region against proliferative activity marker Ki-67 and tumour-associated macrophage CD163. Statistical significant difference was determined by p < 0.05.
Results
The histopathological findings of the patient cohort are shown in Table 1.Peri-P vs WB-P
For MUFA, there was a significantly lower mean (p=0.0004), higher skewness (p=0.001), higher entropy (p=0.007), and a lower kurtosis (p=0.001) in peri-tumoural region (Figure 2, Table 2). For PUFA, there was a significantly lower mean (p=0.0003), higher skewness (p=0.005), lower entropy (p=0.002) in peri-tumoural region, but not in kurtosis. For SFA, there was a significantly higher mean (p=0.0002), lower skewness (p=0.005), lower entropy (p=0.012) in peri-tumoural region, but not in kurtosis.
Peri-P vs WB-C
There were significantly higher MUFA skewness (p=0.011) and lower MUFA kurtosis (p=0.009) in peri-tumoural region (Figure 2, Table 2).
WB-P vs WB-C
There were no significant differences in mean, skewness, entropy and kurtosis of all lipid constituents (Figure 2, Table 2).
Association with pathological markers
There was a significant correlation in PUFA entropy (ρ=0.63, p=0.028) and SFA skewness (ρ=0.59, p=0.045) in Peri-P against CD163 (Figure 3, Table 2). There were no significant correlations in lipid constituents in Peri-P against Ki-67 (Table 2).
Discussion
There was heterogeneous lipid deregulation in peri-tumoural region subsequent to heterogeneity in tumour growth. The spatial measures showed elevated sensitivity than means, and might offer a more accurate early detection tool for the screening of postmenopausal women especially those undertaking hormone replacement therapy (HRT). However, the cohort size is small and further studies are warranted to unravel lipid deregulation and subsequent treatment induced normalisation in postmenopausal patients with ER+ cancer receiving cancer hormonal therapy.Conclusion
There was aberrant spatial distribution of lipid composition in peri-tumoural adipose tissue in postmenopausal patients with ER+ invasive ductal carcinoma, with potential association with pro-inflammatory activity.Acknowledgements
The authors would like to thank Dr Matthew Clemence (Philips Healthcare Clinical Science, UK) for clinical scientist support, Ms Angela Allan and Ms Vera Herd for nurse support, Ms Shona Davidson, Ms Linda Lett, Ms Louisa Pirie, Ms Fiona Geddes, Ms Kate Shaw, Ms Sheila Ingram for patient recruitment support, Ms Kim Blake, Ms Shona Stuart, Ms Brenda Still, Ms Dawn Younie for logistic support, and Ms Beverly MacLennan, Ms Nichola Crouch, Ms Laura Reid and Mr Mike Hendry for radiographer support. The authors would also like to thank Ms Mairi Fuller, Mr Dionysios Koufoudakis, Ms Elizabeth Smyth and Ms Beatrix Elsberger for providing access to the patients. This project was funded by Friends of Aberdeen and North Centre for Haematology, Oncology and Radiotherapy (ANCHOR). Sai Man Cheung’s PhD study was jointly supported by Elphinstone scholarship, Roland Sutton Academic Trust and John Mallard scholarship and is currently funded by Cancer Research UK.References
1. Smittenaar CR, Petersen KA, Stewart K, Moitt N. Cancer incidence and mortality projections in the UK until 2035. Br J Cancer. 2016;115(9):1147-55.
2. Lifetime risk estimates calculated by the Statistical Information Team at Cancer Research UK, based on Office for National Statistics (ONS) 2016-based Life expectancies and population projections. London: CRUK; 2020. Available from: https://www.cancerresearchuk.org/health-professional/cancer-statistics/risk/lifetime-risk#heading-One. [Accessed 12th October 2020]
3. Brown KA. Impact of obesity on mammary gland inflammation and local estrogen production. J Mammary Gland Biol Neoplasia. 2014;19(2):183-9.
4. Freed M, Storey P, Lewin AA, et al. Evaluation of Breast Lipid Composition in Patients with Benign Tissue and Cancer by Using Multiple Gradient-Echo MR Imaging. Radiology. 2016;281(1):43-53.
5. Lewin AA, Storey P, Moccaldi M, Moy L, Gene Kim S. Fatty acid composition in mammary adipose tissue measured by Gradient-echo Spectroscopic MRI and its association with breast cancers. Eur J Radiol. 2019;116:205-11.
6. Balaban S, Lee LS, Varney B, et al. Heterogeneity of fatty acid metabolism in breast cancer cells underlies differential sensitivity to palmitate-induced apoptosis. Mol Oncol. 2018;12(9):1623-38.
7. Tuominen VJ, Ruotoistenmäki S, Viitanen A, Jumppanen M, Isola J. ImmunoRatio: a publicly available web application for quantitative image analysis of estrogen receptor (ER), progesterone receptor (PR), and Ki-67. Breast Cancer Res. 2010;12(4):R56.
8. Ramos RN, Rodriguez C, Hubert M, et al. CD163(+) tumor-associated macrophage accumulation in breast cancer patients reflects both local differentiation signals and systemic skewing of monocytes. Clin Transl Immunology. 2020;9(2):e1108.
9. Bydder M, Girard O, Hamilton G. Mapping the double bonds in triglycerides. Magn Reson Imaging. 2011;29(8):1041-6.
10. Peterson P, Månsson S. Simultaneous quantification of fat content and fatty acid composition using MR imaging. Magn Reson Med. 2013;69(3):688-97.
11. Just N. Improving tumour heterogeneity MRI assessment with histograms. Br J Cancer. 2014;111(12):2205-13.
12. Kim JH, Ko ES, Lim Y, et al. Breast Cancer Heterogeneity: MR Imaging Texture Analysis and Survival Outcomes. Radiology. 2017;282(3):665-75.
Figures
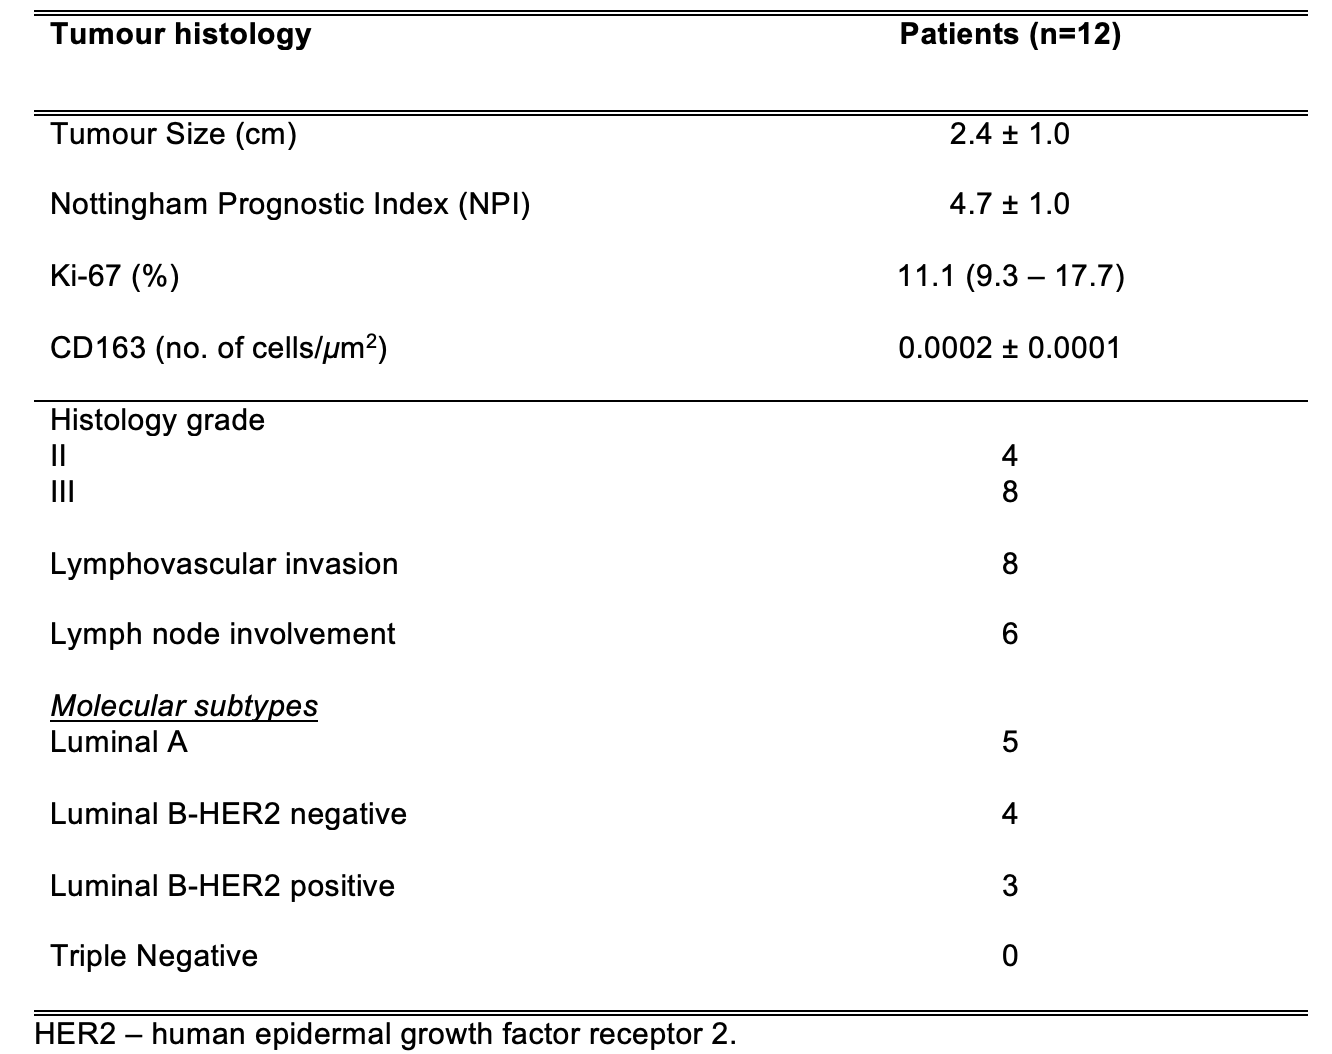
Table 1. Tumour histology in the cancer patient group
Histopathological findings for patients with breast cancer are shown, with quantitative entries expressed as mean and standard deviation (mean ± SD) or median (interquartile range) and qualitative entries expressed as number of positive observations.
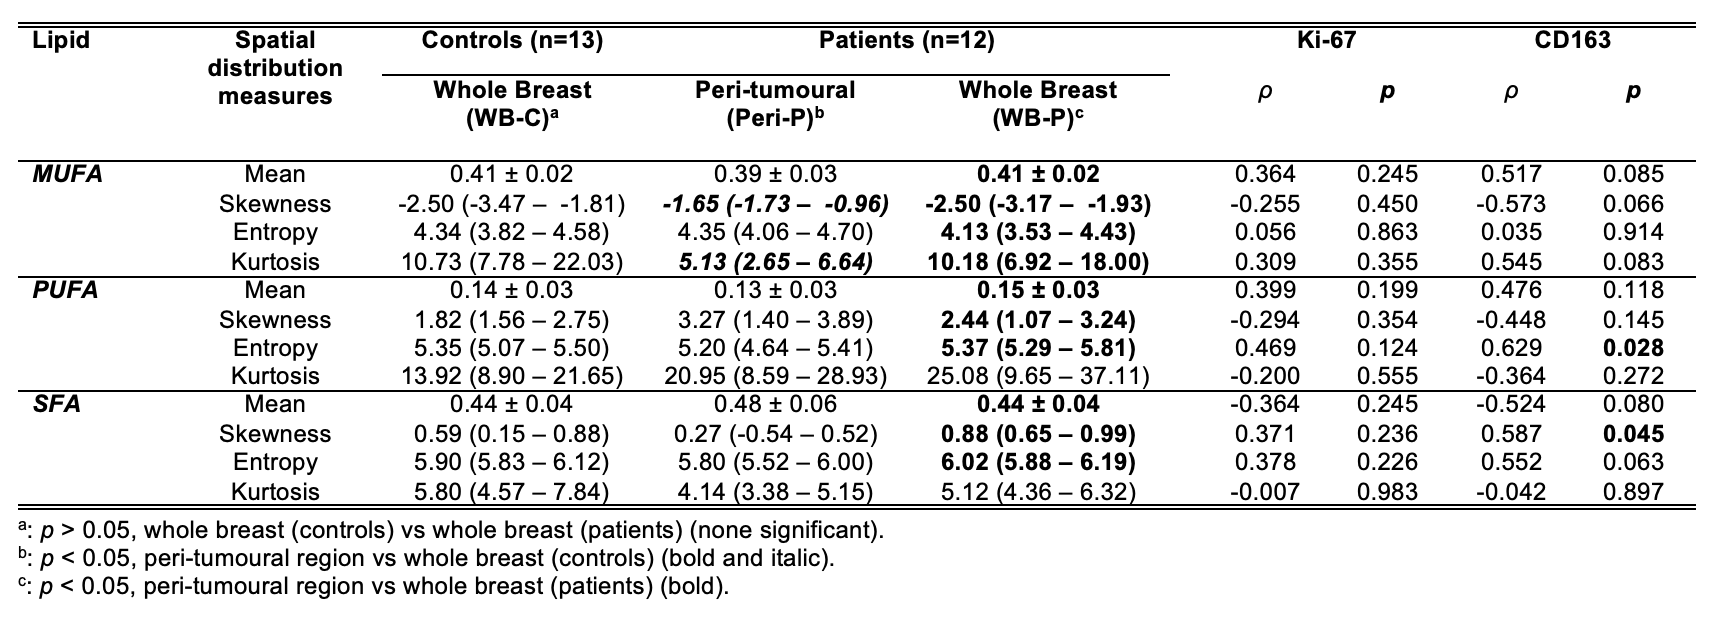
Table 2. Lipid composition measurements.
Peri-tumoural and whole breast monounsaturated, polyunsaturated and saturated fatty acids (MUFA, PUFA, SFA) mean, skewness, entropy and kurtosis were compared between patients and healthy controls. The Spearman’s rank correlation coefficients (ρ) between lipid constituents against proliferative activity marker Ki-67 and tumour-associated macrophage CD163 are also shown. Statistical significant differences (p < 0.05) are marked in bold.

Figure 1. Study design.
Eighteen postmenopausal patients with ER+ positive, invasive ductal carcinoma and 21 age-matched healthy controls were eligible at initial screening and were consented into the study. All patients and controls underwent chemical shift-encoded imaging on a clinical 3 T MRI scanner. Fat mapping image analysis was conducted to compute spatial distribution of lipid constituents in peri-tumoural region (Peri-P), whole breast of patients and controls (WB-P, WB-C). Independent or paired statistical tests were subsequently performed between the locations.
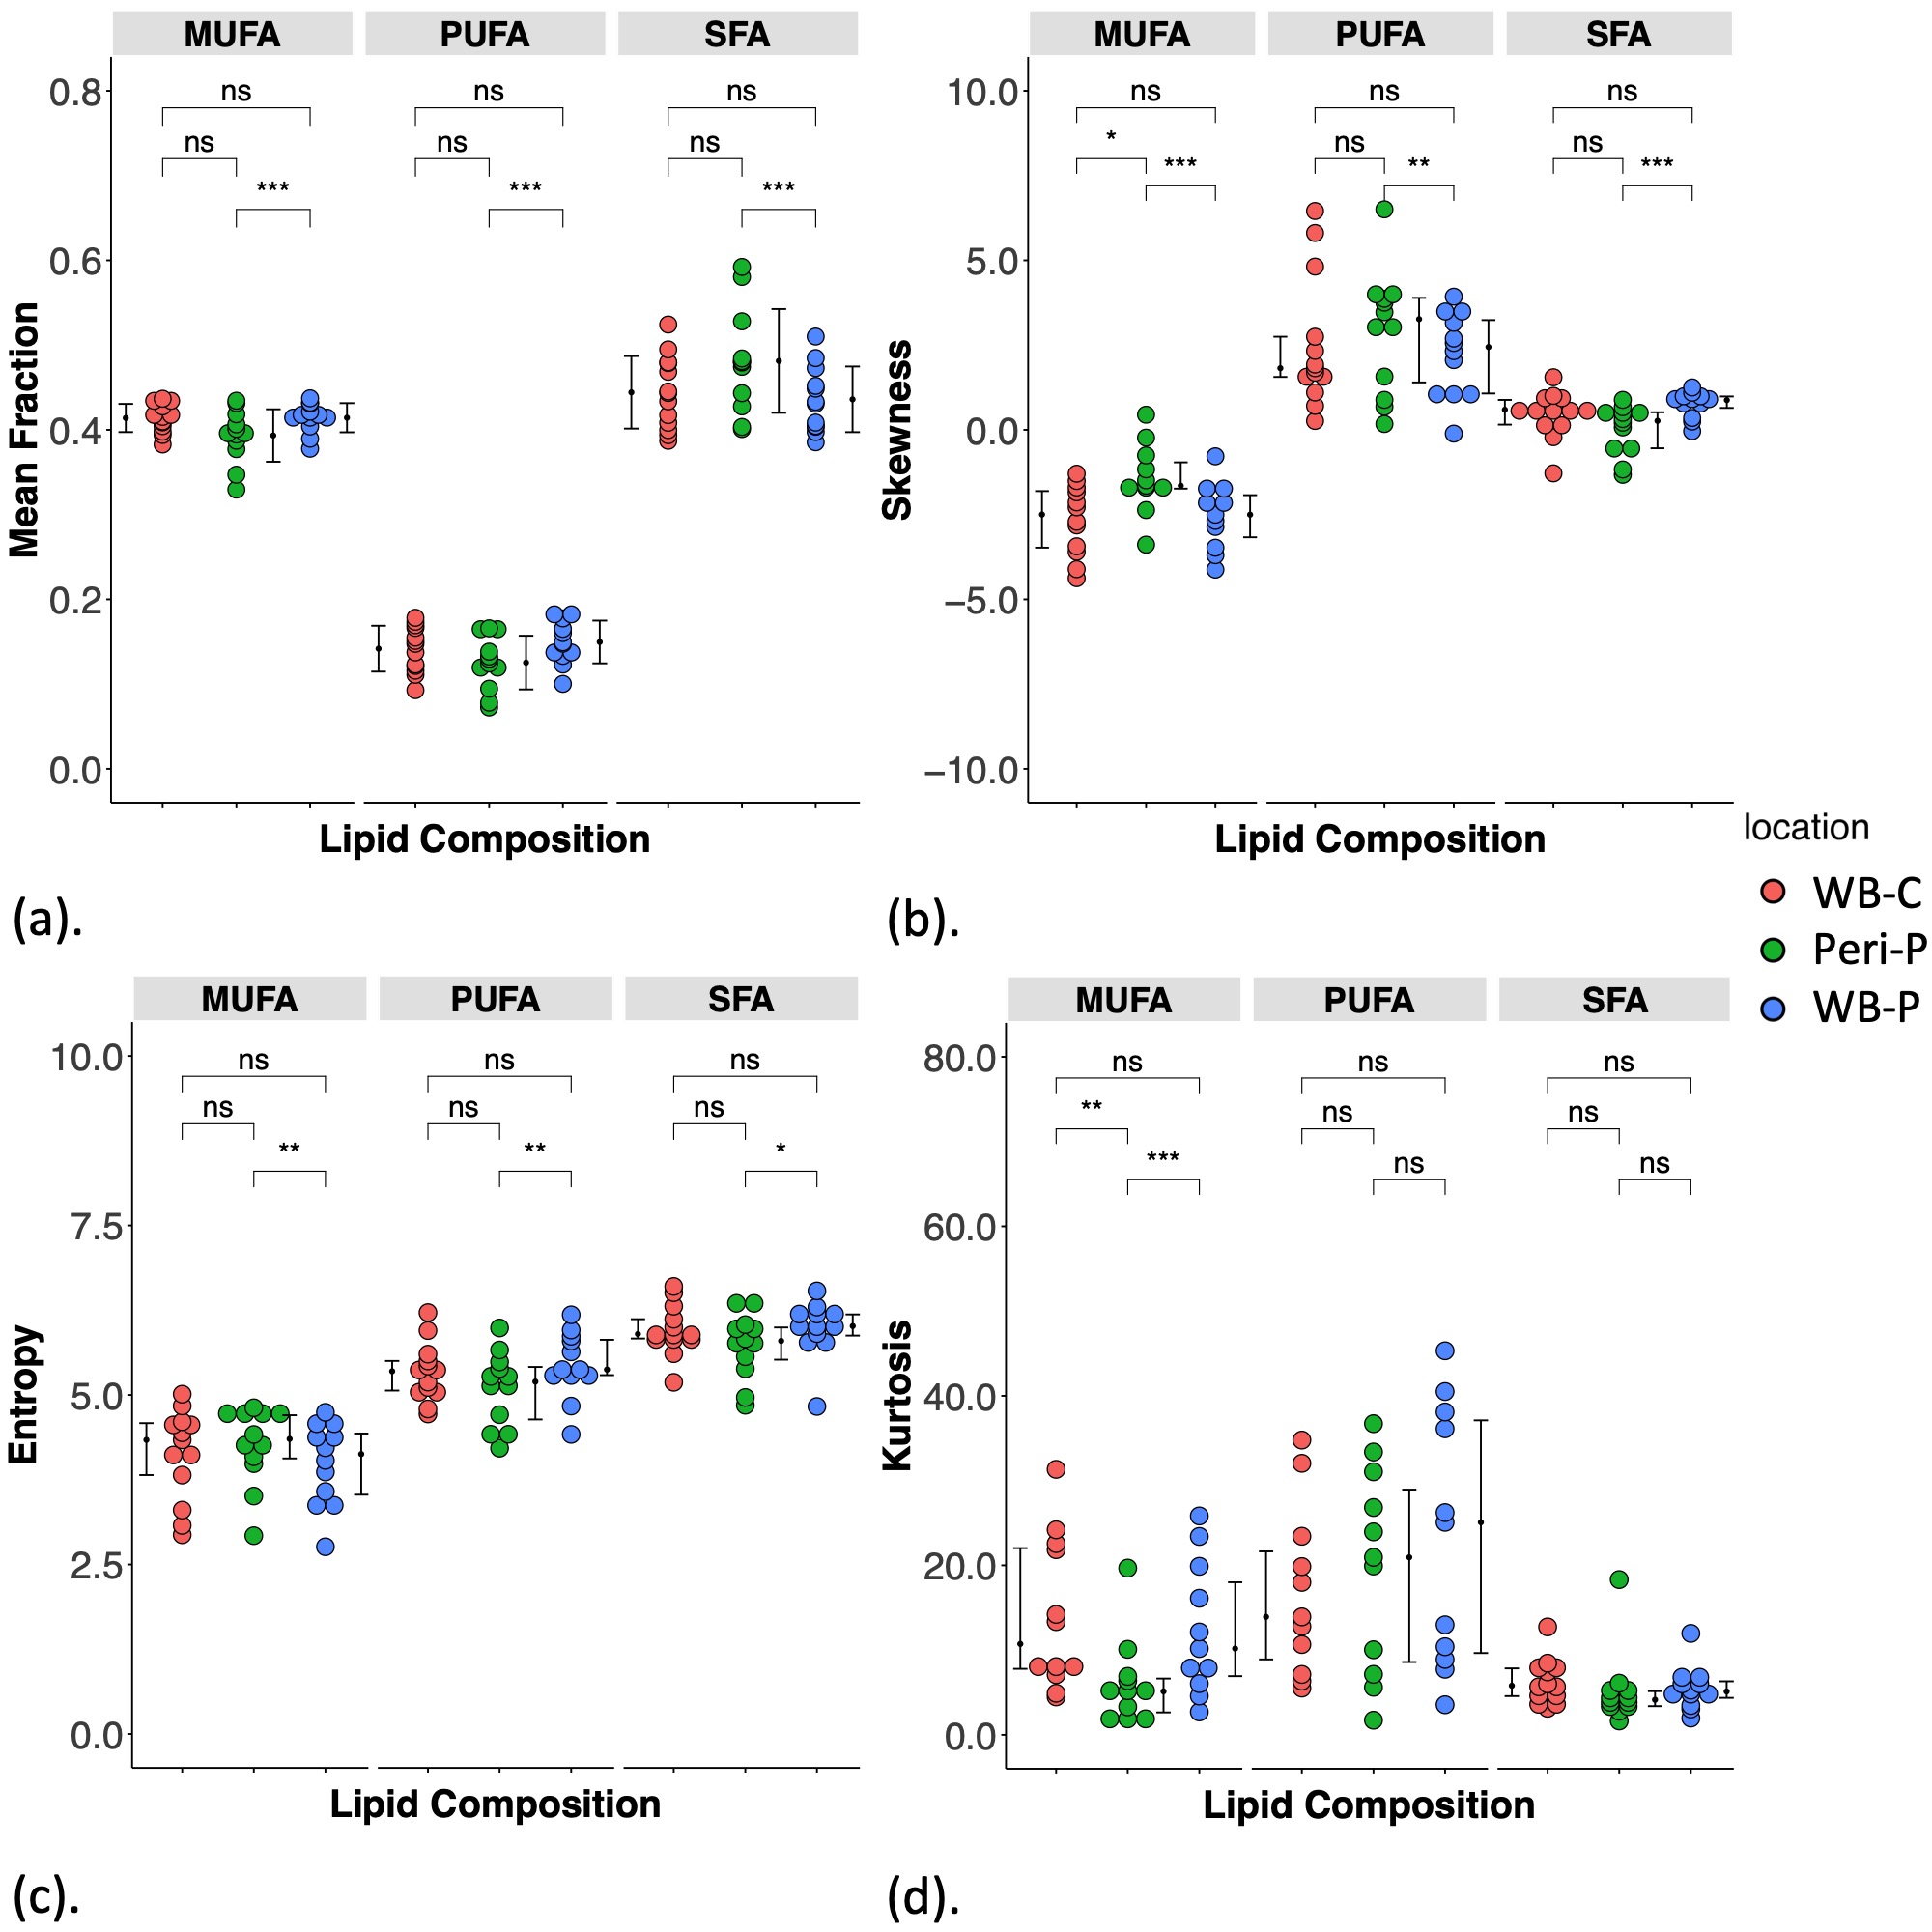
Figure 2. Group differences in lipid composition measurements.
The group difference in (a) Mean, (b) Skewness, (c) Entropy and (d) Kurtosis of MUFA, PUFA, SFA in whole breast of controls (WB-C), peri-tumoural region (Peri-P) and whole breast of patients (WB-P). Each dot represents a peri-tumoural or whole breast mean fraction or spatial distribution, and the dots are organised in three columns corresponding to locations. Error bars indicate the median (interquartile range). Statistical significant p values are marked by ‘*’ (< 0.05), ‘**’ (< 0.01), ‘***’ (< 0.001).
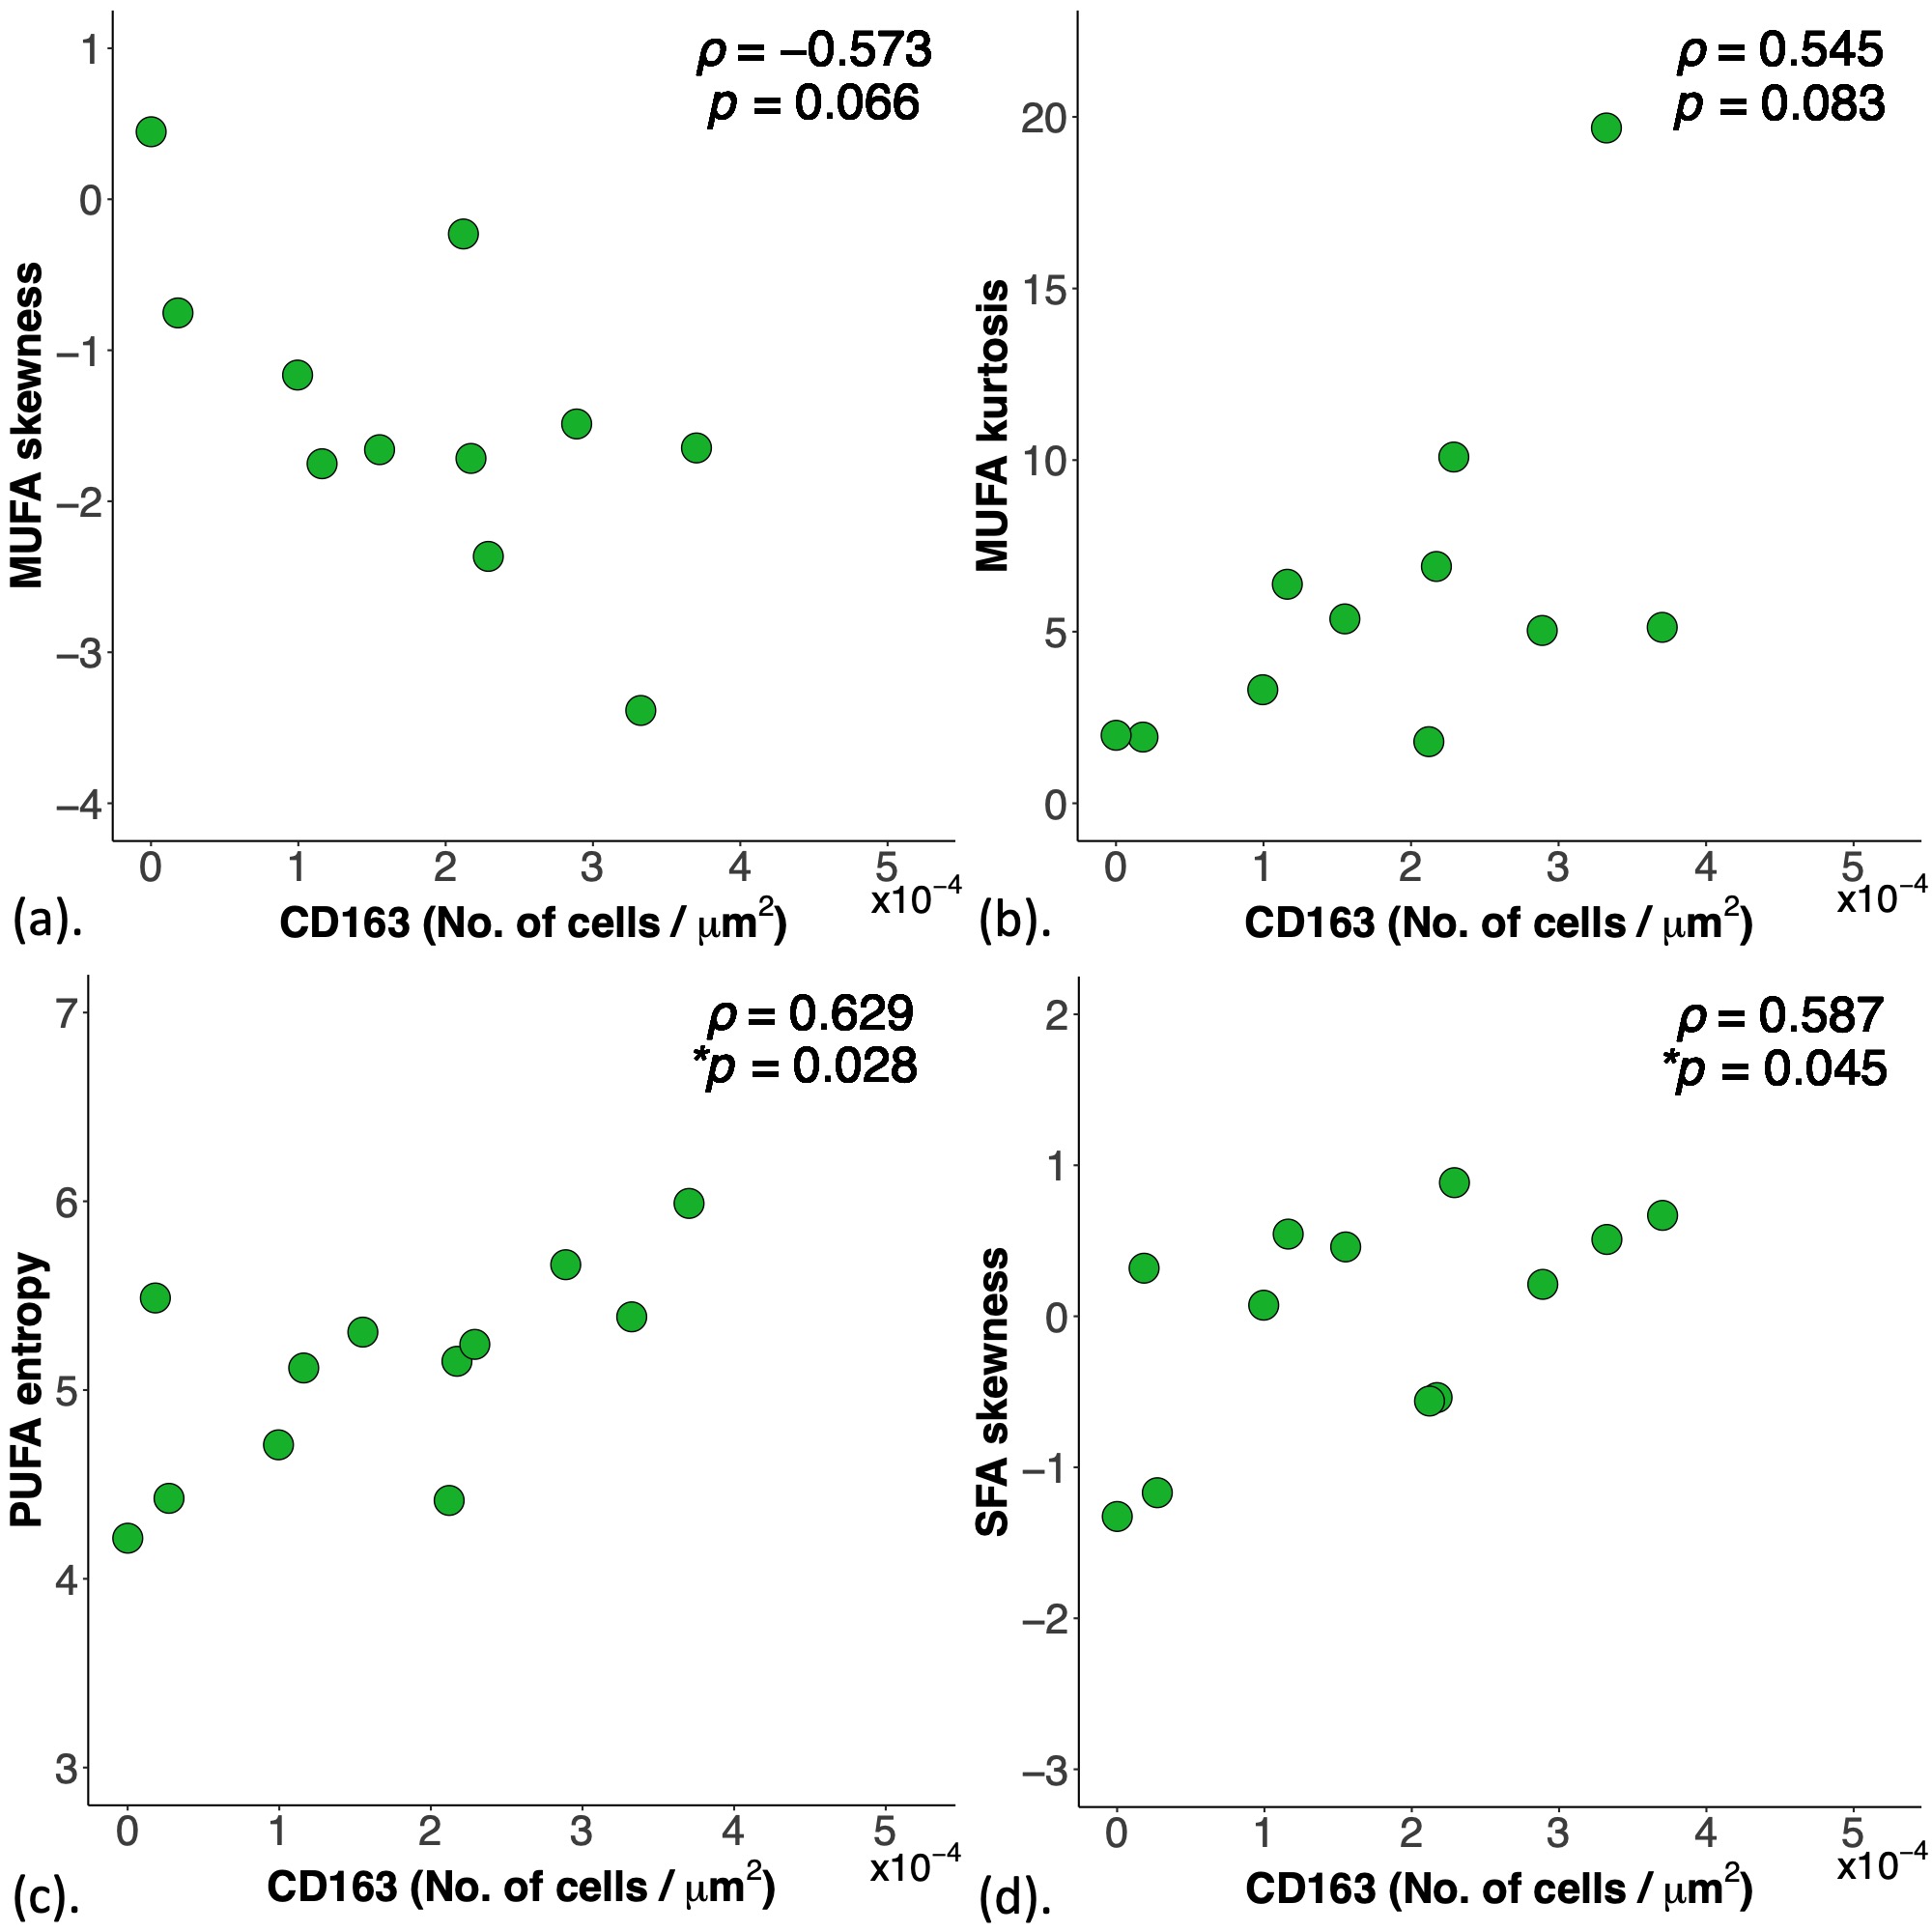
Figure 3. Correlations of lipid composition measurements in peri-tumoural region with pro-inflammatory marker tumour-associated macrophage CD163.
The correlation of (a) MUFA skewness (n=12), (b) MUFA kurtosis (n=12), (c) PUFA entropy (n=12) and (d) SFA skewness (n=12) against tumour-associated macrophage CD163 are shown in scatter plots. Spearman’s rank correlation coefficient (rho (ρ)) was used for correlation analysis and respective ρ score and p value is shown for each plot. Statistical significant p values (< 0.05) are marked by ‘*’.