1946
The primate corpus callosum - Age-related differences in morphology and microstructure1Functional Imaging Laboratory, German Primate Center, Göttingen, Germany, 2Georg-August-University Göttingen, Göttingen, Germany
Synopsis
Aging of the brain has been associated with several structural and functional changes, including tissue volume loss, white matter integrity loss, and changes in iron concentration. However, the fundamental mechanism driving these changes and their significance in the development of age-related neurodegenerative diseases are still not very well understood. Due to their unequivocal similarity with humans, non-human primates may be of particular value to further explore these mechanisms. In this study, we looked at age-related morphological, tissue microstructural, and iron-concentration changes in the corpus callosum of macaques and marmosets.
Introduction
Brain aging is a complex process in which the brain undergoes several biological changes, including tissue volume loss, white matter tissue integrity changes, and iron deposition 1–3. The close similarity of non-human primates (NHPs) to humans and their - compared to rodents - longer lifespan (macaques 25 – 30 years, marmosets up to 16 years) make them a most valuable model for studying aging in humans 4–6. The utilization of multiple MRI contrasts, including T1-weighted (T1w), magnetization transfer, magnetic susceptibility, and diffusion MRI may provide us with really new insights into the many facets of brain aging 7. However, only a few studies have used multiple MRI contrasts simultaneously to target morphometric and microstructural changes of the aging brain. In this study, we used the multi-contrast MRI approach to explore age-related alterations of the corpus callosum (cc) in healthy macaques and marmosets.Methods
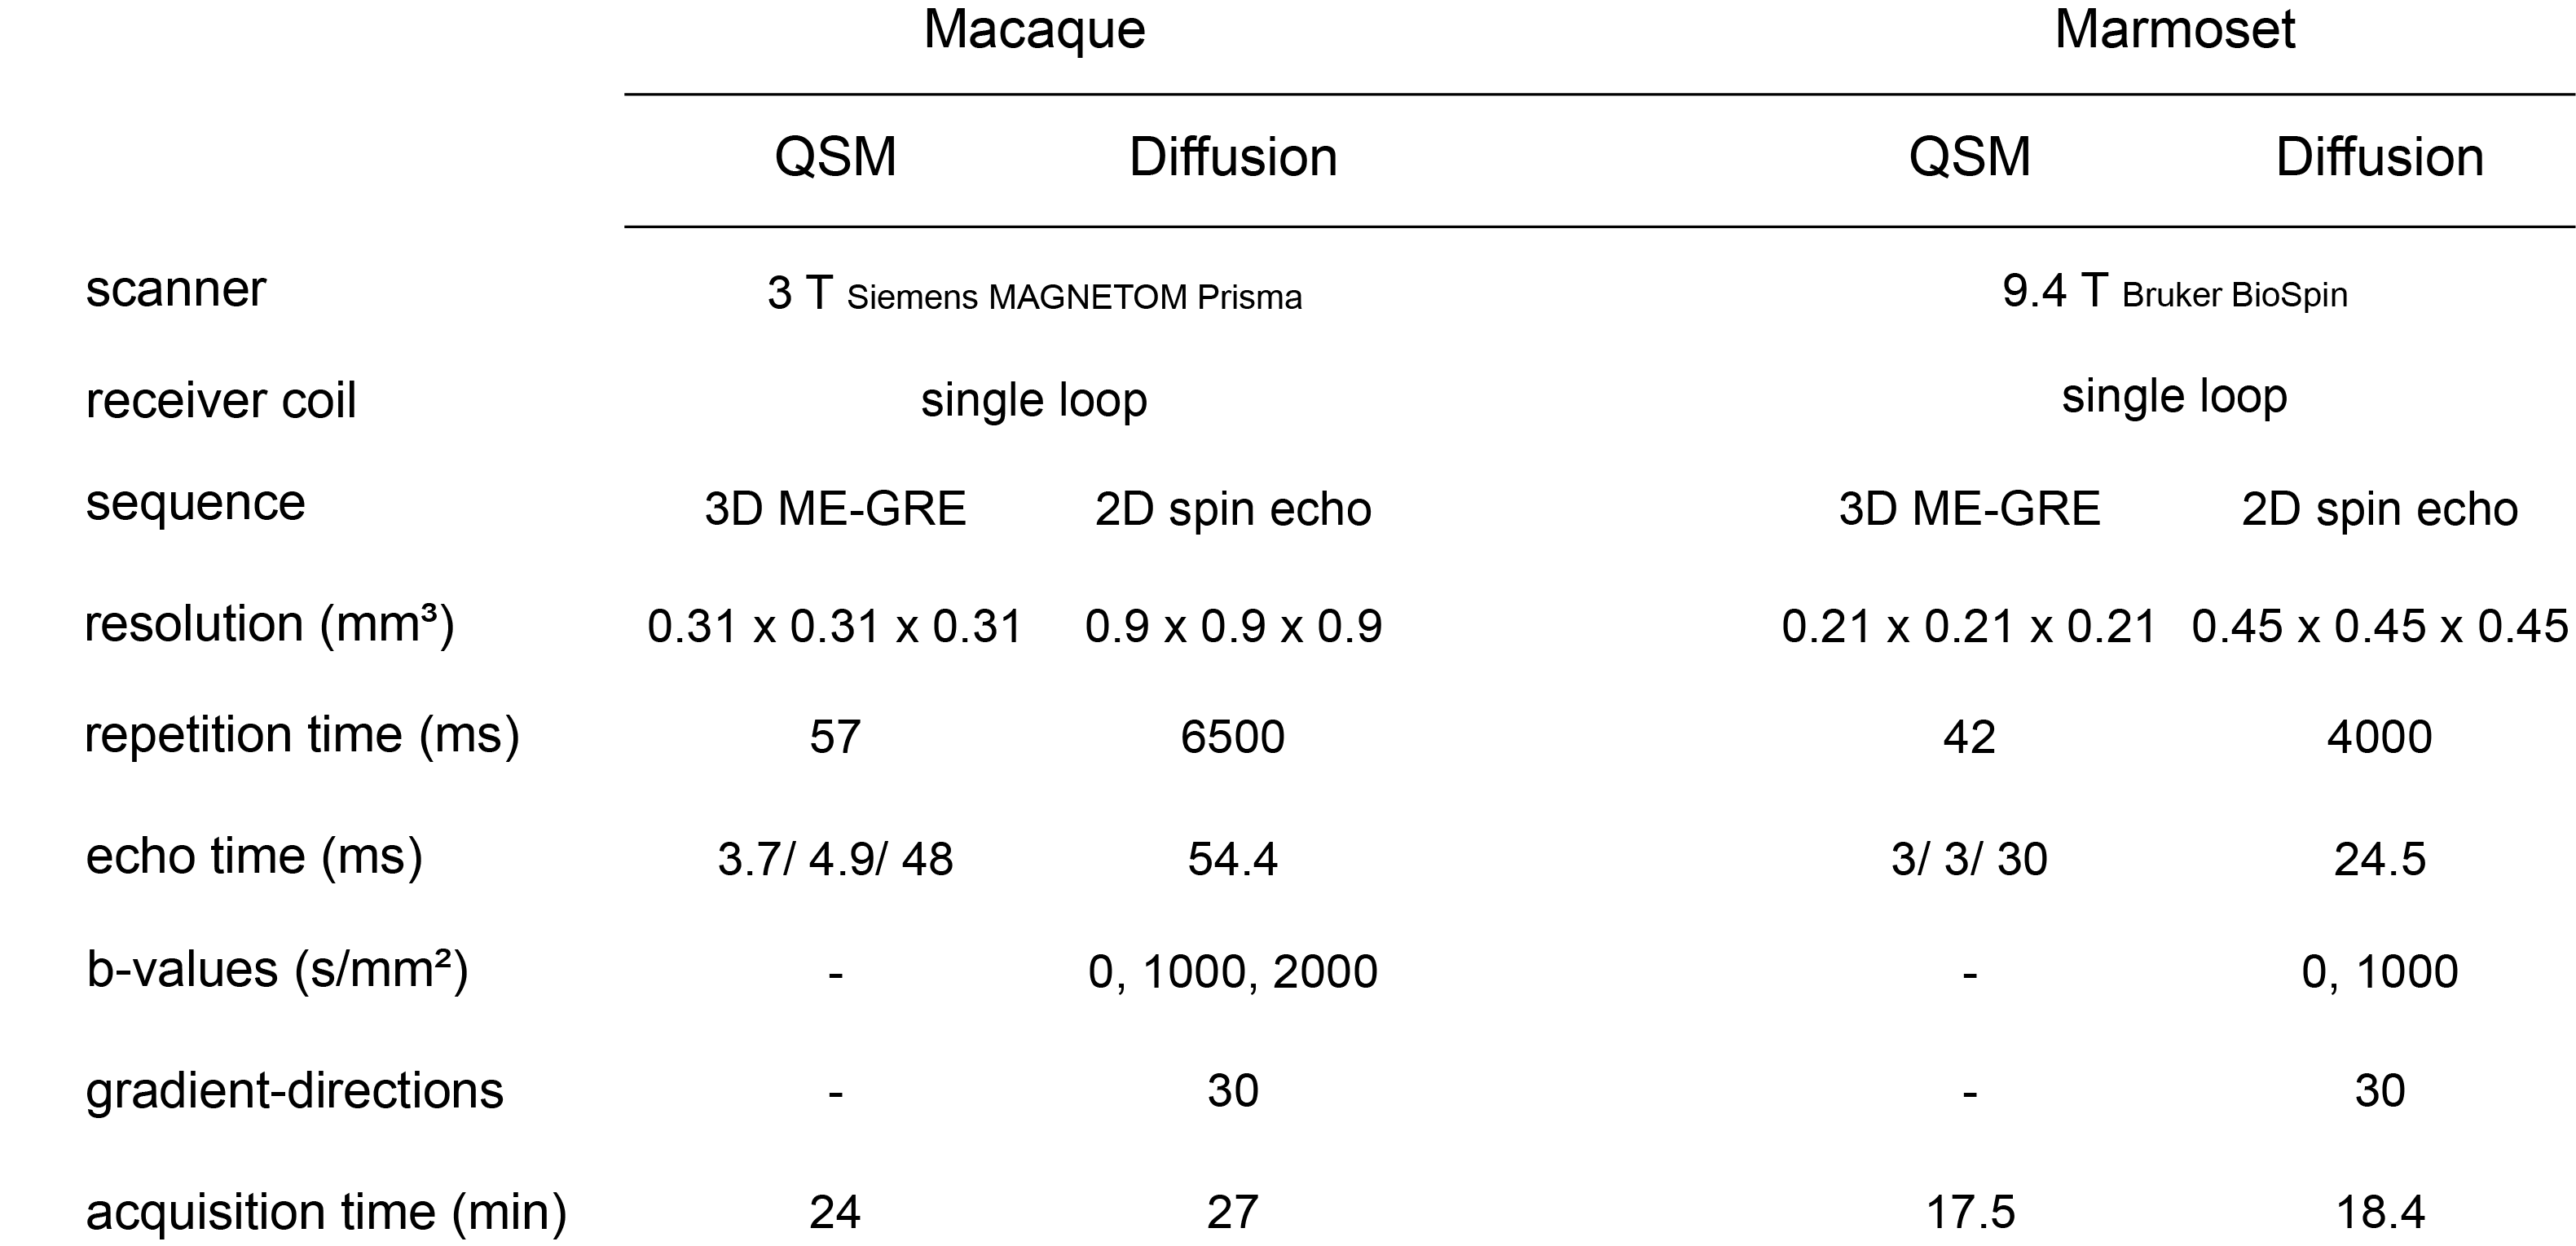
Subjects: 14 healthy female Cynomolgus macaques (Macaca fascicularis) and 34 healthy marmosets (Callithrix jacchus) were included in the study. The macaques were divided into two groups. Group 1 contains five monkeys at the age of 7-8 years. Group 2 contains nine monkeys at the age of 15-18 years. The marmosets were divided into 4 groups, comprising monkeys with an age of 2-3 (N = 8), 4-6 (N = 7), 7-10 (N = 10), and 12 – 15 (N = 9) years.Data Acquisition: Macaques: MRI data acquisitions were carried out at 3 T (MAGNETOM Prisma, Siemens). T1w images were obtained using 3D MPRAGE (TE=2.7 ms, TR=2700 ms, FA=8°, spatial resolution=0.5x0.5x0.5 mm3, and total acquisition time=14.3 min). The magnetization transfer-weighted (MTw) images, proton density-weighted images, and T1w images were acquired using 3D FLASH (TE = [3.2, 3.2, 3.2] ms, TR = [30, 25, 10] ms, FA = [5 °, 5 °, 15 °], spatial resolution = 0.5 x 0.5 x 0.5 mm3, and total acquisition time of 15.3, 6.3, and 5.1 minutes). Acquisition parameters for QSM (multi-echo gradient echo, ME-GE) and diffusion-weighted images (spin echo) are shown in Figure 1.
Marmosets: Acquisitions were carried out at 9.4 T (Bruker BioSpinTM). The MTw, PDw, and T1w images were acquired using 3D FLASH (TE = [3.8, 3.8, 3.8] ms, TR = [16.1, 16.1, 15] ms, FA = [5 °, 5 °, 25 °], spatial resolution = 0.21 x 0.21 x 0.21 mm3, and total acquisition time = [17.3, 17.3, 16.1] minutes).
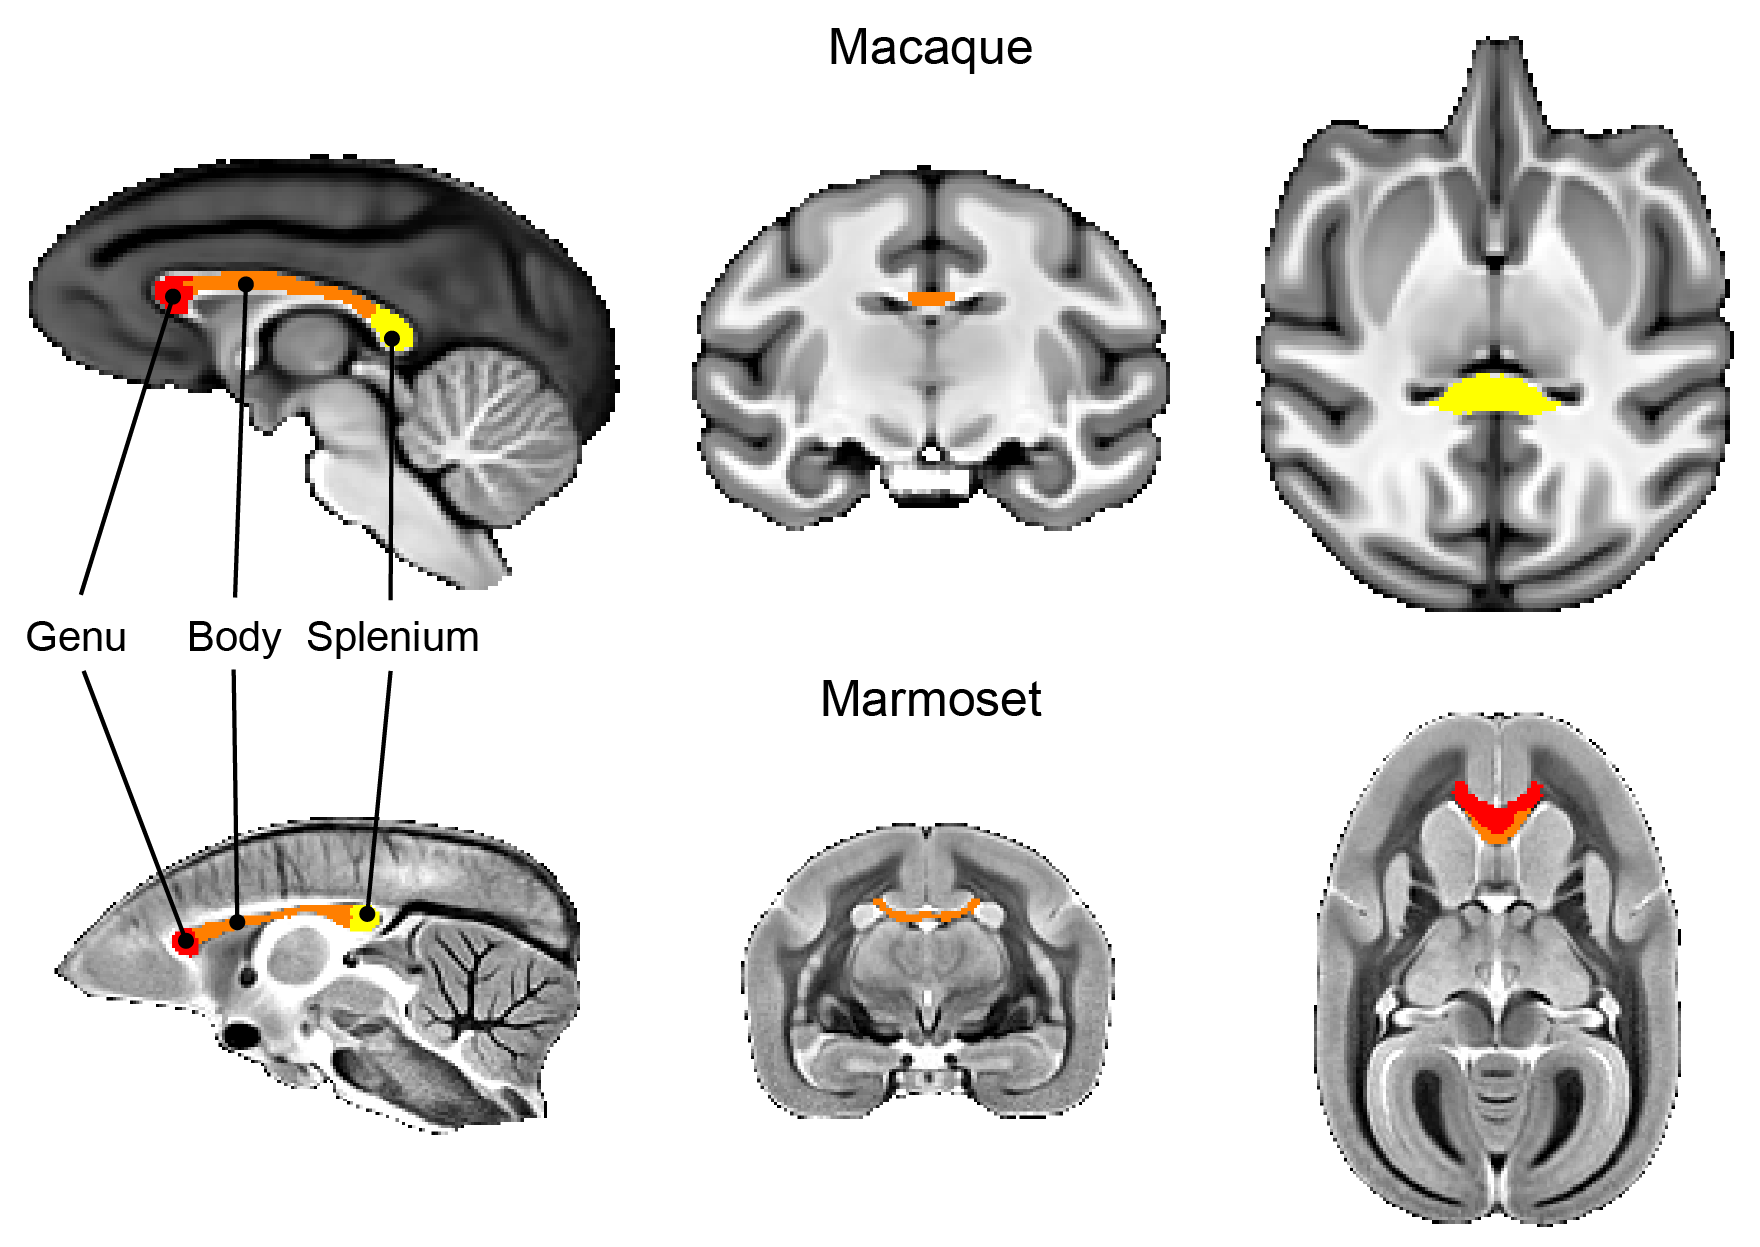
Data analysis: Using ITK-SNAP, brain masks were manually created based on T1w (macaques) and MTw images (marmosets). Single-subject images were affinely registered to the T1w image (macaque) and the MTw (marmoset) of the same subject. All subjects’ T1w (macaques) and MTw (marmosets) images were non-linearly aligned to create average brain templates 8. The macaque template was registered to the DPZCYNO templates 9, and marmoset templates were registered to the MBM template 10 to extract regions-of-interest (ROIs) within the cc (Figure 2). For quantitative analysis, all ROIs were transferred into the subject’s native space. Diffusion ROIs were manually drawn for both macaques and marmosets in the subject space.
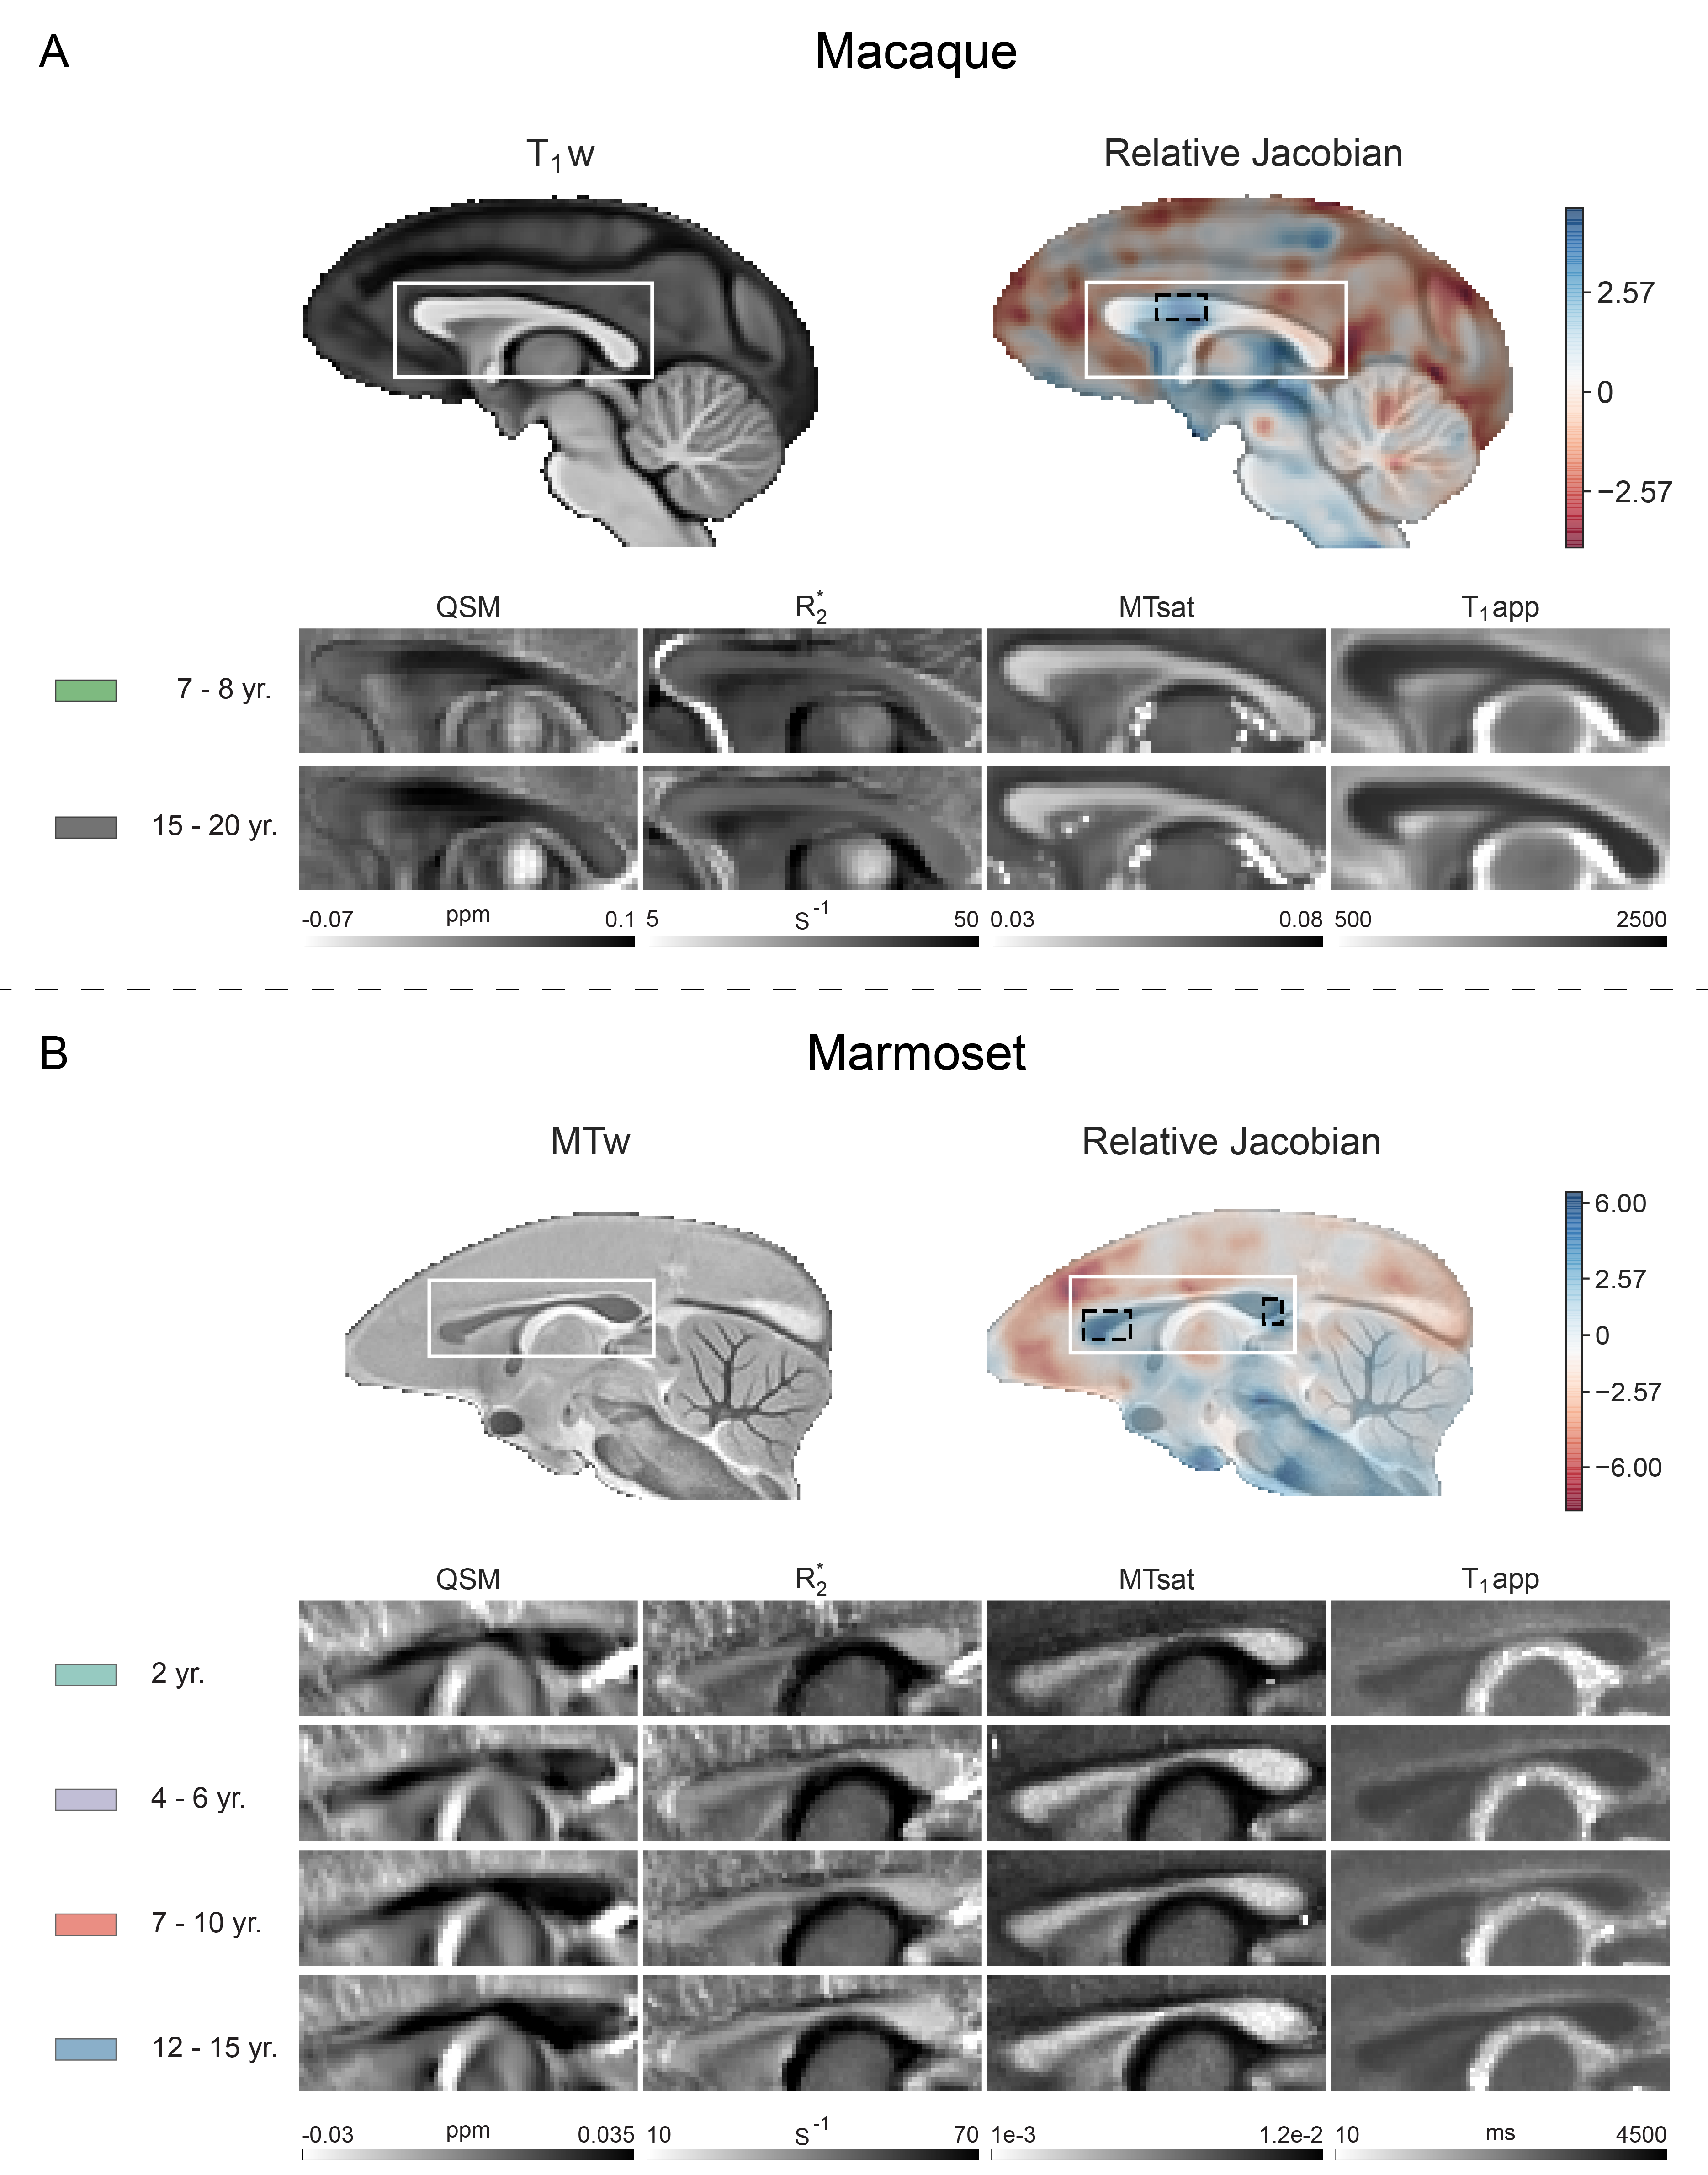
The Jacobian determinant maps were calculated using the nonlinear warp fields produced during average template generation and smoothed with a 3D Gaussian kernel (FWHM 0.42 mm). Global linear deformations were eliminated. ME-GRE magnitude and phase images were used to calculate R2* and QSM maps 11,12. Magnetization transfer saturation (MTsat) and apparent longitudinal relaxation time (T1app) maps were estimated using the method described by Helms et al. (https://github.com/RDadarwal/MTsat-MRI) 13. The pipeline provided at https://github.com/RDadarwal/Diffusion-MRI was used to analyze diffusion MRI data. Statistical analyses comprised two-sided t-tests, Bonferroni-corrected for multiple comparisons (3 ROIs) were used for macaques while one-way ANOVA tests for marmosets.
Results
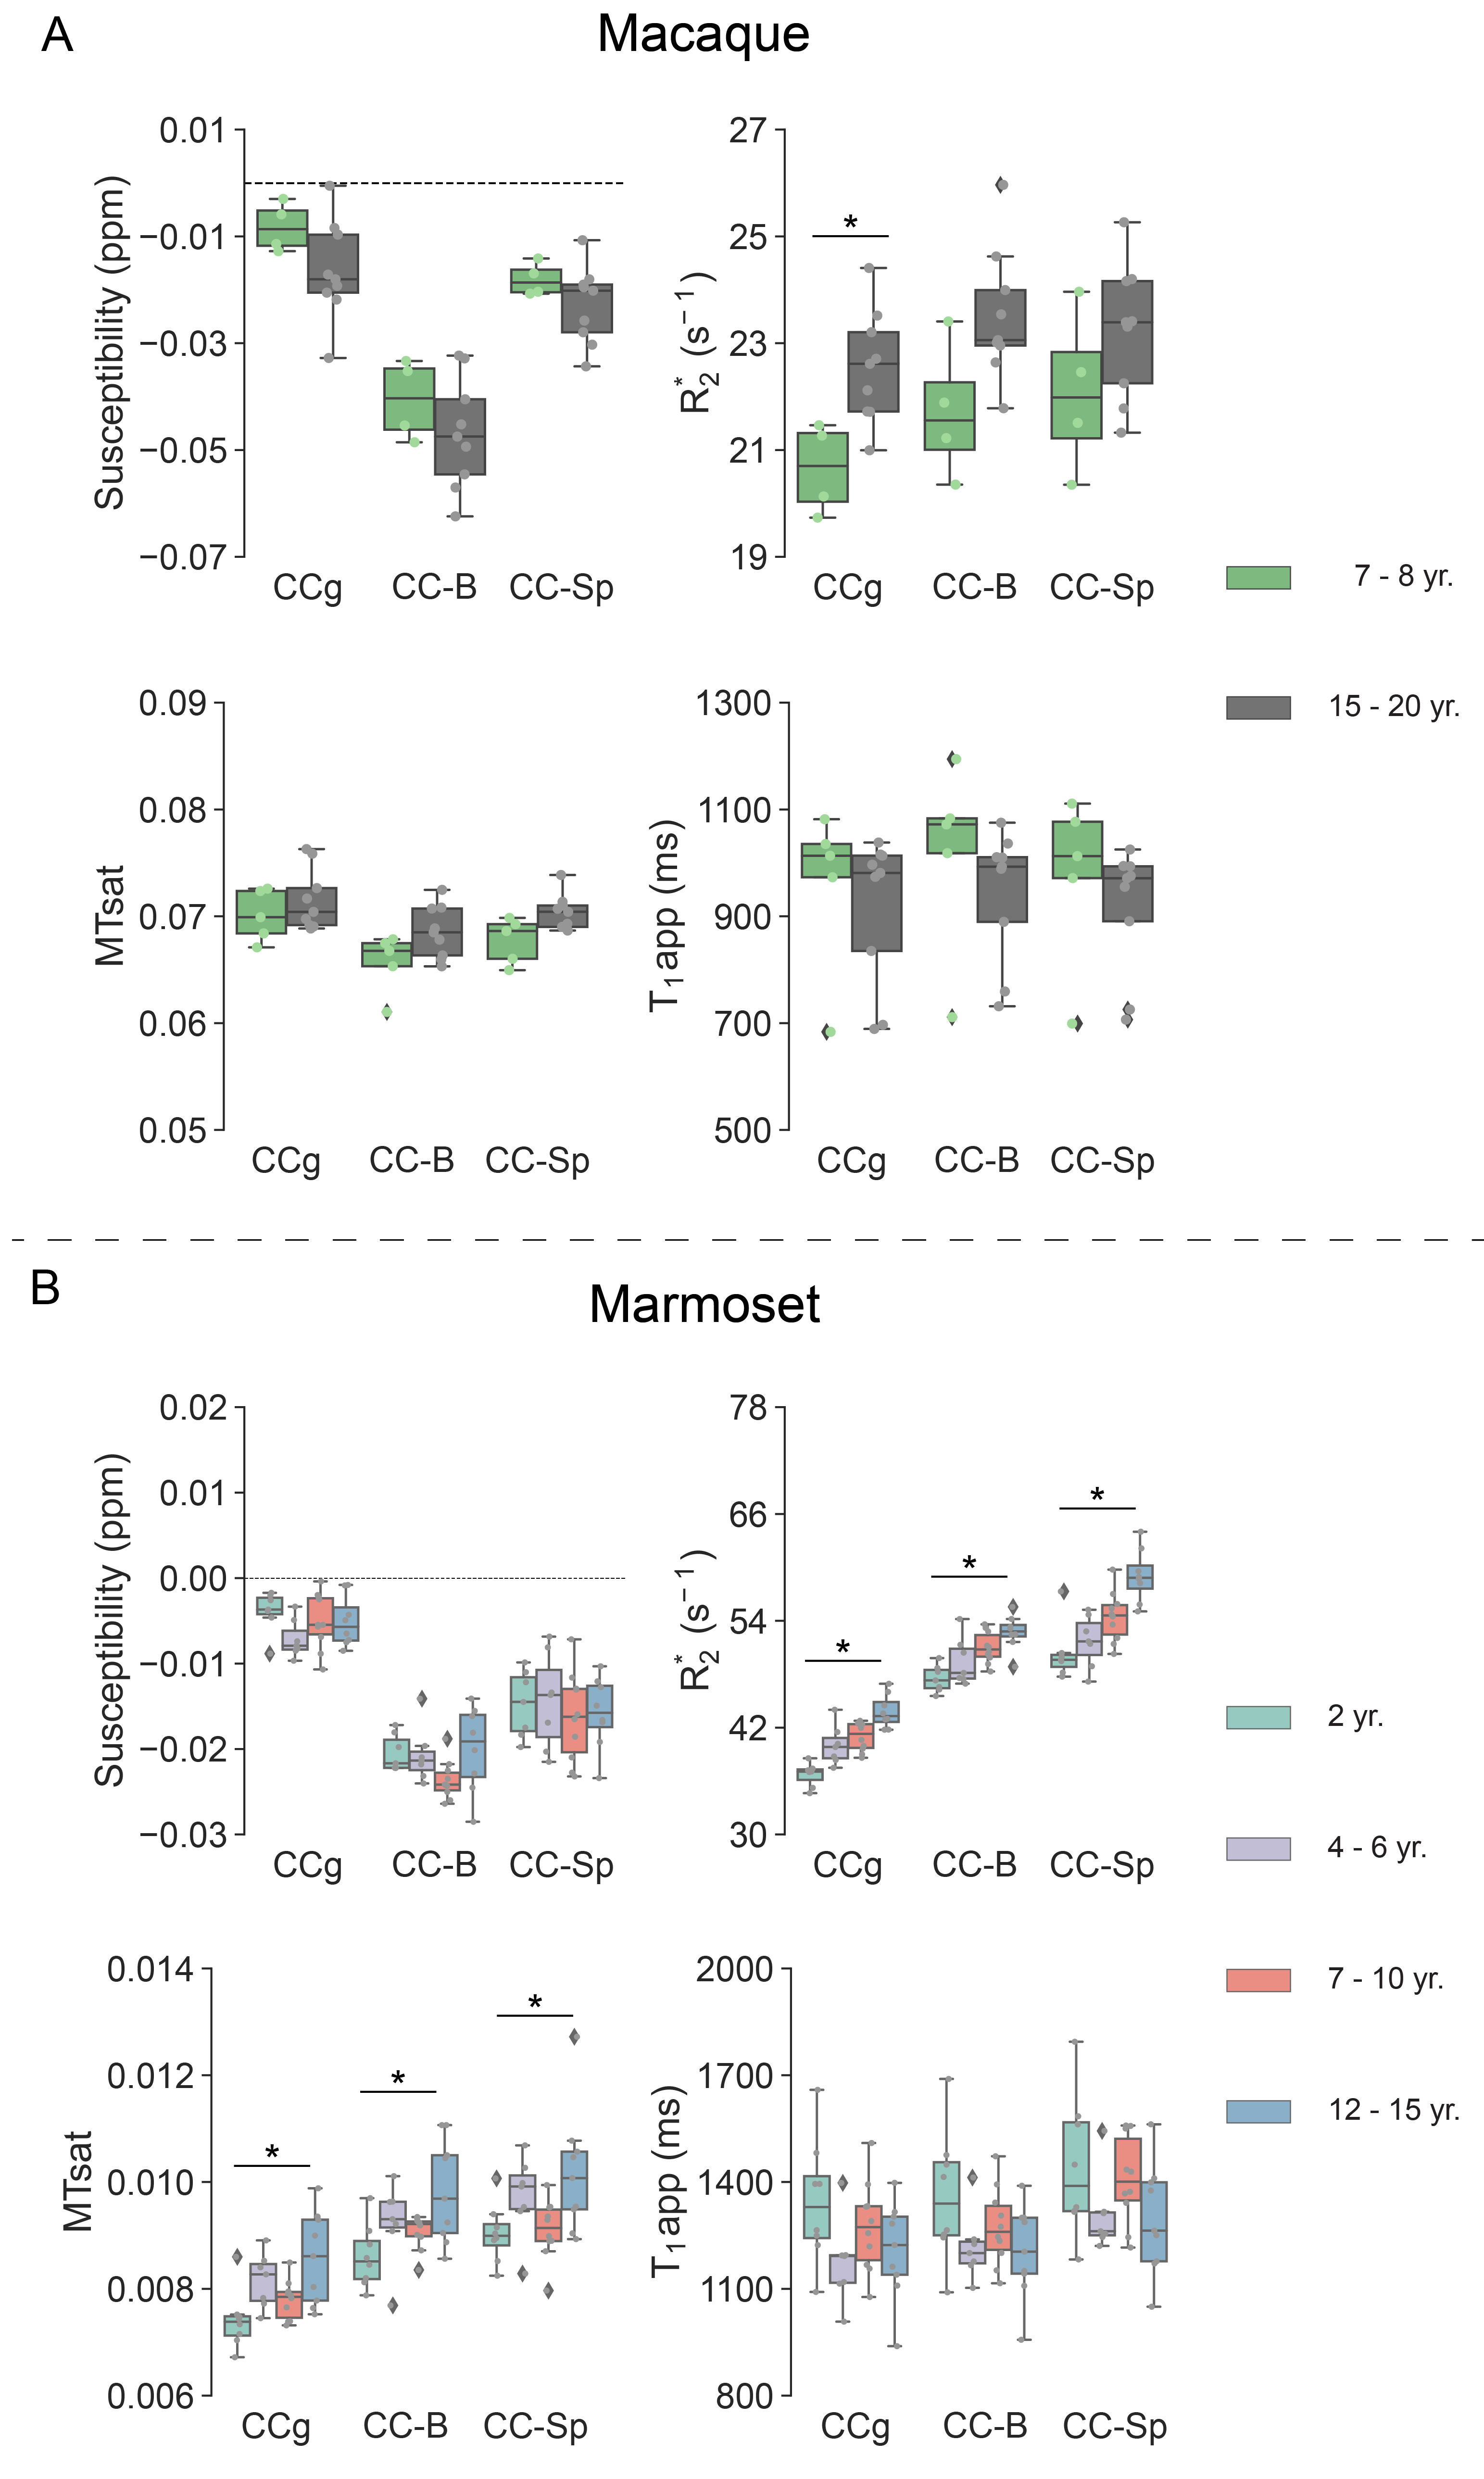
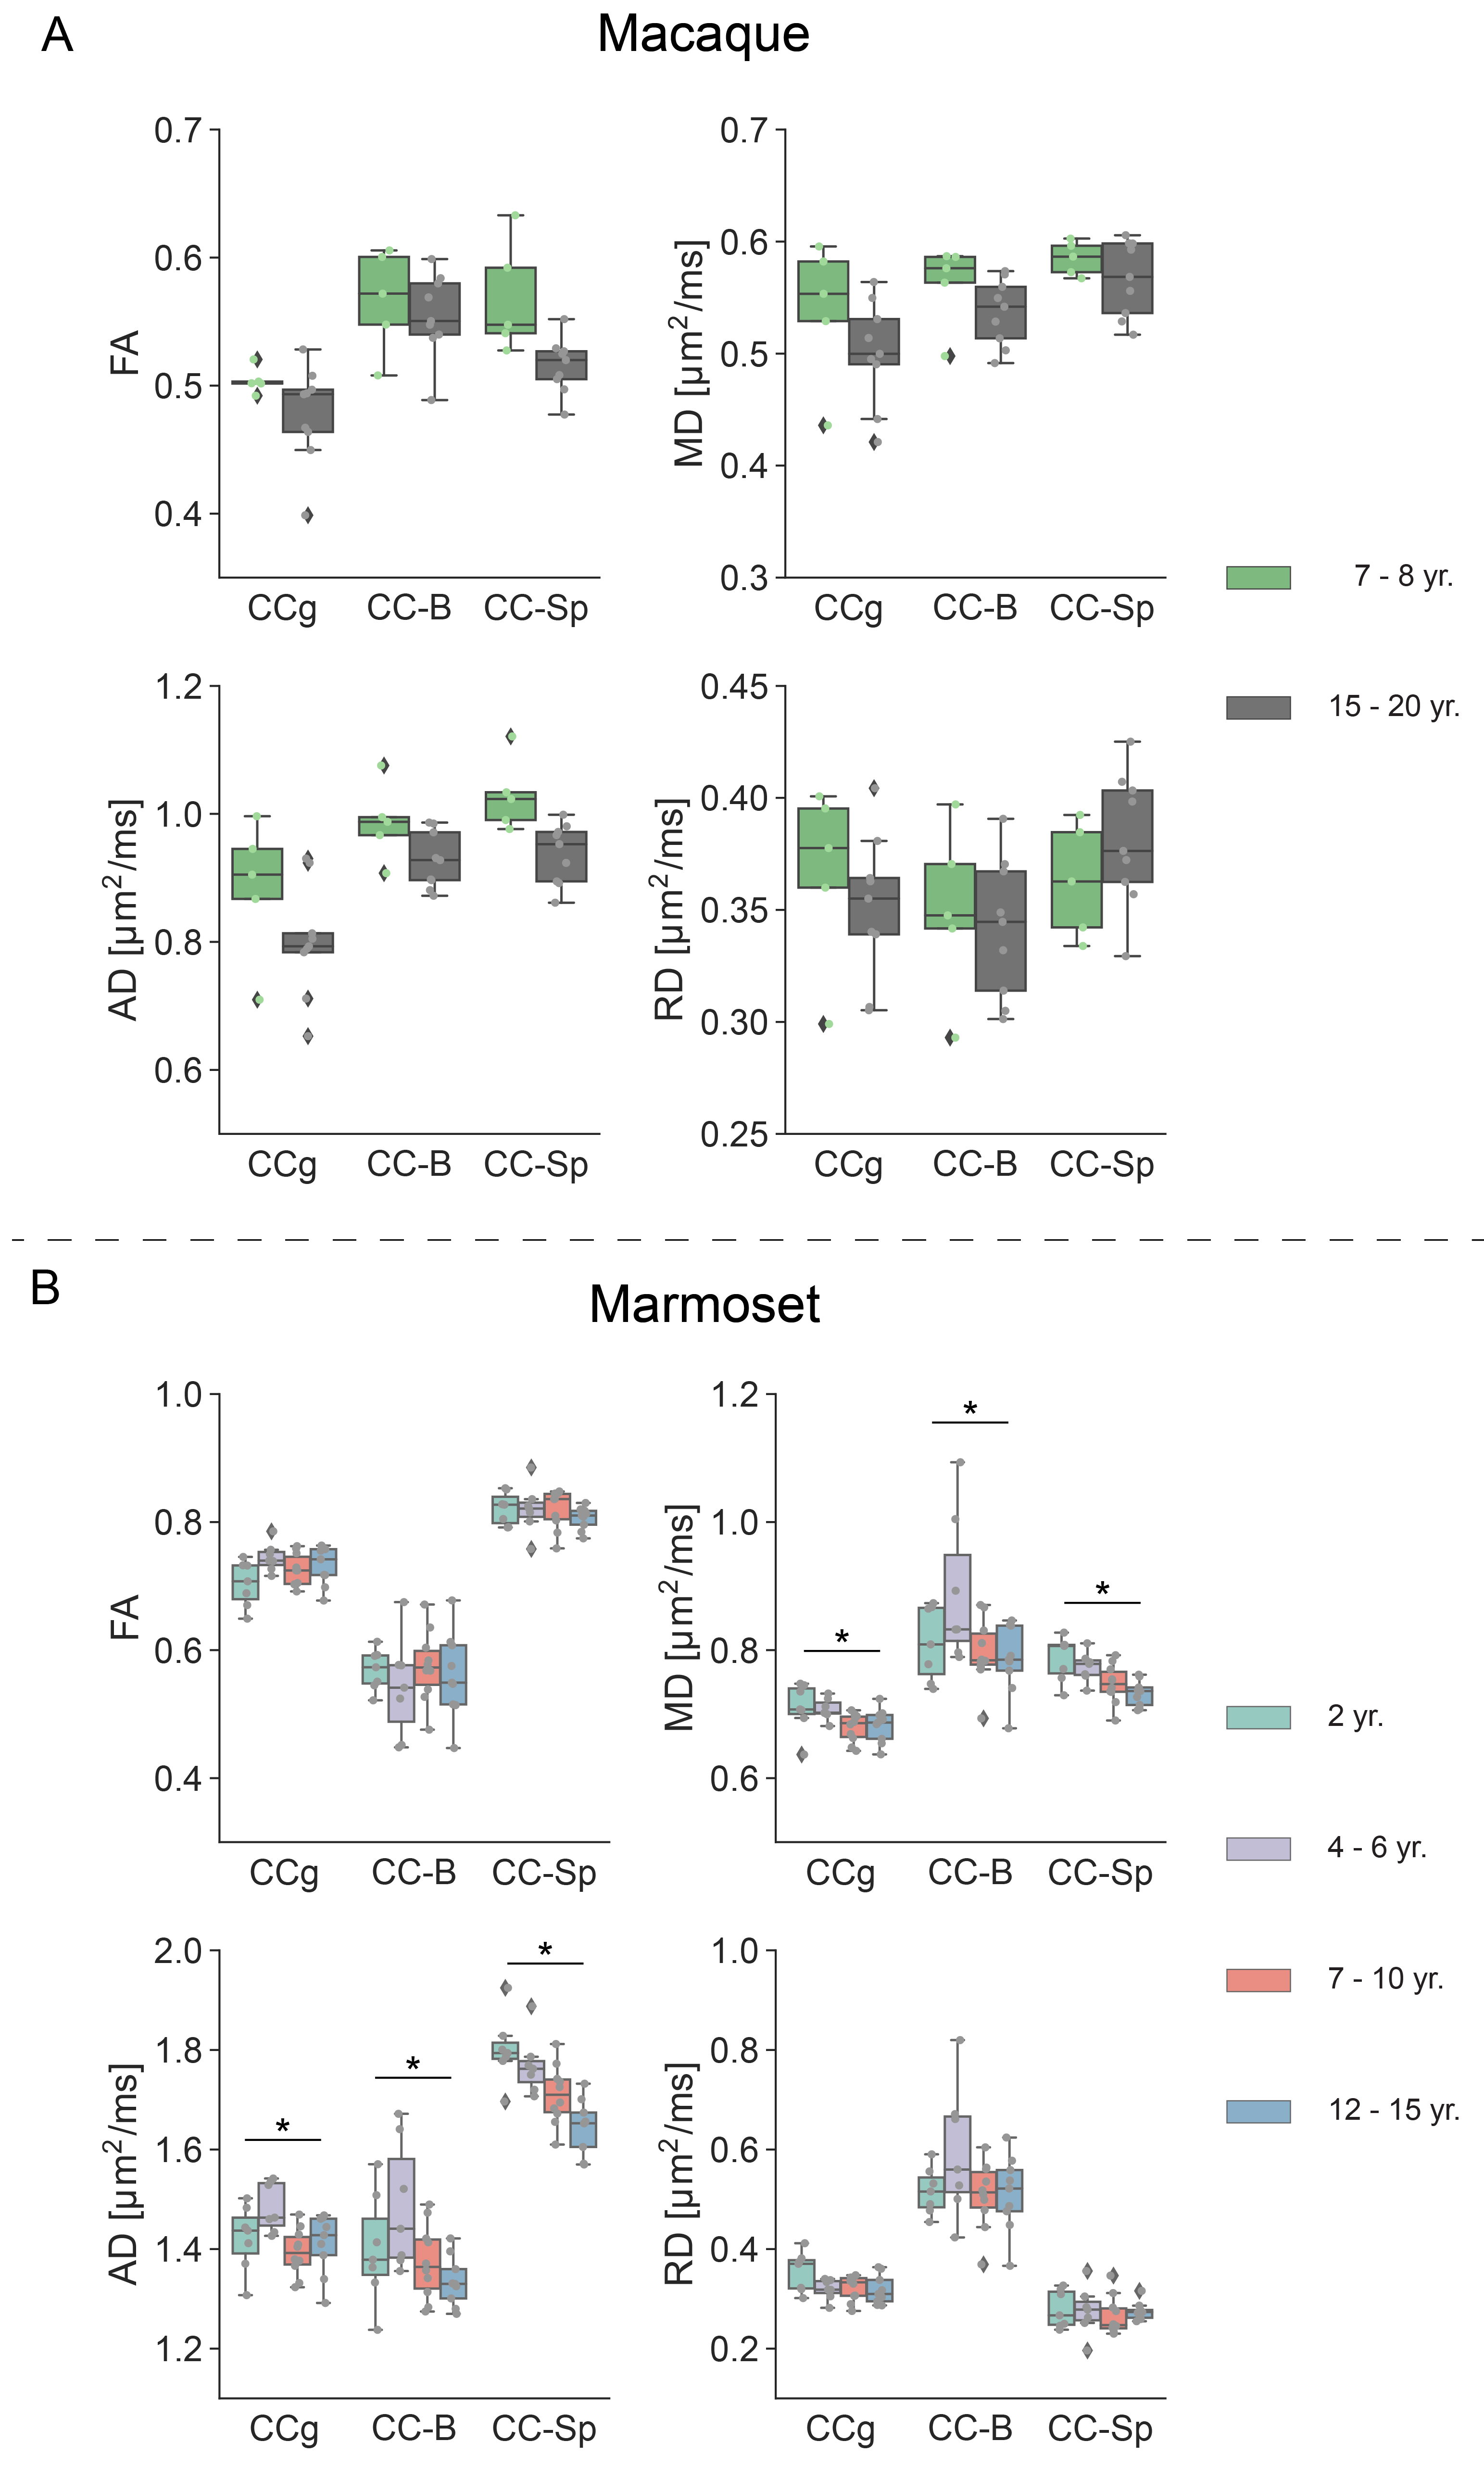
With increasing age, both macaques and marmosets exhibited slightly smaller cortical volumes. In contrast, the cc appeared to be enlarged with age in both species, although to a different extent. The most prominent age-related differences were observed for R2*. Almost all regions of the cc showed higher R2* values in older monkeys. Interestingly, no significant differences in the magnetic susceptibility were observed. While the macaques showed no changes in the diffusion-derived parameters, older marmosets stood out with a reduction in axial and mean diffusivity. Fractional anisotropy and radial diffusivity revealed, in contrast, no age-related differences. Moreover, older marmosets showed an increase in magnetization transfer saturation, while no such changes were observed in macaques.Discussion
In contrast to what has been reported in humans and chimpanzees, we did not observe a reduction in the volume of the cc, neither in macaques nor in marmosets. This finding is in line with a recent study in baboons and capuchin monkeys that found no evidence of an age-related decrease in cc volume 14,15. The observed higher values of R2* but unchanged values of magnetic susceptibility may point to a more heterogeneous microstructure of the cc with increasing age. The reduced diffusivity and increased MTsat would be in line with an increased tissue density. However, further confirmation, including further supporting histological analyses, may be required to understand the observations fully.Acknowledgements
We would like to thank Kristin Kötz and Kerstin Fuhrmann for their technical assistance.References
1. Cox, S. R. et al. Ageing and brain white matter structure in 3,513 UK Biobank participants. Nature Communications 7, 13629 (2016).
2. Taubert, M. et al. Converging patterns of aging-associated brain volume loss and tissue microstructure differences. Neurobiology of Aging 88, 108–118 (2020).
3. Ward, R. J., Zucca, F. A., Duyn, J. H., Crichton, R. R. & Zecca, L. The role of iron in brain ageing and neurodegenerative disorders. Lancet Neurol 13, 1045–1060 (2014).
4. Choi, K. et al. Reference values of hematology, biochemistry, and blood type in cynomolgus monkeys from cambodia origin. Lab Anim Res 32, 46–55 (2016).
5. Colman, R. J. Non-human primates as a model for aging. Biochimica et Biophysica Acta (BBA) - Molecular Basis of Disease 1864, 2733–2741 (2018).
6. Tardif, S. D., Mansfield, K. G., Ratnam, R., Ross, C. N. & Ziegler, T. E. The Marmoset as a Model of Aging and Age-Related Diseases. ILAR J 52, 54–65 (2011).
7. MacDonald, M. E. & Pike, G. B. MRI of healthy brain aging: A review. NMR in Biomedicine n/a, e4564 (2021).
8. Avants, B. B., Epstein, C. L., Grossman, M. & Gee, J. C. Symmetric diffeomorphic image registration with cross-correlation: evaluating automated labeling of elderly and neurodegenerative brain. Med Image Anal 12, 26–41 (2008).
9. Dadarwal, R. & Boretius, S. Multi-contrast MRI Atlas of the Cynomolgus Macaque Brain. https://index.mirasmart.com/ISMRM2021/PDFfiles/1235.html (2021).
10. Liu, C. et al. A digital 3D atlas of the marmoset brain based on multi-modal MRI. Neuroimage 169, 106–116 (2018).
11. Acosta-Cabronero, J. et al. A robust multi-scale approach to quantitative susceptibility mapping. Neuroimage 183, 7–24 (2018).
12. Pei, M. et al. An Algorithm for Fast Mono-exponential Fitting Based on Auto-Regression on Linear Operations (ARLO) of Data. Magn Reson Med 73, 843–850 (2015).
13. Helms,
G., Dathe, H., Kallenberg, K. & Dechent, P. High-resolution maps of
magnetization transfer with inherent correction for RF inhomogeneity and T1
relaxation obtained from 3D FLASH MRI. Magn Reson Med 60,
1396–1407 (2008).
14. Westerhausen, R. & Meguerditchian, A. Corpus callosum morphology across the lifespan in baboons (Papio anubis): A cross-sectional study of relative mid-sagittal surface area and thickness. Neuroscience Research (2021) doi:10.1016/j.neures.2021.03.002.
15. Westerhausen, R. et al. Comparative morphology of the corpus callosum across the adult lifespan in chimpanzees (Pan troglodytes) and humans. Journal of Comparative Neurology 529, 1584–1596 (2021).
Figures