1944
Sex-specific differences in the relationships between obesity, cerebral perfusion and grey matter volume1School of Graduate Studies, Concordia University, Montreal, QC, Canada, 2Centre EPIC, Montreal Heart Institute, Montreal, QC, Canada, 3Centre de Recherche de l’Institut Universitaire de Geriatrie de Montreal, Montreal, QC, Canada, 4PERFORM Centre, Concordia University, Montreal, QC, Canada, 5Department of Physics, Concordia University, Montreal, QC, Canada, 6Department of Neurology and Neurosurgery, McGill University, Montreal, QC, Canada, 7StoP-AD Centre, Douglas Mental Health Institute Research Centre, Montreal, QC, Canada, 8Department of Medicine, University of Montreal, Montreal, QC, Canada
Synopsis
Cerebral health declines in aging. Obesity is reported to accentuate, reduce or have no effect on these declines. Given sex differences are present for cerebral health and obesity individually, it is hypothesized these discrepancies are influenced by sex. Here, we investigated the relationship between obesity, cerebral structure and perfusion in aging females and males separately. Females revealed greater obesity was associated with increased structure and perfusion. Males demonstrated a positive relationship with obesity and perfusion, however, an inverse association was identified between structure and obesity. Future work should investigate the influence of other lifestyle factors on these sex-specific relationships
Introduction
Cerebral atrophy and perfusion changes are consistently reported in aging. Declines to grey and white matter volume as well as cerebral blood flow (CBF) are hypothesized to be accentuated by obesity (i.e., higher body mass index [BMI])1. Yet, others have found increased BMI associated with no difference2 or enhanced cerebral outcomes3. To date, it is unclear why these discrepancies exist, although, given the known physiological sex differences in obesity4 and cerebral outcomes5, it is possible that these contradictory findings are driven by sex-specific differences. Further confirmed by work identifying sex differences in the relationship between obesity and cognition6 .Thus, we investigated the sex-specific effect of obesity on cerebral health in regions related to aging and obesity.Methods
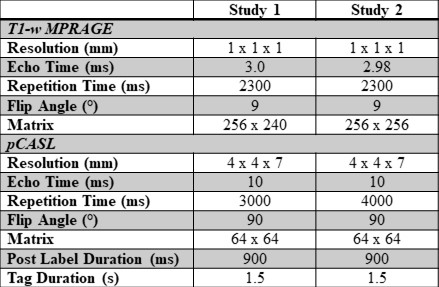
Data from two unique study datasets, including PREVENT-AD7, were pooled, providing 404 older adults (females n = 283) with MRI acquisitions, both completed on 3T Siemens MRI scanners. An anatomical MPRAGE was acquired in all participants, as well as a resting pCASL and M0 map (see Table 1 for imaging parameters of each study).Demographics about height, weight, education, age, and cardiovascular risk factors were collected (Table 2). Body mass index was calculated as , where greater BMI is an indicator of increased obesity. The Framingham risk factor score 8 was also calculated for each participant. For each study, z-scores were calculated separately by sex for BMI and Framingham risk factor score.
The MPRAGE images were used to segment GMV and WMV with voxel-based morphometry using the cat12 toolbox in SPM12 9–11. pCASL data underwent brain extraction, followed by motion correction across the time series, in FSL and MATLAB, respectively. The motion parameters were regressed out of the pCASL time series using a general linear model. A cerebral spinal fluid M0 mask was created for each participant to quantify resting CBF. The M0 masks were created by calculating the mean of all control images in the pCASL time series. The maps were registered to T1 native space and then to MNI common space using ANTS12. The final CBF maps were quantified with FSL BASIL toolkit13, and partial volume corrected. Regions of interest (ROI) associated with aging and/or obesity were extracted using the LPBA40 atlas14. GMV, WMV and CBF for each participant was extracted in both hemisphere for all ROIs. Partial correlations between the BMI z-scores and i) GMV; ii) WMV; and iii) CBF in GM in each ROI were run in SPSS, correcting for: age, education, Framingham Risk factor z-score, and study. Partial correlations were run separately for males and females. FSL Randomise GLM with threshold-free cluster enhancement (TFCE) was employed to confirm our hypothesis driven ROIs.
Both sexes were divided into lean based on BMI of 18-24.9 kg/m2 (n = 35 males; n = 128 females) and overweight (BMI 25-40 kg/m2) (n = 84 males; n = 157 females). An independent samples t-test was utilized to test differences between the two groups for each sex, correcting for the same covariates as the partial correlation. All analyses were corrected for multiple comparisons.
Results
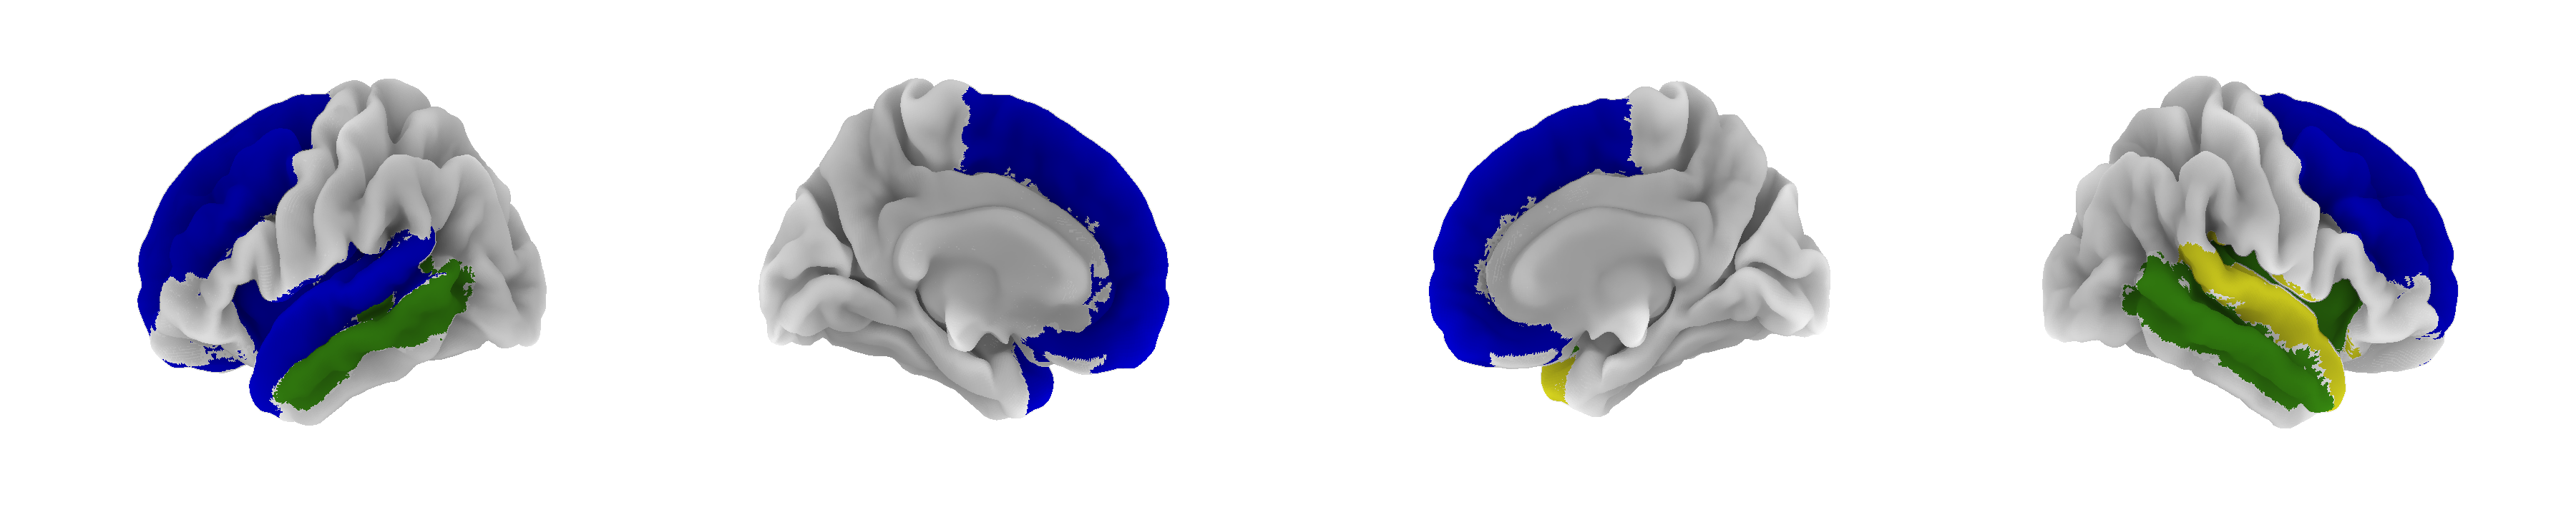
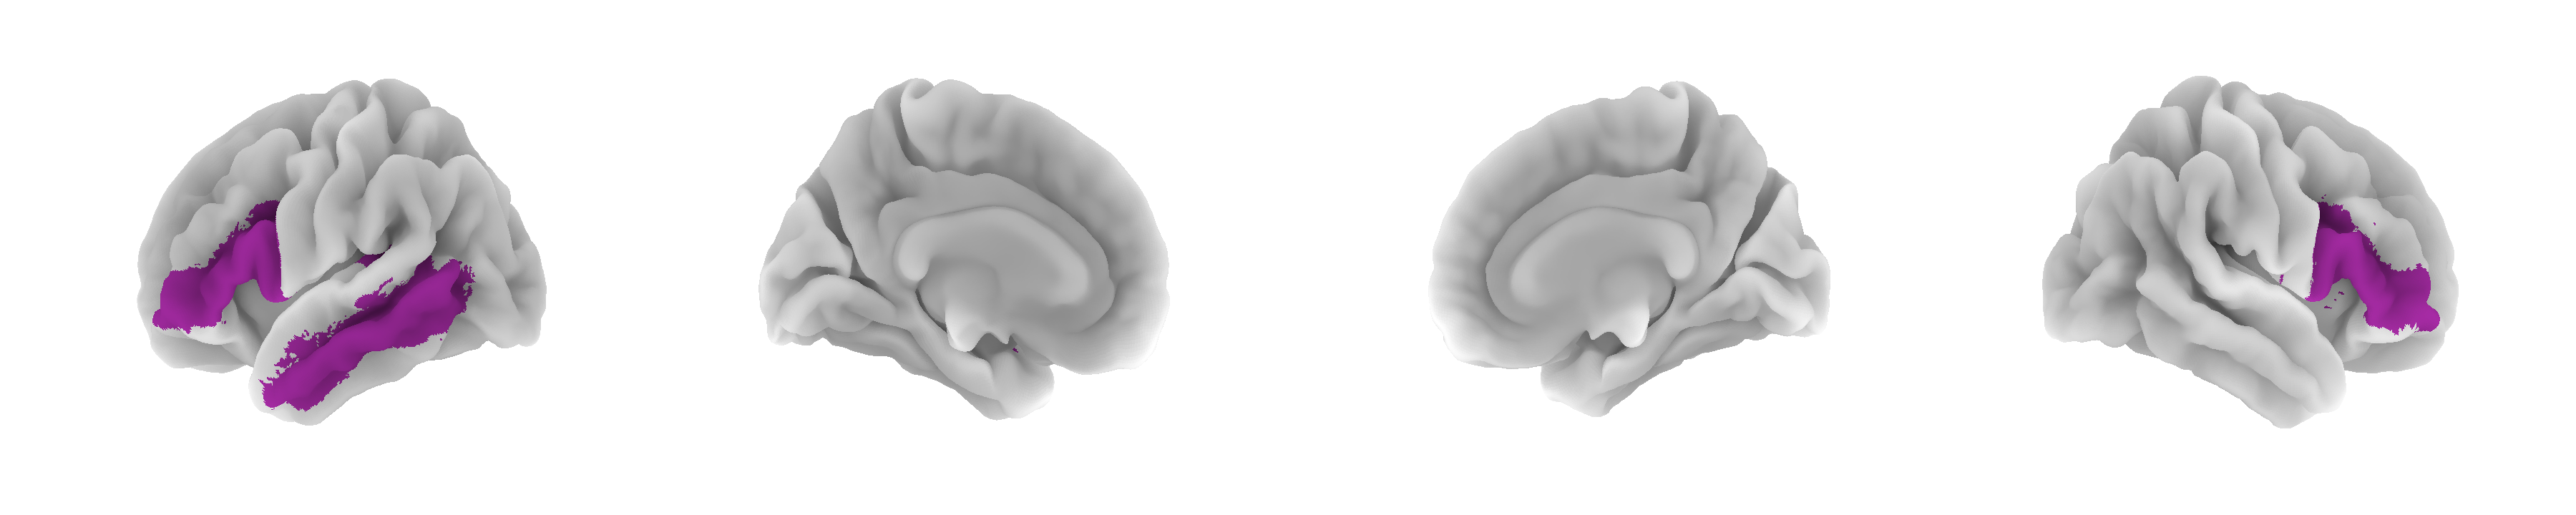
Females were found to have a positive correlation between BMI and several GMV ROI’s, within the temporal lobes and insula, where greater BMI was associated with enhanced GMV (p < 0.05) (see Figure 1). The same trend in CBF was identified in the same significant ROIs as for GMV, as well as frontal and temporal regions (p <0.05) (See Figure 1). No significant relationships were identified for WMV (p > 0.05). Males were found to have an inverse correlation between GMV and BMI in the inferior frontal gyrus and the medial temporal gyrus (p < 0.05) (see figure 2). In these same regions, CBF was positively associated with BMI (p < 0.05) (Figure 2). No significant differences were identified for WMV (p > 0.05). Voxel-wise analyses confirmed the location of significant relationships with BMI, GMV and CBF in superior frontal and insular regions, for females( p < 0.05). Males did not demonstrate significant voxel-wise results ( p > 0.05).Discussion
Sex-specific relationships between GMV and BMI, in primarily frontal and temporal regions, were revealed here. Confirming results from Huang and colleagues of the presence of an interaction with sex and BMI3. They did find regions that were positively and negatively associated with BMI, however it was the anterior cingulate cortex that was found to have a sex-specific relationship with males demonstrating the inverse relationship with BMI, and females revealing none. Notably, medial temporal gyrus was the only overlapping region which demonstrated the sex-specific trends for BMI. Given this region’s known relationship with atrophy in dementia, future work should investigate if males with higher BMI are at increased risk of developing dementia. Conversely, both sexes were found to have increased CBF with greater BMI, though this relationship was not as widespread in males.Conclusions
This confirms previous work in females with obesity showing greater CBF15, but to our knowledge is the first to demonstrate this trend in males. Future work should investigate if these relationships are influenced by other lifestyle factors such as physical activity.Acknowledgements
Fonds de recherche du Québec - Nature et technologies (FRQNT) (JH); the Canada Foundation for Innovation (Leaders Opportunity Fund 17380- RDH); the Ministere du developpement economique, de l’innovation et de l’exportation (PSRSIIRI-239- RDH), the Canadian National Sciences and Engineering Research Council (R0018142, RGPIN 2015-04665; RDH); Mirella and Lino Saputo Research Chair inCardiovascular Health and the Prevention of Cognitive Decline from the Universite de Montreal at the Montreal Heart Institute (LB); Heart and Stroke Foundation New Investigator Award (CJG); J.M. Barnett fellowship (CJG); the Michal and Renata Hornstein Chair in Cardiovascular Imaging (CJG); Heart and Stroke Foundation Grant-in-Aid G-17-0018336 (CJG); Canadian Institutes of Health Research (MOP 84378, Banting and Best Scholarship- CJG).
Note: Data used in preparation of this abstract were obtained from the Pre-symptomatic Evaluation of Novel or Experimental Treatments for Alzheimer’s Disease (PREVENT-AD) program (https://douglas.research.mcgill.ca/stop-ad-centre), data release 5.0 (November 30, 2017). A complete listing of PREVENT-AD Research Group can be found in the PREVENT-AD database: https://preventad.loris.ca/acknowledgements/acknowledgements.php?date=[2021-06-03]. The investigators of the PREVENT-AD program contributed to the design and implementation of PREVENT-AD and/or provided data but did not participate in analysis or writing of this report.
References
1. Dake MD, De Marco M, Blackburn DJ, et al. Obesity and Brain Vulnerability in Normal and Abnormal Aging: A Multimodal MRI Study. ADR. 2021;5(1):65-77. doi:10.3233/ADR-200267
2. Albanese E, Davis B, Jonsson PV, et al. Overweight and Obesity in Midlife and Brain Structure and Dementia 26 Years Later. American Journal of Epidemiology. 2015;181(9):672-679. doi:10.1093/aje/kwu331
3. Huang Y, Li X, Jackson T, et al. Interaction Effect of Sex and Body Mass Index on Gray Matter Volume. Front Hum Neurosci. 2019;13:360. doi:10.3389/fnhum.2019.00360
4. Lovejoy JC, Sainsbury A, Group the SC 2008 W. Sex differences in obesity and the regulation of energy homeostasis. Obesity Reviews. 2009;10(2):154-167. doi:10.1111/j.1467-789X.2008.00529.x
5. Robison LS, Gannon OJ, Salinero AE, Zuloaga KL. Contributions of sex to cerebrovascular function and pathology. Brain Research. 2019;1710:43-60. doi:10.1016/j.brainres.2018.12.030
6. Langeard A, Fakrahnak Z, Vrinceanu T, et al. Sex-moderated association between body composition and cognition in older adults. Experimental Gerontology. 2020;138:111002. doi:10.1016/j.exger.2020.111002
7. Tremblay-Mercier J, Madjar C, Das S, et al. Open science datasets from PREVENT-AD, a longitudinal cohort of pre-symptomatic Alzheimer’s disease. Neuroimage Clin. 2021;31:102733. doi:10.1016/j.nicl.2021.102733
8. D’Agostino RB, Vasan RS, Pencina MJ, et al. General cardiovascular risk profile for use in primary care: the Framingham Heart Study. Circulation. 2008;117(6):743-753. doi:10.1161/CIRCULATIONAHA.107.699579
9. Gaser C, Dahnke R. CAT - A Computational Anatomy Toolbox for the Analysis of Structural MRI Data. :1.
10. Ashburner J, Friston KJ. Voxel-based morphometry--the methods. Neuroimage. 2000;11(6 Pt 1):805-821. doi:10.1006/nimg.2000.0582
11. Friston KJ, ed. Statistical Parametric Mapping: The Analysis of Funtional Brain Images. 1st ed. Elsevier/Academic Press; 2007.
12. Avants BB, Epstein CL, Grossman M, Gee JC. Symmetric diffeomorphic image registration with cross-correlation: evaluating automated labeling of elderly and neurodegenerative brain. Med Image Anal. 2008;12(1):26-41. doi:10.1016/j.media.2007.06.004
13. Chappell MA, Groves AR, Whitcher B, Woolrich MW. Variational Bayesian Inference for a Nonlinear Forward Model. IEEE Transactions on Signal Processing. 2009;57(1):223-236. doi:10.1109/TSP.2008.2005752
14. Shattuck DW, Mirza M, Adisetiyo V, et al. Construction of a 3D probabilistic atlas of human cortical structures. Neuroimage. 2008;39(3):1064-1080. doi:10.1016/j.neuroimage.2007.09.031
15. Silvah JH, Marchini JS, Mártires Lima CM, et al. Regional cerebral blood flow at rest in obesity. Nutrition. 2020;79-80:110888. doi:10.1016/j.nut.2020.110888
Figures
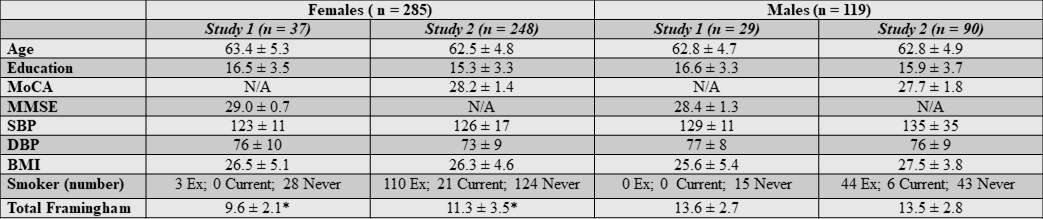
Sex-Specific Demographics for Each Study
MoCA = Montreal Cognitive Assessment; MMSE = Mini Mental Status Exam; SBP = Systolic Blood Pressure; DBP = Diastolic Blood Pressure; BMI = Body Mass Index
*statistically different p < 0.05