1943
Scyllo-inositol: concentration changes associated with aging and alcohol use, and T2 measurement.1Radiology, University of Minnesota, Minneapolis, MN, United States, 2Geriatric Research, Veterans Affairs Health Care System, Minneapolis, MN, United States, 3Department of Neurology, University of Minnesota, Minneapolis, MN, United States, 4University of Minnesota, Minneapolis, MN, United States, 5Division of Biostatistics, University of Minnesota, Minneapolis, MN, United States
Synopsis
The goals of this study were to investigate the effect of alcohol usage on scyllo-inositol (sIns) in young and older healthy adults, and measure the T2 of sIns in young and older healthy adults. Two brain regions (occipital cortex (OCC), posterior cingulate cortex (PCC)) were studied at 3T. sIns was measured using a short-echo-time STEAM while T2 was measured using LASER. sIns in OCC and PCC regions was found to increase as the brain ages; alcohol usage (0-2 drinks/week) was significantly different between age groups. In addition, there seems to be a trend towards lower T2 of sIns with age.
Introduction
Scyllo-inositol (sIns) is the second most abundant form of inositol. It is a six-carbon sugar alcohol and is one of nine possible structural isomers of hexahydroxycyclohexane. sIns was first detected non-invasively in vivo in the human brain using localized proton MRS in 19931. It is represented by a single peak that resonates at 3.34 ppm in the proton spectrum or at 74.5 ppm in the carbon-13 spectrum2. In healthy brain, sIns is typically low (<1 mM).Several MRS studies have shown changes in the sIns concentration in the brain. High level of sIns was reported with chronic alcoholism3. Elevated sIns/total creatine was also found in patients with Alzheimer’s disease and patients with amnestic mild cognitive impairment compared to healthy controls4. Similar result was found in a mouse model with Alzheimer's disease5. Kaiser et al. have shown that sIns level increases during normal aging6.
It is known that during normal brain aging, there are region-specific metabolite concentrations changes in addition to T2 relaxation times of metabolites getting shorter7. However, it is not known how brain sIns changes with different alcohol consumption in both young and older adults. In addition, only one study so far has reported the T2 of sIns in a single individual2. Therefore, the aims of this study were to investigate the effect of alcohol usage on sIns in young and older healthy adults, and measure the T2 of sIns in young and older healthy adults.
Methods
29 young (21±1years) and 24 older (74±3years) adults were scanned on a Siemens 3T scanner after giving informed consent for the study approved by the IRB. During the screening process, the alcohol consumption was noted for each participants. Body coil was used for excitation while the 32-channel receive-only head-coil was used for signal reception. Two VOIs were studied: posterior cingulate (PCC, 15.6 mL) and occipital (OCC, 15.9 mL) cortices. To determine the concentration of sIns, a short-TE STEAM (TE/TM/TR=21.22/105/3000 ms, 16 averages) was used. To determine the T2 relaxation of sIns, LASER (TR=3 s) was used and data were acquired at six different TEs (35, 140, 230, 290, 330, 400 ms with different averages8). VAPOR scheme interleaved with OVS pulses was used in both sequences. Water reference scans were also acquired for eddy-current correction. Prior to MRS acquisitions, first- and second-order shims were automatically adjusted for each VOI using the system 3D gradient-echo shim, operated in the “Brain” mode. In addition, the B1 field were calibrated for each VOI.All spectra were processed in MATLAB: eddy current effect was first corrected, followed by single-shot frequency and phase algorithms. Basis sets for STEAM and LASER at 6 different TEs were simulated using custom software in MATLAB based on density matrix formalism using measured and published chemical shift and J-coupling values. Measured macromolecule spectra were also incorporated in the basis sets. All spectra were fitted using LCModel7 from 0.5 to 4.1 ppm to determine the concentration of sIns. T2 value of sIns was obtained by fitting the amplitudes obtained from LCModel with an exponential fit.
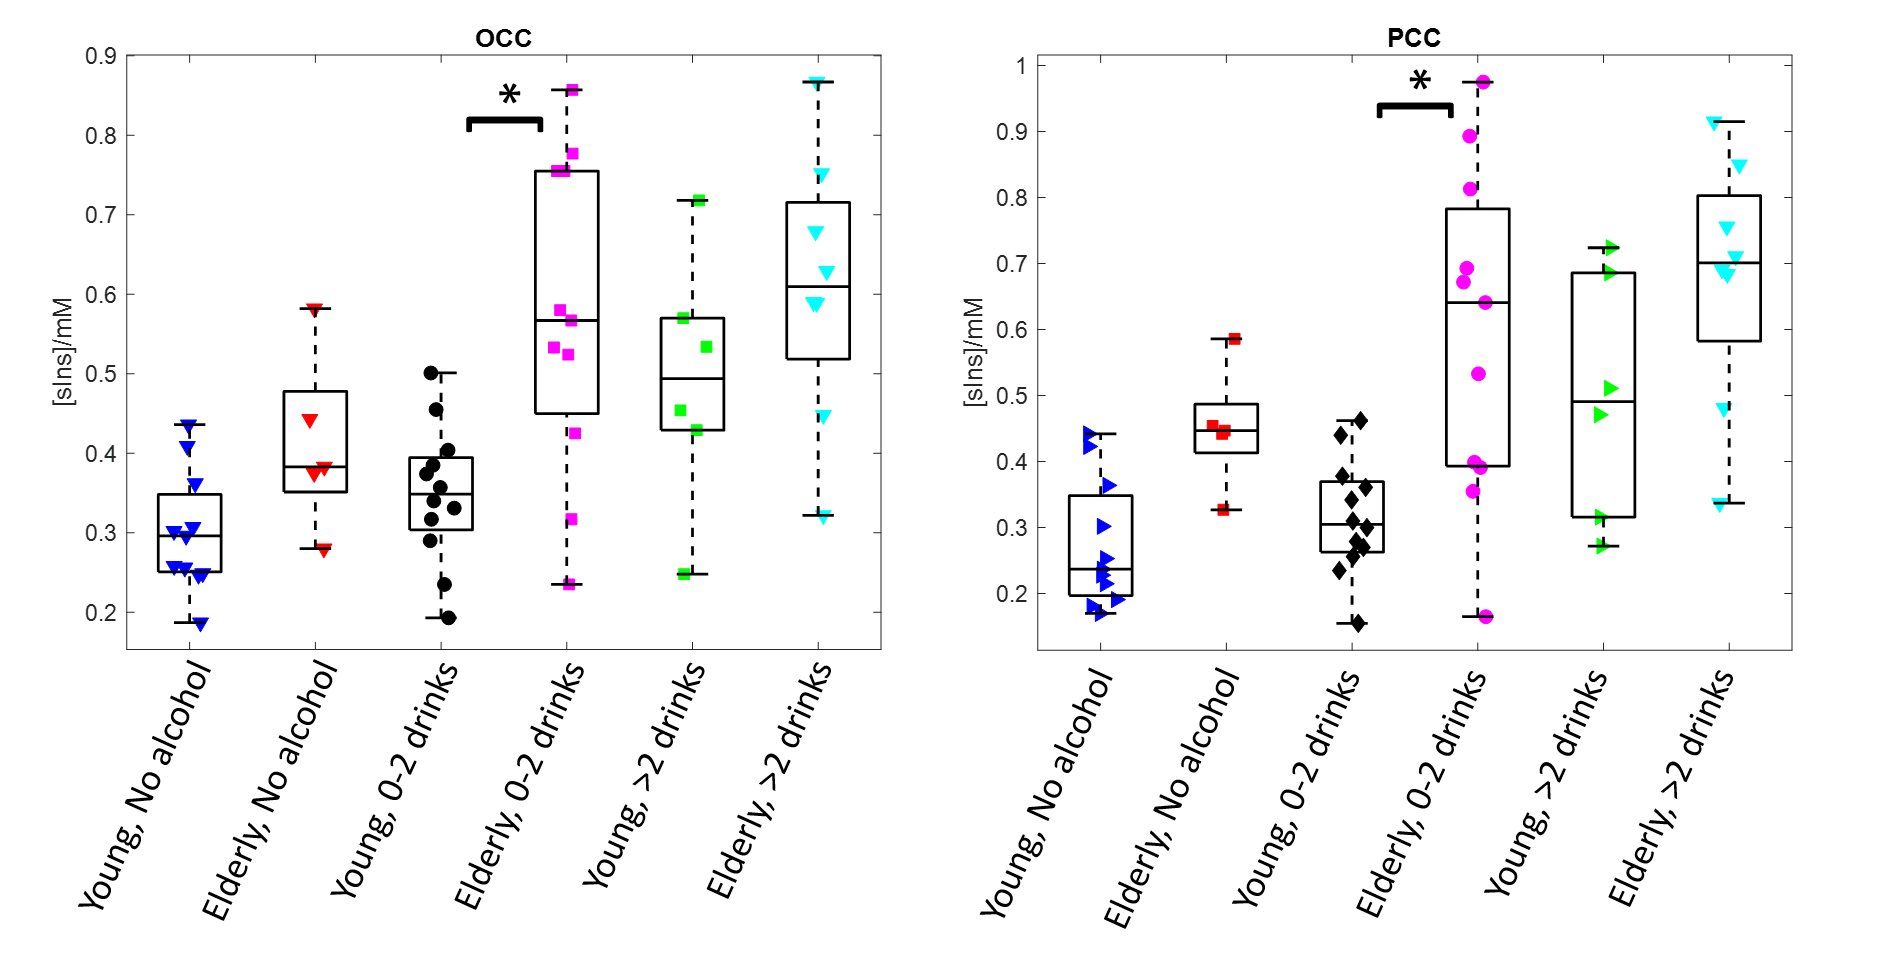
Each participant was classified into three groups based on their alcohol usage: non-drinker (0 drink/week), 0-2 drinks/week and >2 drinks/week.
Results
STEAM spectra acquired from the PCC in one young and older subject are shown in Figure 1 where the sIns peak is readily visible. The mean concentration of sIns was found to be significantly higher (P<0.0001) in the older adults in both studied brain regions: 0.6±0.2 mM in older vs. 0.4±0.1 mM in young in OCC and 0.6±0.2 mM in older vs. 0.3±0.1 mM in young in PCC. No sIns data was rejected due to the high spectral data quality in addition to the high reliability to qualify sIns peak (mean Cramer-Rao lower-bound was 20±10%; ranging from 10% to 91% in both regions and cohorts). A positive correlation was observed between concentration of sIns and age (R=0.57, P<0.001) as shown in Figure 2.The classification of sIns level based on the participants’ alcohol consumption is shown in Figure 3. An age-group comparison showed that the sIns level was statistically different (P<0.0004) between young and older adults in both PCC and OCC with 0-2 drinks/week usage.
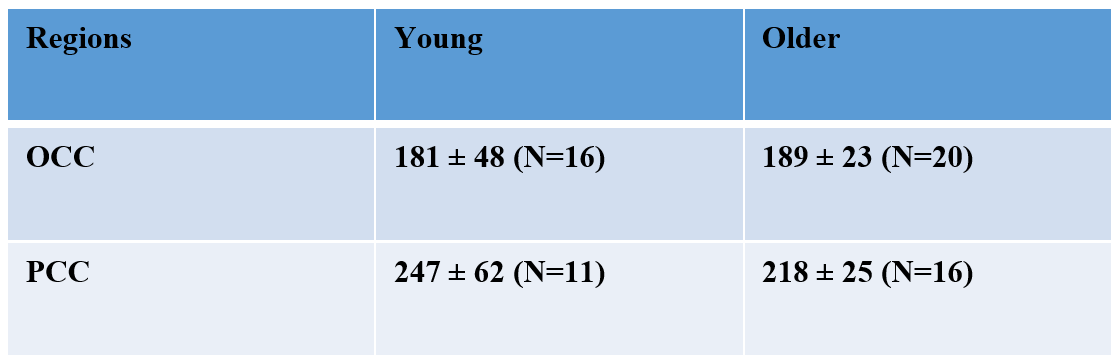
T2 values of sIns measured in young and older healthy adults had a tendency to be shorter in PCC, although not significant while in OCC it was comparable (Figure 4).
Discussion & Conclusion
This study shows that the concentration of sIns in OCC and PCC regions increases as the brain ages. This is consistent with previous study6 which measured sIns primarily in white matter. This suggests that changes in sIns level are not region-specific and occur throughout the brain during aging. In addition, alcohol usage (0-2 drinks/week) was significantly different between cohorts. Although there is a trend towards lower T2 of sIns with aging consistent with other metabolites7, it was not significantly different. This is related to the low number of subjects used in the T2 calculation since at long-TE it was not possible to reliably measure sIns. In summary, this study shows that it might not be straight-forward to compare sIns level between groups unless alcohol consumption is taken into account.Acknowledgements
This work was supported by funding from the National Institutes of Health grants (R21AG045606, P41 EB015894, P30 NS076408).References
1.
Michaelis et al. NBM Biomed, 6,105-109, 1993
2. Seaquist & Gruetter. Magn Reson Med, 29:313-316, 1998
3. Viola et al. MAGMA, 17: 47-61, 2004
4. Griffith et al. NMR Biomed, 20:709-716, 2007
5. Choi et al. NeuroPharm, 59: 353-357, 2010
6. Kaiser et al. NMR Biomed, 18: 51-55, 2005
7. Deelchand et al. Neurobiology of Aging, 95:168-175, 2020
8. Deelchand et al. Magn Reson Med, 79:1260-1265, 2018
Figures