1942
Radiomics assessment of liver fibrosis in patients with chronic liver disease using MRI: a machine learning approach1Department of Medical Physics and Biomedical Engineering, School of Medicine, Tehran University of Medical Sciences, Tehran, Iran (Islamic Republic of), Tehran, Iran (Islamic Republic of), 2Quantitative MR Imaging and Spectroscopy Group, Research Center for Molecular and Cellular Imaging, Tehran University of Medical Sciences, Tehran, Iran (Islamic Republic of), 3Shahid Beheshti University of Medical Science, Tehran, Iran (Islamic Republic of), 4Department of Radiology Technology, School of Allied Medical Sciences, Shahid Beheshti University of Medical Sciences, Tehran, Iran (Islamic Republic of), 5Gastrointestinal and Liver Disease Research Center, Firoozgar Hospital, Iran University of Medical Sciences, Tehran, Iran (Islamic Republic of), 6Department of Diagnostic Imaging, Shohada-e-Tajrish Hospital, Shahid Beheshti University of Medical Science, Tehran, Iran (Islamic Republic of)
Synopsis
Neither biochemical markers nor a qualitative assessment of medical images are reliable to differentiate mild from moderate stages of liver fibrosis. The main purpose of this study is to develop a machine learning model to classify mild and moderate liver fibrosis based on radiomic features extracted from MRI images (T1-w, T2*-map & ADC-map). Nu-SVC classifier was employed as the classification technique, trained by the extracted data from image series of 29 patients with histopathology-confirmed mild and moderate liver fibrosis. Results demonstrate that radiomic analysis of T2*-map and ADC-map has high potential in classifying different stages of liver fibrosis.
Introduction
Liver Fibrosis (LF) is common pathological result of any chronic liver disease which may lead to cirrhosis, hepatic functional impairment1. Staging liver fibrosis is crucial in clinical decisions2. Currently, biopsy is the gold standard method for staging LF. Biopsy is an invasive technique and has several limitations including pain and hemorrhage3. Therefore, introducing a new technique to minimize the limitations of biopsy is essential.Clinical magnetic resonance imaging (MRI) is widely available and its different imaging protocols have made this modality to be considered as an alternative to biopsy. Several Studies have declared the accuracy of MRI-based biomarkers to stage LF since signal intensity and voxel values vary in different stages4,5.
Radiomics is a post-processing technique that extracts a large number of quantitative values (named feature) from ROI based on pixel intensities and their patterns. The main purpose of extracting these features is to improve diagnostic performance6. Machine Learning algorithm can manage large amounts of radiomic features and after training and pattern recognition, it can classify new input data7. Unlike healthy and cirrhotic liver, neither biochemical markers nor qualitative assessment of medical images are reliable to differentiate the early from relatively advanced stages of LF8,9.
Therefore, the purpose of this study is to evaluate the accuracy of radiomic features extracted from T1-w, T2*-map, and ADC-map in staging mild and moderate LF.
Method
Participants: 68 patients with abnormal ultrasonography exam or blood serum markers nominated for biopsy. The exclusion criteria are as follows: 1- Patients with hepatic malignancies, 2- Unprocessable data due to motion artifacts and non-identical MRI parameters, 3- Incomplete MR exam, and 4- Biopsy refusal by the patient.Multi-parametric MR acquisition: MR exams were performed on a 1.5T MRI machine (Siemens/Germany) using standard body and spine coil within a week before the biopsy. Sequences and parameter values are shown in Table1.
Biopsy and Histopathological Analysis: Non-targeted liver biopsy was done under an ultrasound guide. Kleiner Scoring System and modified hepatic activity index were used to quantify fibrosis in Non Alcoholic Fatty liver (NAFLD) [H1] and non-NAFLD patients, respectively. To standardize the scores among NAFLD and non-NAFLD patients, scores corresponded as shown in table 2.
Image processing and feature extraction: T2*-map images were derived using 3D-slicer software (v. 4.10.2) with T2 Mapping module. A single ROI was determined at the right hepatic lobe of each multi-parametric MR data using ImageJ software (v. 1.53e). About 270 radiomic features including Histogram, GLRLM, GLCM, and wavelet were extracted from each ROI. Image samples of T1-w, T2*-map, and ADC-map are shown in Fig. 1.
Machine learning: After normalization and feature selection, eventually best four features for each image were selected. Nu-Support Vector Classifier (NuSVC) was employed to classify cases as either mild or moderate.
The model was evaluated using leave-one-out cross-validation method. To evaluate the performance of the model, three quantitative indices, namely accuracy, sensitivity, and specificity10 were calculated. In addition, performance analysis based on the receiver operating characteristics (ROC) curves was performed and the area under the curve (AUC) was calculated.
Results
According to standardized scores, 29 patients with mild (n=21, 72.4%) and moderate (n=8, 27.6%) LF enrolled in our study. The best four features in differentiating mild from moderate LF were selected for each parameter. Extracted features of T2*-map and ADC-map showed the best performance in classifying mild and moderate LF cases on NuSVC (AUC=1) while features of T1-w image had lower diagnostic performance (Table 3).Discussion
Results of this 29-participant study demonstrate that diagnostic performance of T2*-map and ADC-map features is higher than T1-w features. Results of many studies have indicated the good performance of radiomics analysis of LF on MRI images in combination with machine learning11,12. Our results are in accordance with the previous studies. To the best of our knowledge, radiomic analysis LF has not been performed on T2-map yet. The most important limitation of this study is small number of participants. Future studies should be performed with a large number of participants.Conclusion
Results of the present study indicate that the radiomics analysis of the MR Images (T1-w / T2*-map / ADC-map) has excellent potential to help radiologists to differentiate mild from moderate LF and this technique can be considered as a replacement for biopsy.Acknowledgements
This research was supported by Research Center for Molecular and Cellular Imaging (RCMCI) , Tehran University of Medical Sciences & Health Services grant No. 23832. We thank Shahed imaging center director and radiology technologists for their cooperation.References
1. Sebastiani G, Gilbert G. Liver Fibrosis : Review of Current Imaging and MRI Quantification Techniques. Published online 2016. doi:10.1002/jmri.25550
2. Gilbert ÃG, Nguyen ÃBN, Tang A. Liver Fibrosis Quantification by Magnetic Resonance Imaging. 2017;26(6):229-241. doi:10.1097/RMR.0000000000000149
3. Li C, Li R, Zhang W. Progress in non-invasive detection of liver fibrosis. Published online 2018. doi:10.20892/j.issn.2095-3941.2018.0018
4. Hoffman DH, Ayoola A, Nickel D, Han F, Chandarana H, Shanbhogue KP. T1 mapping , T2 mapping and MR elastography of the liver for detection and staging of liver fibrosis. Abdom Radiol. 2020;45(3):692-700. doi:10.1007/s00261-019-02382-9
5. Guimaraes AR, Siqueira L, Uppal R, et al. T2 relaxation time is related to liver fibrosis severity. 2016;6(Ii):103-114. doi:10.21037/qims.2016.03.02
6. Mayerhoefer ME, Materka A, Langs G, et al. Introduction to Radiomics. 2020;61(4):488-495. doi:10.2967/jnumed.118.222893
7. Shaikh F, Dehmeshki J, Bisdas S, et al. Artificial Intelligence-Based Clinical Decision Support Systems Using Advanced Medical Imaging and Radiomics. Curr Probl Diagn Radiol. 2021;50(2):262-267. doi:10.1067/j.cpradiol.2020.05.006
8. Choong C-C, Venkatesh SK, Siew EPY. Accuracy of Routine Clinical Ultrasound for Staging of Liver Fibrosis. J Clin Imaging Sci. 2012;2(3):58. doi:10.4103/2156-7514.101000
9. Denzer UW, Lüth S. Non-invasive diagnosis and monitoring of liver fibrosis and cirrhosis. Best Pract Res Clin Gastroenterol. 2009;23(3):453-460. doi:10.1016/j.bpg.2009.03.002
10. Homayoun H, Ebrahimpour-Komleh H. Automated segmentation of abnormal tissues in medical images. J Biomed Phys Eng. 2021;11(4):415-424. doi:10.31661/jbpe.v0i0.958
11. Ni M, Wang L, Yu H, et al. Radiomics Approaches for Predicting Liver Fibrosis With Nonenhanced T 1 -Weighted Imaging : Comparison of Different Radiomics Models. Published online 2020. doi:10.1002/jmri.27391
12. Schawkat K, Ciritsis A, von Ulmenstein S, et al. Diagnostic accuracy of texture analysis and machine learning for quantification of liver fibrosis in MRI: correlation with MR elastography and histopathology. Eur Radiol. 2020;30(8):4675-4685. doi:10.1007/s00330-020-06831-8
Figures
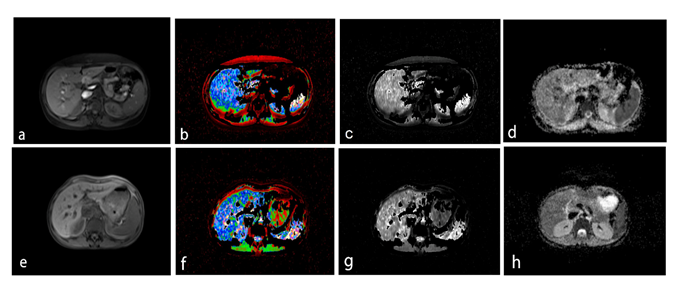
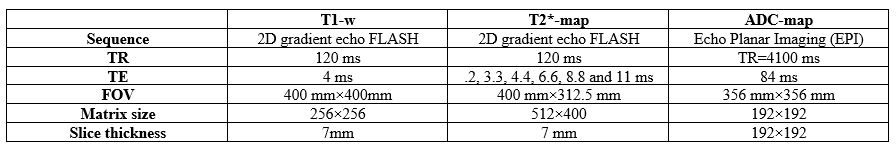
Table 1. Sequences and parameters
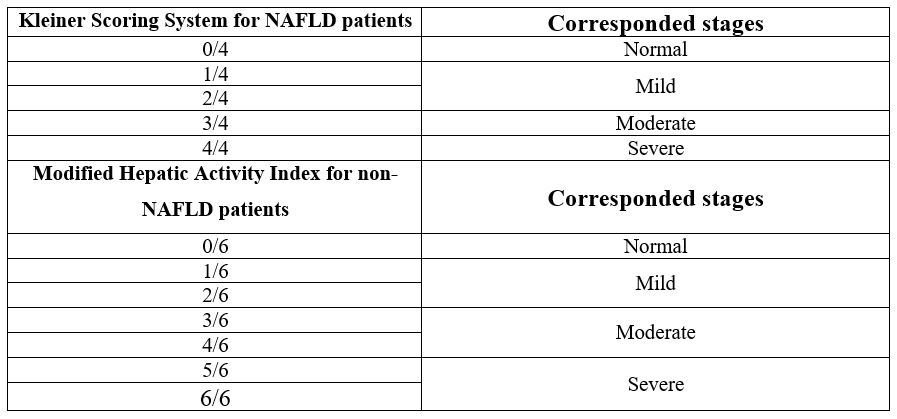
Table 2. Standardization of histopathology scores
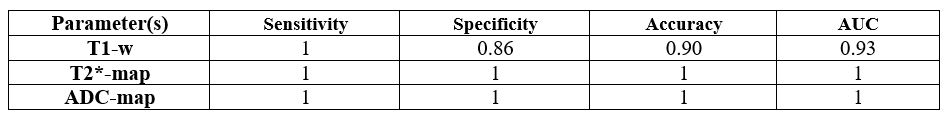
Table 3. Machine learning results